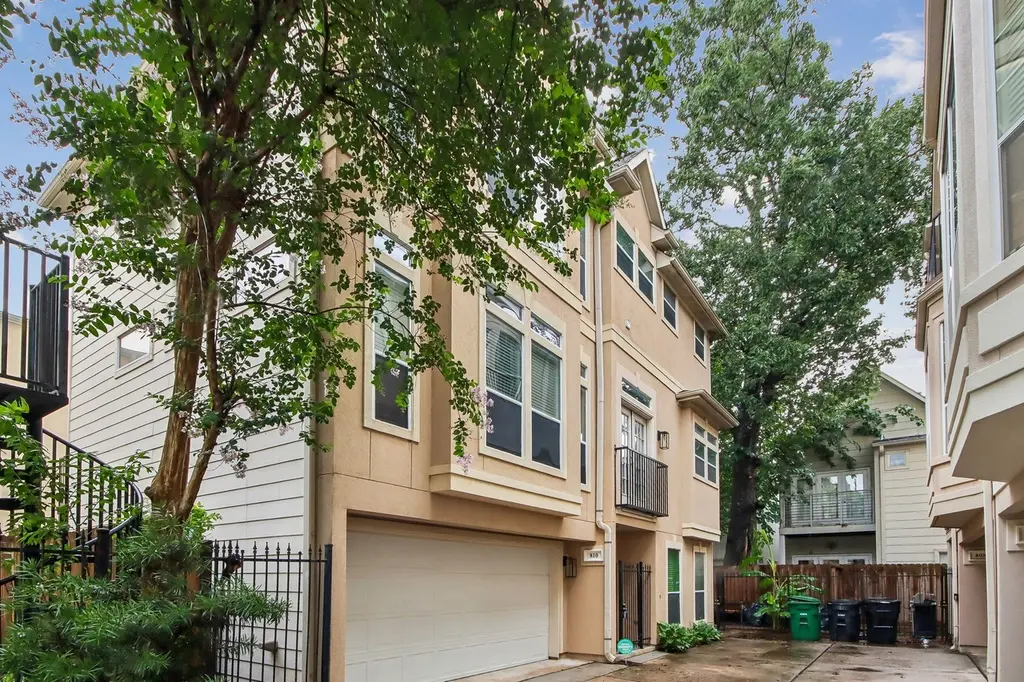
810 Malone St · Houston, TX
Flood risk 4/10 · Minor
- FEMA flood zone
- X (unshaded)
- Chance of flooding over 30 yrs
- 0.2%
- Est. flood insurance / yr
- $507 – $1,088
Fire risk 1/10 · Minimal
- Est. fire insurance / yr
- $1,222 – $2,270
Heat risk 9/10 · Severe
- Hot days now (above 109°F)
- 7 days/yr
- Hot days in 30 yrs
- 24 days/yr
Wind risk 9/10 · Severe
- Chance of severe wind over 30 yrs
- 99.0%
Air-quality risk 3/10 · Minor
- Unhealthy air days now
- 2 days/yr
- Unhealthy air days in 30 yrs
- 3 days/yr
Risk factors via First Street. Map © Google.
Why this score? — see what drove the D grade
The composite is a weighted blend of 9 inputs, each scored 0–100. Each bar is that input's sub-score; the figure is the points it added to the 100-point composite (weight × sub-score).
- ARV discount +13.1/15.0
- Cash flow +12.3/30.0
- 1% rule +4.1/10.0
- Livability +3.7/5.0
- DSCR +3.6/10.0
- Schools +2.7/10.0
- Condition / age +2.5/5.0
- Rent growth +2.3/5.0
- Appreciation +0.0/10.0
$531,573
🖨 Deal sheet (PDF) 📄 Offer letter ✓ Due diligence
Listing remarks MLS
Three bedrooms PLUS first floor flex room and expansive patio in this well-located Rice Military home. First floor includes a bedroom with attached bath plus a room that could be used as a game room, gym, or work-from-home office. Second floor offers a large living area with installed speakers, formal dining and kitchen with stainless appliances. Primary suite with whirlpool bath, stone flooring and vessel sinks, third bedroom and utility room are on the 3rd floor. Over $10K in recent improvements including renovated shower, refinished hardwoods, paint, added electrical and gas line to second floor terrace for a grill. Spacious fenced back patio plus separate covered patio and second floor terrace is made for pets and outdoor entertaining. Walking distance to Memorial Park and the restaurants and nightlife of Washington Avenue.
Key facts
- Private balconies
- Private bedroom
- Formal dining room
Tags
Property features AI
Exterior
- Parking: Attached 2-car garage
- Security: Owned security system
- Utilities: Public water; Public sewer
- Home design: Residential property; Entry levels on first, second and third floors
- Construction: Built in 2002; Stucco and wood siding exterior; Composition roof; Slab foundation
- Exterior features: Subdivision lot; Direction faces south
Interior
- Kitchen: Dishwasher; Disposal; Gas range; Microwave
- Bedrooms: Primary bedroom on third level (16 x 19); Bedroom on third level (13 x 16); Bedroom on first level (11 x 13)
- Flooring: Plank flooring; Tile; Vinyl
- Bathrooms: Three full bathrooms; One half bathroom; Primary bathroom on third level (10 x 16); Bathroom on third level (7 x 9); Half bath on second level (3 x 6); Bathroom on first level (4 x 6)
- Heating & cooling: Central heating (gas); Central electric air conditioning
- Interior features: Balcony; Crown molding; High ceilings; Separate shower; Tub with shower; Gas fireplace; Washer and dryer included; Dishwasher; Disposal; Gas range; Microwave
- Laundry & utility: Washer hookup; Electric dryer hookup; Gas dryer hookup; Utility room (3 x 6)
Neighborhood map
What this means for you Summary
Snapshot
- This is a 3-bed/3.5-bath single-family listed at $532k.
Deal economics
- At list price, monthly cash flow is $-98 ($-1k/yr) — negative.
- To cash-flow at today's rent, offer at most $514k (3.3% below list).
- To meet the 1% rule (rent ≥ 1% of price), the offer needs to be $485k (8.8% below list).
- Recommended offer: $485k (8.8% below list) — sets the bar for 1% rule.
- Cap rate 6.1% vs local median 3.2% in Houston — top-decile yield for the area; either an underpriced asset or a hidden risk that comps aren't pricing in. Stress-test before assuming the spread holds.
Location & tenants
- Location reads 74/100 on livability (#184 in TX, #4,771 nationally) — a middle-class / working-renter tenant base. Strengths: amenities A+, cost of living A+, housing A+; Watch: crime F.
- Houston ISD (urban): math 27% / reading 35% proficiency, ranked #593 of 826 in TX (top 72%) — families likely to look elsewhere, expect single-tenant / working-renter base with shorter leases; 71% free/reduced lunch — lower-income household profile, screen leases tightly.
- Zoned schools: Memorial El (math 52% / reading 52%, grade C-, #742 of 4,322 statewide, top 19%, 424 students, 45% FRL); Hogg Middle (math 44% / reading 48%, grade D+, #462 of 1,662 statewide, top 28%, 1,120 students, 52% FRL); Lamar H S (math 38% / reading 65%, grade D+, #478 of 1,632 statewide, top 29%, 3,125 students, 49% FRL) — zoned schools average 49% FRL vs 71% district-wide (23 pts lower); this property's tenant base skews higher-income than the district average.
- Zoned-school proficiency averages 50% at this address vs 31% district-wide (+19 pts) — the actual schools serving this property are materially stronger than the Houston ISD average implies; a family-tenant draw the district grade alone would hide.
- Market conditions: Rents soft (-0.8%/yr); 651 active listings in the ZIP; 40 comparable units currently listed for rent nearby; rentals at typical pace (median 26d on market — plan ~3-4 weeks tenant-placement turnaround); 42% of comp listings sitting > 30 days — soft ceiling on asking rent; high-income renter base; 29,883 units permitted in Harris County in 2024 (8,621 in 5+ unit buildings).
- This rent runs 40% of the median local income ($145k/yr) — at the standard rent-burdened threshold; future hikes will face affordability resistance.
Forward outlook
- Local home prices are declining (-3.0%/yr); year-one equity from $4k of loan paydown is wiped out by about $16k of value loss. Plan a longer hold.
- Harris County population projected at +47% by 2050 — long-run rental-demand tailwind backs the buy-and-hold thesis.
Negotiation context
- Only 2 days on market — expect competitive offers; lowballing is unlikely to land.
- 12 sale attempts since 16y ago with the ask held roughly flat each time — persistent listings suggest the price (not the market) is what's stuck; bring a comps-based counter.
Risks & watch-outs
- Climate carrying-cost: severe wind risk, 99% chance of damaging wind over 30y; extreme-heat days projected 7→24/yr by 2055 (HVAC capex compounding) — expect insurance premiums to compound above CPI over the hold.
Questions for the listing agent
- What do current leases actually rent for vs. the listed asking? Can we see a recent rent roll and the last 12 months of T-12 income?
- Is there a deadline driving the sale (1031 exchange, divorce, estate, relocation)? That informs how much negotiation room exists.
- Schools are D-rated, which usually means shorter tenancies and higher turnover. Who's the typical renter profile here, and what's been the actual vacancy rate?
- Crime grade is F in this area — have there been break-ins, vandalism, or insurance claims at this property in the last 3 years? What carrier currently insures it and at what premium?
- The area grade is low — what's the realistic commute time and amenity access for the typical tenant pool here? Any planned neighborhood developments (good or bad) we should know about?
- What's the average days-on-market for RENTAL listings here right now (not sales)? A rising rental-DOM trend means longer vacancies and softer asking-rent achievability than the comps imply.
- What's the recent tenant-quality profile in this submarket — average credit score on applications, eviction rate, late-payment / NSF rate, and stable-employment percentage? A property-management company in the area should have these aggregated.
- How much new for-sale + rental construction is in the pipeline within 1–3 miles? Heavy new supply typically softens prices + rents 12–24 months out; constrained supply supports both.
Investment metrics
- 1% rule
- 0.91% ✗
- Cap rate
- 6.07%
- Cash-on-cash
- -0.79%
- DSCR
- 0.96
- GRM
- 9.1
CMA / ARV
- ARV (on-the-fly)
- $606,452
- Comps found
- 12
Show comp detail 12 sales within ~0.75 mi
| Address | Dist | Beds/Ba | Sqft | Sold | Price | $/sf | Match |
|---|---|---|---|---|---|---|---|
| 802 Detering St | 0.18mi | 3/3.0 | 2,567 (+2%) | 1mo | $645,000 | $251 | 85 |
| 509 Malone St | 0.17mi | 3/2.5 | 2,626 (+5%) | 2mo | $680,000 | $259 | 79 |
| 5218A Rose St | 0.27mi | 3/3.5 | 2,380 (-5%) | 0mo | $600,000 | $252 | 79 |
| 5602 Schuler St | 0.23mi | 3/3.5 | 2,677 (+7%) | 1mo | $495,000 | $185 | 77 |
| 1520 Malone St | 0.37mi | 3/4.0 | 2,557 (+2%) | 1mo | $539,000 | $211 | 77 |
| 5612 Lacy St | 0.33mi | 3/3.5 | 2,380 (-5%) | 1mo | $547,000 | $230 | 75 |
| 5209 Gibson St Unit A | 0.38mi | 3/3.5 | 2,688 (+7%) | 2mo | $650,000 | $242 | 69 |
| 1628 Mcdonald St | 0.57mi | 3/3.5 | 2,420 (-3%) | 1mo | $575,000 | $238 | 67 |
| 1510 Birdsall St | 0.36mi | 3/3.5 | 2,268 (-10%) | 1mo | $389,000 | $172 | 67 |
| 5410A Nolda St | 0.49mi | 3/3.5 | 2,346 (-6%) | 1mo | $669,900 | $286 | 66 |
| 5202 Chandler St | 0.50mi | 3/2.5 | 2,362 (-6%) | 1mo | $615,000 | $260 | 62 |
| 5310 Larkin St Unit B | 0.71mi | 3/3.5 | 2,354 (-6%) | 1mo | $399,000 | $169 | 56 |
Match score weights: distance 35% · size 25% · config 20% · recency 20%. Top-matched comps best support the ARV.
Projected returns pro-forma
-3.0% appreciation · 0.0% rent growth · sell at horizon
- IRR
- -21.2%
- Equity multiple
- 0.29×
- Total profit
- $-106,348
- Equity at exit
- $79,259
- IRR
- -24.7%
- Equity multiple
- -0.04×
- Total profit
- $-154,605
- Equity at exit
- $45,961
Cash invested: $148,840 (down + closing). Projections, not guarantees.
Landlord ↔ Tenant lean methodology
- Overall (STATE)
- 87 Strongly Landlord-Friendly
- State Texas
- 87 Strongly Landlord-Friendly · R+5
- County
- — inherits STATE
- City
- — inherits STATE
ZIP-level market 77007
- Rents YoY
- -0.8%
- Active inventory
- 651
- Price-to-rent
- 9.1×
Monthly cashflow live
- Estimated rent
- $4,848 high interval (Pro) →
- Mortgage (P&I)
- −$2,788
- Tax from tax record
- −$918 /mo · $11,022/yr
- Insurance
- −$221
- HOA
- −$0
- Vacancy / Maint / Mgmt
- −$1,018
- Net cashflow
- $-98
Break-even live
Sensitivity live
| Price | -10% $203 | -5% $53 | +0% $-98 | +5% $-248 | +10% $-399 |
|---|---|---|---|---|---|
| Rent | -10% $-481 | -5% $-289 | +0% $-98 | +5% $94 | +10% $285 |
| Rate | -1.0pp $170 | -0.5pp $37 | base $-98 | +0.5pp $-236 | +1.0pp $-376 |
UW: 25.0% down · 7.5% · 30yr · 1.5% tax · 5.0% vac · 8.0% maint · 8.0% mgmt
Financing live
Cash to close
- Down payment
- $132,893
- Closing costs
- $15,947
- Reserves months
- —
- Total cash needed
- —
Loan-product check · same deal, 3 products live
Conventional
25% down · 7.5% · 30yr
- Down + closing
- —
- Monthly P&I
- —
- Monthly cashflow
- —
- DSCR
- —
- Eligible?
- —
Personal DTI + credit; lowest rate.
DSCR
20% down · 8.5% · 30yr
- Down + closing
- —
- Monthly P&I
- —
- Monthly cashflow
- —
- DSCR
- —
- Eligible?
- —
No personal income docs; deal must DSCR.
Hard money
10% down · 12.0% · 12mo
- Down + closing
- —
- Monthly P&I
- —
- Monthly cashflow
- —
- DSCR
- —
- Eligible?
- —
Short-term bridge; refi at stabilization.
Rent comps 40 comps
| Address | Beds | Baths | Sqft | Rent | $/sqft | DOM | Units | Dist |
|---|---|---|---|---|---|---|---|---|
| 920 Westcott St Houston, TX | 1.0–2.0 | 1.0–2.0 | 1175 | $3,306 | $2.81 | 0d | 28 | 0.21mi |
| 5610 Schuler St Houston, TX | 3.0 | 3.5 | 2614 | $3,111 | $1.19 | 7d | 1 | 0.25mi |
| 5305 Nett St Unit A Houston, TX | 3.0 | 3.5 | 2104 | $2,950 | $1.40 | 26d | 1 | 0.26mi |
| 5237 Center St Houston, TX | 3.0 | 3.0 | 2284 | $2,995 | $1.31 | 45d | 1 | 0.28mi |
| 929 Westcott St Houston, TX | 1.0–3.0 | 1.0–3.0 | 1375 | $9,263 | $6.74 | 1d | 21 | 0.28mi |
| 5811 Maxie St Houston, TX | 3.0 | 3.5 | 2226 | $3,000 | $1.35 | 45d | 1 | 0.35mi |
| 5201 Memorial Dr Houston, TX | 1.0–2.0 | 1.0–2.5 | 1071 | $3,361 | $3.14 | 0d | 16 | 0.58mi |
| 2103 Radcliffe St Unit 1225772P Houston, TX | 3.0 | 2.0 | 1797 | $4,729 | $2.63 | 9d | 1 | 0.66mi |
| 4917 Nolda St Houston, TX | 3.0 | 3.5 | 1764 | $5,000 | $2.83 | 26d | 1 | 0.67mi |
| 4608 Nett St Houston, TX | 3.0 | 4.0 | 2261 | $3,750 | $1.66 | 45d | 1 | 0.71mi |
| 2210 Radcliffe St Houston, TX | 3.0 | 3.5 | 2066 | $2,716 | $1.31 | 9d | 1 | 0.73mi |
| 5336 Darling St Unit 1225767P Houston, TX | 3.0 | 3.0 | 2292 | $5,997 | $2.62 | 1d | 1 | 0.77mi |
| 5108 Larkin St Houston, TX | 3.0 | 3.5 | 2108 | $2,850 | $1.35 | 46d | 1 | 0.80mi |
| 5235 Petty St Unit B Houston, TX | 3.0 | 2.5 | 2532 | $3,000 | $1.18 | 45d | 1 | 0.81mi |
| 4444 Center St Houston, TX | 3.0 | 3.0 | 2121 | $3,200 | $1.51 | 45d | 1 | 0.81mi |
| 5620 Petty St Houston, TX | 4.0 | 3.5 | 2891 | $8,750 | $3.03 | 45d | 1 | 0.84mi |
| 5620 Petty St Unit 1019538P Houston, TX | 4.0 | 3.5 | 2884 | $16,259 | $5.64 | 24d | 1 | 0.84mi |
| 5732 Darling St Unit 1056419P Houston, TX | 3.0 | 3.5 | 2400 | $7,771 | $3.24 | 45d | 1 | 0.86mi |
| 5530 Kiam St Houston, TX | 4.0 | 2.5 | 2688 | $9,750 | $3.63 | 45d | 1 | 0.87mi |
| 5530 Kiam St Unit 1019540P Houston, TX | 4.0 | 2.5 | 2680 | $15,799 | $5.90 | 45d | 1 | 0.87mi |
| 5427 Kansas St Houston, TX | 3.0 | 4.0 | 2156 | $2,700 | $1.25 | 45d | 1 | 0.87mi |
| 543 T C Jester Blvd Unit 1225766P Houston, TX | 3.0 | 3.5 | 2389 | $5,557 | $2.33 | 1d | 1 | 0.88mi |
| 4510 Inker St Houston, TX | 4.0 | 4.0 | 2293 | $4,500 | $1.96 | 45d | 1 | 0.88mi |
| 915 Thompson St Unit 915 Houston, TX | 4.0 | 3.5 | 3200 | $8,500 | $2.66 | 26d | 1 | 0.89mi |
| 913 Thompson St #913 Houston, TX | 4.0 | 3.5 | 3200 | $8,500 | $2.66 | 26d | 1 | 0.89mi |
| 911 Thompson St #911 Houston, TX | 4.0 | 3.5 | 3200 | $8,500 | $2.66 | 26d | 1 | 0.89mi |
| 917 Thompson St Unit 917 Houston, TX | 4.0 | 3.5 | 3200 | $8,000 | $2.50 | 26d | 1 | 0.89mi |
| 4307 Feagan St Unit A Houston, TX | 3.0 | 4.0 | 2412 | $3,590 | $1.49 | 1d | 1 | 0.94mi |
| 4311 Marina St Houston, TX | 3.0 | 4.0 | 2328 | $3,599 | $1.55 | 45d | 1 | 0.96mi |
| 1221 Bonner St Houston, TX | 3.0 | 3.5 | 2252 | $3,200 | $1.42 | 45d | 1 | 0.98mi |
| 707 Marston St Unit 510 Houston, TX | 3.0 | 2.0 | 2310 | $12,474 | $5.40 | 0d | 1 | 1.03mi |
| 811 Buffalo Park Dr Unit 844 Houston, TX | 3.0 | 2.0 | 3632 | $14,913 | $4.11 | 15d | 1 | 1.13mi |
| 811 Buffalo Park Dr Unit 3187 Houston, TX | 3.0 | 2.0 | 3632 | $15,384 | $4.24 | 0d | 1 | 1.13mi |
| 811 Buffalo Park Dr Unit 510 Houston, TX | 3.0 | 2.0 | 3632 | $15,424 | $4.25 | 13d | 1 | 1.13mi |
| 1027 Gross St Houston, TX | 4.0 | 3.5 | 3035 | $5,800 | $1.91 | 45d | 1 | 1.15mi |
| 3333 Allen Pkwy Unit 1000 Houston, TX | 2.0 | 2.5 | 1860 | $4,500 | $2.42 | 45d | 1 | 1.25mi |
| 1958 W Gray St Unit 1991 Houston, TX | 3.0 | 2.0 | 3206 | $15,050 | $4.69 | 12d | 1 | 1.29mi |
| 1958 W Gray St Unit 3165 Houston, TX | 3.0 | 2.0 | 3206 | $15,010 | $4.68 | 0d | 1 | 1.29mi |
| 1951 W Bell St Houston, TX | 3.0 | 2.0 | 1800 | $2,400 | $1.33 | 45d | 1 | 1.38mi |
| 1951 W Bell St Houston, TX | 3.0 | 2.0 | 1800 | $2,400 | $1.33 | 16d | 1 | 1.38mi |
Listing history 2 events
-
2026-06-21remarks 699-char remark
-
2026-06-21$531,573 Active 2 DOM
ⓘ Source: listings_history table (triggers on properties + properties_extension) + one-shot
backfill from property_details.listing_events for pre-trigger history.
Tax reassessment forecast TX · Resets to sale price
- Current annual tax
- $11,022 · $918/mo
- Projected year-2 tax
- $11,022 · $918/mo
- Expected delta
- $0/yr ($0/mo · 0.0%)
ⓘ Screening estimate from a state-policy table — verify with the county assessor before closing.
Climate risk First Street
- Flood 4/10 Moderate FEMA zone X (unshaded) · 20% chance over 30 yrs
- Wildfire 1/10 Low
- Heat 9/10 Extreme 7 d/yr ≥109°F today · 24 d/yr by 30 yrs out
- Wind 9/10 Extreme 99% chance of damaging wind over 30 yrs
- Air quality 3/10 Moderate 2 unhealthy d/yr today · 3 by 30 yrs out
Nearby sold comps map
Loading sold comps map…
Walkable amenities ~0.75 mi
Loading nearby amenities…
Taxation est. · year 1
- Rental income
- $58,173
- − Mortgage interest
- −$29,776
- − Property taxes
- −$11,022
- − Insurance
- −$2,658
- − Repairs & maintenance
- −$4,654
- − Management
- −$4,654
- − Depreciation
- −$15,464
- Taxable loss
- −$10,055
- Est. tax savings @ 24.0%
- +$2,413
- After-tax cash flow
- $1,239/yr
For passive investors: Depreciation is non-cash, so a rental often shows a tax loss while cash-flowing — sheltering income. Rental losses are passive: they offset passive income freely, and up to $25,000/yr can offset ordinary (W-2) income if you actively participate and your MAGI is under $100k (phasing out to $0 by $150k); unused losses carry forward. On sale, claimed depreciation is recaptured at up to 25%, and gains may owe capital-gains tax (a 1031 exchange can defer both). Figures are a year-1 estimate at your 24.0% rate — not tax advice; consult a CPA.
Schools (NCES district)
- District
- Houston ISD
- NCES district ID
- 4823640
- Math proficiency
- 27% ▼ -18.00%
- Reading proficiency
- 35% ▼ -6.00%
- Median HH income
- $46,054
- Composite
- 26.63/100
- National rank
- #7173
- State rank
- #593 of 826 in TX
Livability — Houston
- Score
- 74/100
- State rank
- #184
- US rank
- #4771
Category grades
Schools grade is shown separately in the Schools card above.
Census & demographics
- Census place
- Houston, TX
- County
- Harris County · 4,702,590 people
- City population
- 3,226,434
- Metro
- Houston-The Woodlands-Sugar Land, TX
- Population (ZIP)
- 47,808
- Household income
- $144,911
- Rent vs Own
- Severe rent burden
- 1812.0
Population outlook (Harris County) Hauer SSP2
- Today (2025)
- 5,571,493 people
- By 2030
- 6,089,821 · +9.3%
- By 2040
- 7,142,806 · +28.2%
- By 2050
- 8,185,864 · +46.9%
- By 2075
- 10,574,329 · +89.8%
- By 2100
- 12,109,958 · +117.4%
Race, ethnicity, and origin ACS 2023
- Neighborhood character
- Diverse neighborhood (Simpson 0.63)
- Race & ethnicity
- White 57% Hispanic / Latino 17% Two or more races 13% Asian 11% Black 9%
- Hispanic origin (detail)
- Mexican 12%
- Common ancestry
- Slovak 3% Romanian 3% Italian 3%
- Foreign-born
- 19% · Canada, China, South Korea
- Languages at home
- 75% English-only · Spanish 12% Other Indo-European 4% Chinese 2%
Political lean MEDSL · Harris
- 2024 margin
- Lean D (+5.5) · D 52.0% · R 46.4% · Other 1.6%
- 2008→2024 swing
- +3.9pp toward D · 2008: 1.6pp · 2024: 5.5pp
- All cycles
- 2024: D+5.5 2020: D+13.3 2016: D+12.4 2012: D+0.1 2008: D+1.6
Not yet ingested
- Civics
- —
Market trends
- HPI YoY
- ▼ -219.42%
- Current HPI
- 159.8157
- Rent YoY
- ▼ -0.83%
- Metro
- Houston-The Woodlands-Sugar Land, TX
- State GDP YoY
- ▲ 3.95%
- F500 in state
- 110
Industry mix (Fortune 500 HQ in TX)
| Industry | F500 HQs | Revenue |
|---|---|---|
| Energy | 16 | $1,198B |
|
||
| Technology | 5 | $198B |
|
||
| Engineering / Construction | 4 | $72B |
|
||
| Energy Services | 3 | $60B |
|
||
| Utilities | 3 | $41B |
|
||
| Healthcare | 2 | $330B |
|
||
Price history
+32.9% since first listed38 events — show timeline
- 2026-06-19 Listed $531,573 HARMLS
- 2024-06-15 Rental Removed $3,500 HARMLS
- 2024-06-14 Listing Removed — HARMLS
- 2024-04-12 Price Changed $525,000 HARMLS
- 2024-03-02 Listed for Rent $3,500 HARMLS
- 2024-02-17 Listed $530,000 HARMLS
- 2024-02-12 Coming Soon — HARMLS
- 2021-03-11 Sold (Public Records) — Public Records
- 2021-03-11 Sold (Public Records) — Public Records
- 2021-03-08 Sold (MLS) — HARMLS
- 2021-03-03 Pending — HARMLS
- 2021-02-13 Pending — HARMLS
- 2021-02-05 Pending — HARMLS
- 2021-01-26 Listed $460,000 HARMLS
- 2019-06-20 Sold (Public Records) — Public Records
- 2019-06-20 Sold (MLS) — HARMLS
- 2019-05-23 Pending — HARMLS
- 2019-05-14 Pending — HARMLS
- 2019-01-02 Price Changed $469,000 HARMLS
- 2018-11-06 Price Changed $479,900 HARMLS
- 2018-08-24 Listed $489,000 HARMLS
- 2011-01-05 Sold (Public Records) — Public Records
- 2010-12-29 Sold (MLS) — HARMLS
- 2010-11-24 Listing Removed — HARMLS
- 2010-10-20 Listing Removed — HARMLS
- 2010-09-30 Listed $364,900 HARMLS
- 2010-09-30 Listed $349,900 HARMLS
- 2010-09-16 Listing Removed — HARMLS
- 2010-08-18 Listing Removed — HARMLS
- 2010-08-18 Listed $374,900 HARMLS
- 2010-08-13 Listing Removed — HARMLS
- 2010-08-13 Listed $374,900 HARMLS
- 2010-04-13 Listed $374,900 HARMLS
- 2010-04-11 Listing Removed — HARMLS
- 2010-03-24 Listing Removed — HARMLS
- 2010-03-24 Listed $399,900 HARMLS
- 2010-03-11 Listed $399,900 HARMLS
- 2006-05-30 Sold (Public Records) — Public Records
Property tax history
+1.4%/yrLatest (2025): $11,022 · +6.1% YoY. Source: county tax records.
Cash-flow waterfall
monthlySold comps — $/sqft
last 12 mo · ≤1 miLoading sold comps…