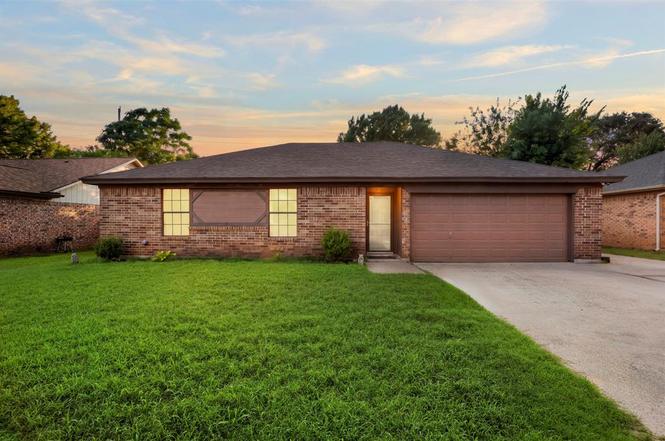
6200 Big Springs Dr · Arlington, TX
Flood risk 6/10 · Moderate
- FEMA flood zone
- X (unshaded)
- Chance of flooding over 30 yrs
- 0.73%
- Est. flood insurance / yr
- $507 – $1,088
Fire risk 3/10 · Minor
- Est. fire insurance / yr
- $1,222 – $2,270
Heat risk 7/10 · Major
- Hot days now (above 109°F)
- 7 days/yr
- Hot days in 30 yrs
- 24 days/yr
Wind risk 6/10 · Moderate
- Chance of severe wind over 30 yrs
- 27.0%
Air-quality risk 3/10 · Minor
- Unhealthy air days now
- 2 days/yr
- Unhealthy air days in 30 yrs
- 3 days/yr
Risk factors via First Street. Map © Google.
Why this score? — see what drove the D grade
The composite is a weighted blend of 9 inputs, each scored 0–100. Each bar is that input's sub-score; the figure is the points it added to the 100-point composite (weight × sub-score).
- Cash flow +11.1/30.0
- ARV discount +10.2/15.0
- 1% rule +3.9/10.0
- Livability +3.9/5.0
- DSCR +3.2/10.0
- Schools +3.0/10.0
- Condition / age +2.5/5.0
- Rent growth +2.4/5.0
- Appreciation +0.0/10.0
$249,500
🖨 Deal sheet (PDF) 📄 Offer letter ✓ Due diligence
Listing remarks
Location, location, location! Welcome to 6200 Big Springs Drive in Arlington, Texas. Priced at just $249,500, this 3-bedroom, 2-bath home offers an incredible opportunity to own in one of Arlington’s most convenient locations. Ideally situated near major highways, this home provides quick access to shopping, dining, entertainment, and everything the DFW Metroplex has to offer. Just minutes from Arlington’s world-famous stadium district and the excitement surrounding the FIFA World Cup, you’ll love being close to some of the area’s most popular destinations. Inside, you’ll find a functional floor plan with comfortable living spaces, spacious bedrooms, and plenty
Key facts
- Convenient location
- Easy access to parks
- 6,665 sq ft lot
Tags
Property features AI
Finance
- Other: Subdivision: Glen View Add; Directions provided to property
- Financial info: Listing terms: Cash, Conventional, FHA, VA
- HOA & community: No association
Exterior
- Parking: Attached 2-car garage; Covered parking for 2; Driveway; Garage faces front; 2-car single door; No carport spaces
- Utilities: City water; City sewer; Municipal utility district: No
- Home design: Single family residence; One story; Residential property; Built in 1984
- Construction: Brick construction; Composition roof; Preowned (built 1984)
- Exterior features: Covered porch(es); Wood fencing; Few trees; Interior lot
Interior
- Kitchen: Dishwasher; Electric cooktop; Electric oven; Microwave
- Bedrooms: 3 bedrooms (primary bedroom on level 1)
- Flooring: Ceramic tile
- Bathrooms: 2 full bathrooms
- Heating & cooling: Central heating (electric); Central air (electric); Ceiling fan(s)
- Interior features: Vaulted ceilings; Cable TV available; High-speed internet available; One living area; One dining area; Total living area 1320
- Laundry & utility: No specific laundry details provided
Neighborhood map
What this means for you Summary
Snapshot
- This is a 3-bed/2.0-bath single-family listed at $250k.
Deal economics
- At list price, monthly cash flow is $-102 ($-1k/yr) — negative.
- To cash-flow at today's rent, offer at most $232k (7.2% below list).
- To meet the 1% rule (rent ≥ 1% of price), the offer needs to be $221k (11.4% below list).
- Recommended offer: $221k (11.4% below list) — sets the bar for 1% rule.
- Cap rate 5.8% vs local median 3.7% in Arlington — top-decile yield for the area; either an underpriced asset or a hidden risk that comps aren't pricing in. Stress-test before assuming the spread holds.
Location & tenants
- Location reads 78/100 on livability (#75 in TX, #2,697 nationally) — a middle-class / working-renter tenant base. Strengths: amenities A+, cost of living A+, housing A+; Watch: crime F, commute F.
- Kennedale ISD (suburban): math 27% / reading 37% proficiency, ranked #522 of 826 in TX (top 63%) — families likely to look elsewhere, expect single-tenant / working-renter base with shorter leases.
- Zoned schools: R F Patterson El (math 22% / reading 22%, grade F, #3,333 of 4,322 statewide, top 80%, 566 students, 61% FRL) — zoned schools average 61% FRL vs 38% district-wide (23 pts higher); higher-poverty schools than district average — tighter screening recommended.
- Market conditions: Rents soft (-0.3%/yr); 146 active listings in the ZIP; 40 comparable units currently listed for rent nearby; rentals at typical pace (median 22d on market — plan ~3-4 weeks tenant-placement turnaround); solid renter incomes; 18,938 units permitted in Tarrant County in 2024 (8,336 in 5+ unit buildings).
Forward outlook
- Local home prices are declining (-3.0%/yr); year-one equity from $2k of loan paydown is wiped out by about $7k of value loss. Plan a longer hold.
- Tarrant County population projected at +41% by 2050 — long-run rental-demand tailwind backs the buy-and-hold thesis.
Negotiation context
- Only 1 days on market — expect competitive offers; lowballing is unlikely to land.
Risks & watch-outs
- Climate carrying-cost: major flood risk; major wind risk, 27% chance of damaging wind over 30y; extreme-heat days projected 7→24/yr by 2055 (HVAC capex compounding) — expect insurance premiums to compound above CPI over the hold.
Questions for the listing agent
- What do current leases actually rent for vs. the listed asking? Can we see a recent rent roll and the last 12 months of T-12 income?
- Is there a deadline driving the sale (1031 exchange, divorce, estate, relocation)? That informs how much negotiation room exists.
- Schools are D-rated, which usually means shorter tenancies and higher turnover. Who's the typical renter profile here, and what's been the actual vacancy rate?
- Crime grade is F in this area — have there been break-ins, vandalism, or insurance claims at this property in the last 3 years? What carrier currently insures it and at what premium?
- The area grade is low — what's the realistic commute time and amenity access for the typical tenant pool here? Any planned neighborhood developments (good or bad) we should know about?
- What's the average days-on-market for RENTAL listings here right now (not sales)? A rising rental-DOM trend means longer vacancies and softer asking-rent achievability than the comps imply.
- What's the recent tenant-quality profile in this submarket — average credit score on applications, eviction rate, late-payment / NSF rate, and stable-employment percentage? A property-management company in the area should have these aggregated.
- How much new for-sale + rental construction is in the pipeline within 1–3 miles? Heavy new supply typically softens prices + rents 12–24 months out; constrained supply supports both.
Investment metrics
- 1% rule
- 0.89% ✗
- Cap rate
- 5.80%
- Cash-on-cash
- -1.74%
- DSCR
- 0.92
- GRM
- 9.4
CMA / ARV
- ARV (on-the-fly)
- $265,320
- Comps found
- 12
Show comp detail 12 sales within ~0.75 mi
| Address | Dist | Beds/Ba | Sqft | Sold | Price | $/sf | Match |
|---|---|---|---|---|---|---|---|
| 6009 Maple Springs Dr | 0.14mi | 3/2.0 | 1,314 (-0%) | 2mo | $275,000 | $209 | 91 |
| 6221 Maple Springs Dr | 0.13mi | 3/2.0 | 1,397 (+6%) | 2mo | $294,900 | $211 | 82 |
| 6114 Big Springs Dr | 0.01mi | 3/2.0 | 1,397 (+6%) | 9mo | $259,900 | $186 | 82 |
| 4400 Willow Crest Dr | 0.44mi | 3/2.0 | 1,320 (0%) | 2mo | $265,000 | $201 | 78 |
| 6219 Kelly Elliott Rd | 0.25mi | 3/2.0 | 1,233 (-7%) | 0mo | $250,000 | $203 | 77 |
| 6102 Kelly Elliott Dr | 0.27mi | 3/2.0 | 1,190 (-10%) | 4mo | $238,000 | $200 | 68 |
| 5910 Willow View Dr | 0.51mi | 3/2.0 | 1,415 (+7%) | 4mo | $284,900 | $201 | 61 |
| 6003 Springwood Dr | 0.32mi | 3/2.0 | 1,190 (-10%) | 12mo | $250,000 | $210 | 59 |
| 3906 Cedarwood Ct | 0.55mi | 3/2.0 | 1,409 (+7%) | 5mo | $288,700 | $205 | 59 |
| 4111 Cypress Springs Dr | 0.49mi | 3/2.0 | 1,399 (+6%) | 12mo | $270,000 | $193 | 57 |
| 4201 Highgrove Dr | 0.70mi | 3/2.0 | 1,441 (+9%) | 6mo | $269,900 | $187 | 47 |
| 5705 Kingstree Ct | 0.50mi | 2/2.0 (-1) | 1,496 (+13%) | 11mo | $269,900 | $180 | 40 |
Match score weights: distance 35% · size 25% · config 20% · recency 20%. Top-matched comps best support the ARV.
Projected returns pro-forma
-3.0% appreciation · 0.0% rent growth · sell at horizon
- IRR
- -22.8%
- Equity multiple
- 0.24×
- Total profit
- $-53,261
- Equity at exit
- $37,201
- IRR
- -28.7%
- Equity multiple
- -0.13×
- Total profit
- $-79,286
- Equity at exit
- $21,572
Cash invested: $69,860 (down + closing). Projections, not guarantees.
Landlord ↔ Tenant lean methodology
- Overall (STATE)
- 87 Strongly Landlord-Friendly
- State Texas
- 87 Strongly Landlord-Friendly · R+5
- County
- — inherits STATE
- City
- — inherits STATE
ZIP-level market 76001
- Home prices YoY
- -8.6%
- Rents YoY
- -0.3%
- Active inventory
- 146
- Price-to-rent
- 9.4×
Monthly cashflow live
- Estimated rent
- $2,210 high interval (Pro) →
- Mortgage (P&I)
- −$1,308
- Tax from tax record
- −$435 /mo · $5,216/yr
- Insurance
- −$104
- HOA
- −$0
- Vacancy / Maint / Mgmt
- −$464
- Net cashflow
- $-102
Break-even live
Sensitivity live
| Price | -10% $40 | -5% $-31 | +0% $-102 | +5% $-172 | +10% $-243 |
|---|---|---|---|---|---|
| Rent | -10% $-276 | -5% $-189 | +0% $-102 | +5% $-14 | +10% $73 |
| Rate | -1.0pp $24 | -0.5pp $-38 | base $-102 | +0.5pp $-166 | +1.0pp $-232 |
UW: 25.0% down · 7.5% · 30yr · 1.5% tax · 5.0% vac · 8.0% maint · 8.0% mgmt
Financing live
Cash to close
- Down payment
- $62,375
- Closing costs
- $7,485
- Reserves months
- —
- Total cash needed
- —
Loan-product check · same deal, 3 products live
Conventional
25% down · 7.5% · 30yr
- Down + closing
- —
- Monthly P&I
- —
- Monthly cashflow
- —
- DSCR
- —
- Eligible?
- —
Personal DTI + credit; lowest rate.
DSCR
20% down · 8.5% · 30yr
- Down + closing
- —
- Monthly P&I
- —
- Monthly cashflow
- —
- DSCR
- —
- Eligible?
- —
No personal income docs; deal must DSCR.
Hard money
10% down · 12.0% · 12mo
- Down + closing
- —
- Monthly P&I
- —
- Monthly cashflow
- —
- DSCR
- —
- Eligible?
- —
Short-term bridge; refi at stabilization.
Rent comps 40 comps
| Address | Beds | Baths | Sqft | Rent | $/sqft | DOM | Units | Dist |
|---|---|---|---|---|---|---|---|---|
| 6117 Autumn Springs Dr Arlington, TX | 3.0 | 2.0 | 1710 | $1,970 | $1.15 | 25d | 1 | 0.02mi |
| 6108 Paradise Dr Arlington, TX | 3.0 | 2.0 | 1437 | $2,295 | $1.60 | 8d | 1 | 0.08mi |
| 6217 Cool Springs Dr Arlington, TX | 3.0 | 2.0 | 1723 | $1,965 | $1.14 | 25d | 1 | 0.14mi |
| 3924 Wentworth Dr Arlington, TX | 3.0 | 2.0 | 1456 | $2,000 | $1.37 | 44d | 1 | 0.15mi |
| 6102 Cool Springs Dr Arlington, TX | 3.0 | 2.0 | 1320 | $2,075 | $1.57 | 13d | 1 | 0.16mi |
| 6102 Cool Springs Dr Arlington, TX | 3.0 | 2.0 | 1320 | $2,075 | $1.57 | 22d | 1 | 0.16mi |
| 6001 Maple Springs Dr Arlington, TX | 3.0 | 2.0 | 1302 | $1,900 | $1.46 | 4d | 1 | 0.18mi |
| 6001 Maple Springs Dr Arlington, TX | 3.0 | 2.0 | 1302 | $1,900 | $1.46 | 17d | 1 | 0.18mi |
| 6219 Kelly Elliott Rd Arlington, TX | 3.0 | 2.0 | 1233 | $1,999 | $1.62 | 44d | 1 | 0.24mi |
| 6219 Kelly Elliott Rd Arlington, TX | 3.0 | 2.0 | 1233 | $1,900 | $1.54 | 7d | 1 | 0.24mi |
| 6204 Kelly Elliott Rd Arlington, TX | 3.0 | 2.0 | 1233 | $1,810 | $1.47 | 3d | 1 | 0.24mi |
| 6226 Hott Springs Dr Arlington, TX | 3.0 | 2.0 | 1798 | $2,045 | $1.14 | 44d | 1 | 0.24mi |
| 6306 Big Springs Dr Arlington, TX | 3.0 | 2.0 | 1550 | $2,045 | $1.32 | 2d | 1 | 0.25mi |
| 6104 Kelly Elliott Rd Arlington, TX | 3.0 | 2.0 | 1542 | $1,995 | $1.29 | 22d | 1 | 0.25mi |
| 6308 Glen Echo Ln Arlington, TX | 3.0 | 2.0 | 1767 | $2,250 | $1.27 | 22d | 1 | 0.27mi |
| 6100 Springwood Dr Arlington, TX | 3.0 | 2.0 | 1190 | $1,975 | $1.66 | 21d | 1 | 0.31mi |
| 4104 Firethorn Dr Arlington, TX | 3.0 | 2.0 | 1700 | $2,385 | $1.40 | 21d | 1 | 0.36mi |
| 6415 Elm Springs Dr Arlington, TX | 3.0 | 2.0 | 1710 | $2,100 | $1.23 | 25d | 1 | 0.41mi |
| 5714 Louise Way Dr Arlington, TX | 3.0 | 2.0 | 1835 | $2,195 | $1.20 | 6d | 1 | 0.53mi |
| 5714 Louise Way Dr Arlington, TX | 3.0 | 2.0 | 1835 | $2,195 | $1.20 | 44d | 1 | 0.53mi |
| 6215 Roby Dr Arlington, TX | 3.0 | 2.5 | 1720 | $2,595 | $1.51 | 44d | 1 | 0.64mi |
| 5715 Woodsetter Ct Arlington, TX | 3.0 | 2.0 | 1116 | $1,900 | $1.70 | 7d | 1 | 0.73mi |
| 5617 Espanola Dr Arlington, TX | 3.0 | 2.0 | 1240 | $1,900 | $1.53 | 20d | 1 | 0.73mi |
| 6600 Rivertrail Cir Arlington, TX | 1.0–3.0 | 1.0–2.0 | 931 | $1,961 | $2.11 | 2d | 15 | 0.77mi |
| 4901 Pacific Dr Arlington, TX | 1.0–3.0 | 1.0–2.0 | 1015 | $1,573 | $1.55 | 3d | 35 | 0.79mi |
| 6504 Falcon River Way Arlington, TX | 1.0–3.0 | 1.0–2.0 | 903 | $2,308 | $2.55 | 3d | 39 | 0.86mi |
| 5317 Windy Meadow Dr Arlington, TX | 3.0 | 2.0 | 1413 | $1,900 | $1.34 | 44d | 1 | 0.96mi |
| 3100 Joplin Rd Kennedale, TX | 1.0–3.0 | 1.0–3.0 | 1151 | $2,865 | $2.49 | 2d | 45 | 0.99mi |
| 5104 Conchos Trl Arlington, TX | 3.0 | 2.0 | 1664 | $2,361 | $1.42 | 44d | 1 | 1.05mi |
| 5021 Bayberry Dr Arlington, TX | 3.0 | 2.0 | 1362 | $2,300 | $1.69 | 25d | 1 | 1.06mi |
| 5315 San Mateo Ct Arlington, TX | 3.0 | 3.0 | 1482 | $2,000 | $1.35 | 8d | 1 | 1.07mi |
| 5900 U.S. 287 Frontage Rd Arlington, TX | 2.0–3.0 | 2.5 | 1295 | $2,714 | $2.10 | 3d | 10 | 1.11mi |
| 6109 Kingswood Dr Arlington, TX | 3.0 | 2.0 | 1759 | $2,195 | $1.25 | 44d | 1 | 1.12mi |
| 5402 Rimrock Ct Arlington, TX | 4.0 | 2.0 | 1740 | $2,400 | $1.38 | 44d | 1 | 1.17mi |
| 5703 Sterling Green Trl Arlington, TX | 3.0 | 2.0 | 1364 | $1,885 | $1.38 | 44d | 1 | 1.26mi |
| 4707 Burning Springs Dr Arlington, TX | 3.0 | 2.0 | 1497 | $2,000 | $1.34 | 7d | 1 | 1.27mi |
| 4607 Andalusia Trl Arlington, TX | 3.0 | 2.0 | 1664 | $2,095 | $1.26 | 15d | 1 | 1.27mi |
| 4607 Andalusia Trl Arlington, TX | 3.0 | 2.0 | 1664 | $2,095 | $1.26 | 8d | 1 | 1.27mi |
| 5005 Coronet Ct Arlington, TX | 3.0 | 2.0 | 1500 | $2,199 | $1.47 | 7d | 1 | 1.27mi |
| 5611 Autumn Wheat Trl Arlington, TX | 3.0 | 2.0 | 1691 | $2,350 | $1.39 | 25d | 1 | 1.29mi |
Listing history 2 events
-
2026-06-18remarks 669-char remark
-
2026-06-18$249,500 Active 1 DOM
ⓘ Source: listings_history table (triggers on properties + properties_extension) + one-shot
backfill from property_details.listing_events for pre-trigger history.
Tax reassessment forecast TX · Resets to sale price
- Current annual tax
- $5,216 · $435/mo
- Projected year-2 tax
- $5,216 · $435/mo
- Expected delta
- $0/yr ($0/mo · 0.0%)
ⓘ Screening estimate from a state-policy table — verify with the county assessor before closing.
Climate risk First Street
- Flood 6/10 Major FEMA zone X (unshaded) · 73% chance over 30 yrs
- Wildfire 3/10 Moderate
- Heat 7/10 Severe 7 d/yr ≥109°F today · 24 d/yr by 30 yrs out
- Wind 6/10 Major 27% chance of damaging wind over 30 yrs
- Air quality 3/10 Moderate 2 unhealthy d/yr today · 3 by 30 yrs out
Nearby sold comps map
Loading sold comps map…
Walkable amenities ~0.75 mi
Loading nearby amenities…
Taxation est. · year 1
- Rental income
- $26,515
- − Mortgage interest
- −$13,976
- − Property taxes
- −$5,216
- − Insurance
- −$1,248
- − Repairs & maintenance
- −$2,121
- − Management
- −$2,121
- − Depreciation
- −$7,258
- Taxable loss
- −$5,426
- Est. tax savings @ 24.0%
- +$1,302
- After-tax cash flow
- $84/yr
For passive investors: Depreciation is non-cash, so a rental often shows a tax loss while cash-flowing — sheltering income. Rental losses are passive: they offset passive income freely, and up to $25,000/yr can offset ordinary (W-2) income if you actively participate and your MAGI is under $100k (phasing out to $0 by $150k); unused losses carry forward. On sale, claimed depreciation is recaptured at up to 25%, and gains may owe capital-gains tax (a 1031 exchange can defer both). Figures are a year-1 estimate at your 24.0% rate — not tax advice; consult a CPA.
Schools (NCES district)
- District
- Kennedale ISD
- NCES district ID
- 4825500
- Math proficiency
- 27% ▼ -25.00%
- Reading proficiency
- 37% ▼ -13.00%
- Median HH income
- $70,497
- Composite
- 29.79/100
- National rank
- #6427
- State rank
- #522 of 826 in TX
Livability — Arlington
- Score
- 78/100
- State rank
- #75
- US rank
- #2697
Category grades
Schools grade is shown separately in the Schools card above.
Census & demographics
- Census place
- Arlington, TX
- County
- Tarrant County · 2,033,669 people
- City population
- 366,588
- Metro
- Dallas-Fort Worth-Arlington, TX
- Population (ZIP)
- 38,913
- Household income
- $105,311
- Rent vs Own
- Severe rent burden
- 965.0
Population outlook (Tarrant County) Hauer SSP2
- Today (2025)
- 2,380,417 people
- By 2030
- 2,578,900 · +8.3%
- By 2040
- 2,974,995 · +25.0%
- By 2050
- 3,350,489 · +40.8%
- By 2075
- 4,216,909 · +77.2%
- By 2100
- 4,741,527 · +99.2%
Race, ethnicity, and origin ACS 2023
- Neighborhood character
- Diverse neighborhood (Simpson 0.68)
- Race & ethnicity
- White 48% Black 23% Hispanic / Latino 19% Two or more races 8% Asian 5% Pacific Islander 1%
- Hispanic origin (detail)
- Mexican 15%
- Common ancestry
- Armenian 4% Slovak 2% Italian 2%
- Foreign-born
- 18% · Canada, Vietnam
- Languages at home
- 73% English-only · Spanish 11% Arabic 5% Vietnamese 3%
Political lean MEDSL · Tarrant
- 2024 margin
- Lean R (+5.1) · D 46.7% · R 51.9% · Other 1.4%
- 2008→2024 swing
- +6.6pp toward D · 2008: -11.7pp · 2024: -5.1pp
- All cycles
- 2024: R+5.1 2020: D+0.2 2016: R+8.7 2012: R+15.7 2008: R+11.7
Not yet ingested
- Civics
- —
Market trends
- HPI YoY
- ▼ -24.90%
- Current HPI
- 264.5117
- Rent YoY
- ▼ -0.26%
- Metro
- Dallas-Fort Worth-Arlington, TX
- State GDP YoY
- ▲ 3.95%
- F500 in state
- 110
Industry mix (Fortune 500 HQ in TX)
| Industry | F500 HQs | Revenue |
|---|---|---|
| Energy | 16 | $1,198B |
|
||
| Technology | 5 | $198B |
|
||
| Engineering / Construction | 4 | $72B |
|
||
| Energy Services | 3 | $60B |
|
||
| Utilities | 3 | $41B |
|
||
| Healthcare | 2 | $330B |
|
||
Price history
3 events — show timeline
- 2026-06-18 Listed $249,500 NTREIS
- 2017-12-01 Sold (Public Records) — Public Records
- 1999-05-07 Sold (Public Records) — Public Records
Property tax history
+5.1%/yrLatest (2025): $5,216 · +0.5% YoY. Source: county tax records.
Cash-flow waterfall
monthlySold comps — $/sqft
last 12 mo · ≤1 miLoading sold comps…