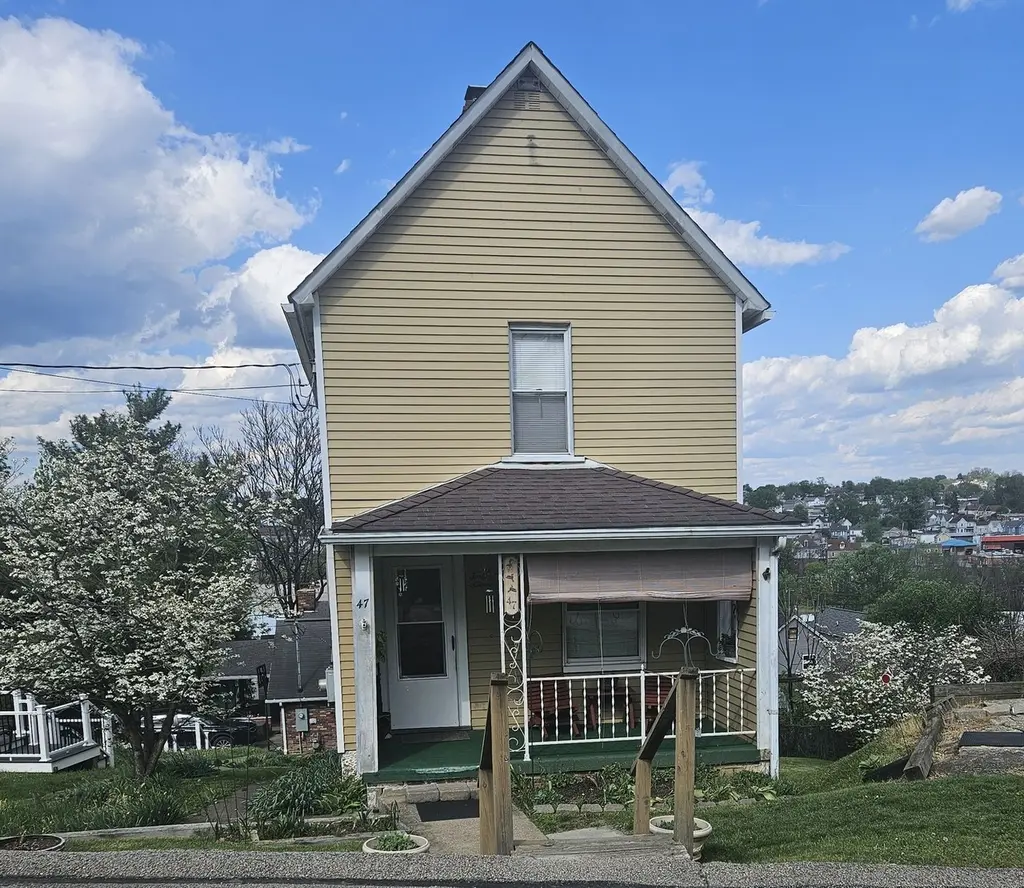
47 Elizabeth St · Canton, PA
Flood risk 1/10 · Minimal
- FEMA flood zone
- X (unshaded)
- Chance of flooding over 30 yrs
- 0.0%
- Est. flood insurance / yr
- $473 – $860
Fire risk 1/10 · Minimal
- Est. fire insurance / yr
- $511 – $949
Heat risk 4/10 · Minor
- Hot days now (above 97°F)
- 7 days/yr
- Hot days in 30 yrs
- 19 days/yr
Wind risk 2/10 · Minimal
- Chance of severe wind over 30 yrs
- —
Air-quality risk 2/10 · Minimal
- Unhealthy air days now
- 1 days/yr
- Unhealthy air days in 30 yrs
- 1 days/yr
Risk factors via First Street. Map © Google.
Why this score? — see what drove the B+ grade
The composite is a weighted blend of 9 inputs, each scored 0–100. Each bar is that input's sub-score; the figure is the points it added to the 100-point composite (weight × sub-score).
- Cash flow +29.2/30.0
- ARV discount +15.0/15.0
- DSCR +10.0/10.0
- 1% rule +7.8/10.0
- Schools +4.3/10.0
- Rent growth +3.3/5.0
- Livability +3.3/5.0
- Condition / age +2.5/5.0
- Appreciation +0.0/10.0
$74,999
🖨 Deal sheet 📄 Offer letter ✓ Due diligence
Listing remarks
Welcome to 47 Elizabeth Ave. This well-maintained home has belonged to one family for 70 years. It features two spacious bedrooms, a large eat-in kitchen, and plenty of storage throughout. The basement offers a game room and a generous laundry area. Enjoy beautiful flower beds in the yard and a lovely view of Washington from the back porch. Electrical updates were completed in 2016. There are also two off-street parking spots. This property is an excellent opportunity for first-time home buyers or investors alike. Info is deemed reliable but not guaranteed buyer is to due their due diligence. HOME IS BEING SOLD AS IS. INSPECTIONS ARE FOR INFORMATIONAL PURPOSES ONLY.
Key facts
- 0.29 acre lot
- Parking
- Built 1900
Property features AI
Exterior
- Parking: Off-street parking (1 space)
- Utilities: Public water; Public sewer
- Home design: 2-story; Resale property
- Construction: Aluminum siding; Vinyl siding
- Exterior features: Lot approximately 90x140; Lot area about 0.289 acres
Interior
- Kitchen: Refrigerator; Stove
- Bedrooms: Bedroom on upper level (11x13); Additional bedroom-sized/bonus spaces: Bonus room in basement (12x7)
- Flooring: Carpet
- Bathrooms: 1 full bathroom
- Heating & cooling: Forced air heating (gas); Central air conditioning
- Interior features: Carpet flooring; Walk-out basement
- Laundry & utility: Washer; Dryer; Laundry room in basement (14x10)
Neighborhood map
What this means for you Summary
Snapshot
- This is a 2-bed/1.0-bath single-family listed at $75k.
Deal economics
- At list price, monthly cash flow is $262 ($3k/yr) — positive.
- The deal already cash-flows at list — no discount required.
- Meets the 1% rule at list price ($957 rent vs $75k).
- Recommended offer: $73k (3.0% below list) — sets the bar for market timing.
- Cap rate 10.5% vs local median 4.9% in Canton — top-decile yield for the area; either an underpriced asset or a hidden risk that comps aren't pricing in. Stress-test before assuming the spread holds.
Location & tenants
- Location reads 66/100 on livability (#1,074 in PA) — a middle-class / working-renter tenant base. Strengths: crime A+, cost of living A+, housing A+; Watch: schools D+, employment D, amenities F.
- Trinity Area SD (suburban): math 39% / reading 61% proficiency, ranked #172 of 539 in PA (top 32%) — acceptable for families but not a draw, mixed tenant base, ~2y average lease.
- Market conditions: Rents rising (+3.4%/yr); 163 active listings in the ZIP; 3 comparable units currently listed for rent nearby; rentals leasing fast (median 11d on market — plan ~1-2 weeks tenant-placement turnaround); 489 units permitted in Washington County in 2024 (30 in 5+ unit buildings).
- This rent is only 16% of the median local income ($70k/yr) — well below the 30% rent-burden line; pricing power to push rent on renewal without tenant pushback.
Forward outlook
- Local home prices are declining (-3.0%/yr); year-one equity from $518 of loan paydown is wiped out by about $2k of value loss. Plan a longer hold.
- Washington County population projected to shrink 6% by 2050 — rents likely to lag national; underwrite the cash flow, not the appreciation.
- At projected returns (-3.0% appreciation + 3.4% rent growth), your $21k cash investment doubles in ~8 years — after that, you're playing with house money.
Negotiation context
- It's been on market 43 days — a 3% lower offer ($73k) is reasonable based on typical stale-listing flexibility.
Risks & watch-outs
- Watch-outs: built in 1900 — expect roof / HVAC / electrical / plumbing capex.
Questions for the listing agent
- It's been on market 43 days. Have you received any prior offers? Is the seller open to a 3% concession, seller financing, or rate buy-down credit?
- Built in 1900 — when were the roof, HVAC, electrical panel, plumbing, and water heater last replaced?
- Is there a deadline driving the sale (1031 exchange, divorce, estate, relocation)? That informs how much negotiation room exists.
- Schools are D-rated, which usually means shorter tenancies and higher turnover. Who's the typical renter profile here, and what's been the actual vacancy rate?
- What's the average days-on-market for RENTAL listings here right now (not sales)? A rising rental-DOM trend means longer vacancies and softer asking-rent achievability than the comps imply.
- What's the recent tenant-quality profile in this submarket — average credit score on applications, eviction rate, late-payment / NSF rate, and stable-employment percentage? A property-management company in the area should have these aggregated.
- How much new for-sale + rental construction is in the pipeline within 1–3 miles? Heavy new supply typically softens prices + rents 12–24 months out; constrained supply supports both.
Investment metrics
- 1% rule
- 1.28% ✓
- Cap rate
- 10.49%
- Cash-on-cash
- 15.00%
- DSCR
- 1.67
- GRM
- 6.5
CMA / ARV
- ARV (median comp)
- $112,946
- List price
- $74,999
- Delta
- -33.60%
- Verdict
- UNDERPRICED
- Comps
- 20 within 1.0 mi
Show comp detail 7 sales within ~0.75 mi
| Address | Dist | Beds/Ba | Sqft | Sold | Price | $/sf | Match |
|---|---|---|---|---|---|---|---|
| 75 Russell St | 0.15mi | 2/1.0 | 934 (+4%) | 9mo | $117,000 | $125 | 78 |
| 5 William St | 0.24mi | 3/1.0 (+1) | 858 (-4%) | 3mo | $25,000 | $29 | 74 |
| 130 Elizabeth St | 0.12mi | 2/1.5 | 848 (-5%) | 13mo | $25,500 | $30 | 73 |
| 131 Elizabeth St | 0.13mi | 2/1.0 | 980 (+9%) | 12mo | $80,245 | $82 | 69 |
| 1 Elizabeth St | 0.06mi | 2/1.0 | 992 (+11%) | 18mo | $112,500 | $113 | 65 |
| 700 Wilmington St | 0.64mi | 2/2.0 | 972 (+8%) | 15mo | $150,000 | $154 | 39 |
| 218 Cortez Dr | 0.75mi | 3/1.0 (+1) | 1,014 (+13%) | 17mo | $135,000 | $133 | 24 |
Match score weights: distance 35% · size 25% · config 20% · recency 20%. Top-matched comps best support the ARV.
Projected returns pro-forma
-3.0% appreciation · 3.38% rent growth · sell at horizon
- IRR
- 6.0%
- Equity multiple
- 1.23×
- Total profit
- $4,929
- Equity at exit
- $11,183
- IRR
- 15.7%
- Equity multiple
- 2.30×
- Total profit
- $27,333
- Equity at exit
- $6,485
Cash invested: $21,000 (down + closing). Projections, not guarantees.
Landlord ↔ Tenant lean methodology
- Overall (STATE)
- 62 Landlord-Friendly
- State Pennsylvania
- 62 Landlord-Friendly · EVEN
- County
- — inherits STATE
- City
- — inherits STATE
ZIP-level market 15301
- Home prices YoY
- -21.9%
- Rents YoY
- 3.4%
- Active inventory
- 163
- Price-to-rent
- 6.5×
Monthly cashflow live
- Estimated rent
- $957 medium interval (Pro) →
- Mortgage (P&I)
- −$393
- Tax from tax record
- −$69 /mo · $833/yr
- Insurance
- −$31
- HOA
- −$0
- Vacancy / Maint / Mgmt
- −$201
- Net cashflow
- $262
Break-even live
UW: 25.0% down · 7.5% · 30yr · 1.5% tax · 5.0% vac · 8.0% maint · 8.0% mgmt
Financing live
Cash to close
- Down payment
- $18,750
- Closing costs
- $2,250
- Reserves months
- —
- Total cash needed
- —
Loan-product check · same deal, 3 products live
Conventional
25% down · 7.5% · 30yr
- Down + closing
- —
- Monthly P&I
- —
- Monthly cashflow
- —
- DSCR
- —
- Eligible?
- —
Personal DTI + credit; lowest rate.
DSCR
20% down · 8.5% · 30yr
- Down + closing
- —
- Monthly P&I
- —
- Monthly cashflow
- —
- DSCR
- —
- Eligible?
- —
No personal income docs; deal must DSCR.
Hard money
10% down · 12.0% · 12mo
- Down + closing
- —
- Monthly P&I
- —
- Monthly cashflow
- —
- DSCR
- —
- Eligible?
- —
Short-term bridge; refi at stabilization.
Rent comps 3 comps
| Address | Beds | Baths | Sqft | Rent | $/sqft | DOM | Units | Dist |
|---|---|---|---|---|---|---|---|---|
| 360 Duncan Ave Washington, PA | 1.0 | 1.0 | 600 | $800 | $1.33 | 10d | 1 | 1.10mi |
| 410 W Hallam Ave Unit 410 Washington, PA | 1.0 | 1.0 | 830 | $850 | $1.02 | 23d | 1 | 1.15mi |
| 235 W Chestnut St Washington, PA | 1.0–3.0 | 1.0 | 975 | $1,110 | $1.14 | 1d | 4 | 1.31mi |
Listing history 15 events
-
2026-06-18days on market $74,999 Active 43 DOM
-
2026-06-17days on market $74,999 Active 42 DOM
-
2026-06-16days on market $74,999 Active 41 DOM
-
2026-06-15days on market $74,999 Active 40 DOM
-
2026-06-13days on market $74,999 Active 38 DOM
-
2026-06-13days on market $74,999 Active 37 DOM
-
2026-06-09days on market $74,999 Active 34 DOM
-
2026-06-08days on market $74,999 Active 33 DOM
-
2026-06-07days on market $74,999 Active 32 DOM
-
2026-06-05days on market $74,999 Active 29 DOM
-
2026-06-03days on market $74,999 Active 28 DOM
-
2026-06-02days on market $74,999 Active 27 DOM
-
2026-06-01days on market $74,999 Active 26 DOM
-
2026-05-31days on market $74,999 Active 25 DOM
-
2026-04-20$79,900 Active 674-char remark
ⓘ Source: listings_history table (triggers on properties + properties_extension) + one-shot
backfill from property_details.listing_events for pre-trigger history.
Tax reassessment forecast PA · Partial reset (capped growth)
- Current annual tax
- $833 · $69/mo
- Projected year-2 tax
- $1,009 · $84/mo
- Expected delta
- +$176/yr (+$15/mo · 21.2%)
ⓘ Screening estimate from a state-policy table — verify with the county assessor before closing.
Climate risk First Street
- Flood 1/10 Low FEMA zone X (unshaded) · 0% chance over 30 yrs
- Wildfire 1/10 Low
- Heat 4/10 Moderate 7 d/yr ≥97°F today · 19 d/yr by 30 yrs out
- Wind 2/10 Low
- Air quality 2/10 Low 1 unhealthy d/yr today · 1 by 30 yrs out
Nearby sold comps map
Loading sold comps map…
Walkable amenities ~0.75 mi
Loading nearby amenities…
Taxation est. · year 1
- Rental income
- $11,489
- − Mortgage interest
- −$4,201
- − Property taxes
- −$833
- − Insurance
- −$375
- − Repairs & maintenance
- −$919
- − Management
- −$919
- − Depreciation
- −$2,182
- Taxable income
- $2,061
- Est. tax owed @ 24.0%
- −$495
- After-tax cash flow
- $2,655/yr
For passive investors: Depreciation is non-cash, so a rental often shows a tax loss while cash-flowing — sheltering income. Rental losses are passive: they offset passive income freely, and up to $25,000/yr can offset ordinary (W-2) income if you actively participate and your MAGI is under $100k (phasing out to $0 by $150k); unused losses carry forward. On sale, claimed depreciation is recaptured at up to 25%, and gains may owe capital-gains tax (a 1031 exchange can defer both). Figures are a year-1 estimate at your 24.0% rate — not tax advice; consult a CPA.
Schools (NCES district)
- District
- Trinity Area SD
- NCES district ID
- 4223760
- Math proficiency
- 39% ▼ -20.00%
- Reading proficiency
- 61% ▼ -12.00%
- Median HH income
- $55,734
- Composite
- 43.24/100
- National rank
- #3056
- State rank
- #172 of 539 in PA
Livability — Canton
- Score
- 66/100
- State rank
- #1074
- US rank
- #12136
Category grades
Schools grade is shown separately in the Schools card above.
Census & demographics
- County
- Washington County · 106,469 people
- City population
- 50,348
- Metro
- Pittsburgh, PA
- Population (ZIP)
- 50,348
- Household income
- $70,473
- Rent vs Own
- Severe rent burden
- 1378.0
Population outlook (Washington County) Hauer SSP2
- Today (2025)
- 208,060 people
- By 2030
- 207,168 · -0.4%
- By 2040
- 202,738 · -2.6%
- By 2050
- 195,269 · -6.1%
- By 2075
- 175,588 · -15.6%
- By 2100
- 145,827 · -29.9%
Race, ethnicity, and origin ACS 2023
- Neighborhood character
- Predominantly White (87%)
- Race & ethnicity
- White 87% Black 5% Two or more races 5% Hispanic / Latino 3% Asian 1%
- Common ancestry
- Romanian 6% Serbian 3% Lithuanian 2%
- Foreign-born
- 3% · Canada, China
- Languages at home
- 96% English-only · Spanish 2% Other Indo-European 1%
Political lean MEDSL · Washington
- 2024 margin
- Strong R (+25.5) · D 36.9% · R 62.4%
- 2008→2024 swing
- -20.8pp toward R · 2008: -4.7pp · 2024: -25.5pp
- All cycles
- 2024: R+25.5 2020: R+22.8 2016: R+25.3 2012: R+13.3 2008: R+4.7
Not yet ingested
- Civics
- —
Market trends
- HPI YoY
- ▼ -66.91%
- Current HPI
- 238.6516
- Rent YoY
- ▲ 3.38%
- Metro
- Pittsburgh, PA
- State GDP YoY
- ▲ 1.68%
- F500 in state
- 34
Industry mix (Fortune 500 HQ in PA)
| Industry | F500 HQs | Revenue |
|---|---|---|
| Healthcare | 2 | $309B |
|
||
| Insurance | 2 | $27B |
|
||
| Telecommunications / Media | 1 | $124B |
|
||
| Industrial Distribution | 1 | $22B |
|
||
| Financial Services | 1 | $20B |
|
||
| Chemicals / Materials | 1 | $18B |
|
||
Price history
-6.1% since first listed2 events — show timeline
- 2026-05-22 Price Changed $74,999 West Penn MLS
- 2026-04-20 Listed $79,900 West Penn MLS
Property tax history
+3.0%/yrLatest (2026): $833 · +2.0% YoY. Source: county tax records.
Cash-flow waterfall
monthlySold comps — $/sqft
last 12 mo · ≤1 miLoading sold comps…