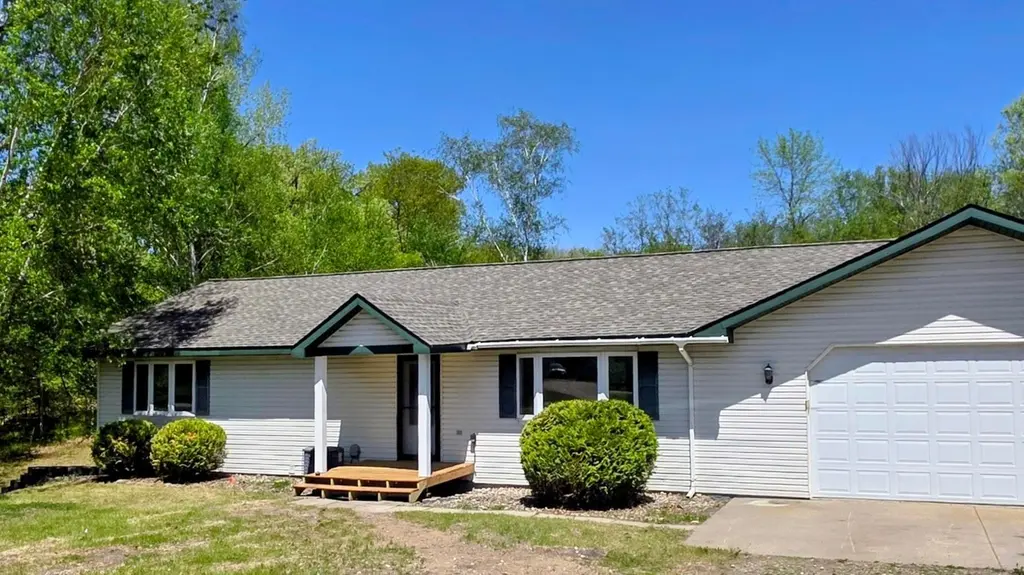
14750 Leisure Dr · Burlington, MN
Flood risk 1/10 · Minimal
- FEMA flood zone
- —
- Chance of flooding over 30 yrs
- 0.0%
- Est. flood insurance / yr
- —
Fire risk 3/10 · Minor
- Est. fire insurance / yr
- $888 – $1,650
Heat risk 1/10 · Minimal
- Hot days now (above 94°F)
- 7 days/yr
- Hot days in 30 yrs
- 12 days/yr
Wind risk 1/10 · Minimal
- Chance of severe wind over 30 yrs
- —
Air-quality risk 2/10 · Minimal
- Unhealthy air days now
- 2 days/yr
- Unhealthy air days in 30 yrs
- 2 days/yr
Risk factors via First Street. Map © Google.
Why this score? — see what drove the C grade
The composite is a weighted blend of 9 inputs, each scored 0–100. Each bar is that input's sub-score; the figure is the points it added to the 100-point composite (weight × sub-score).
- Cash flow +19.8/30.0
- ARV discount +15.0/15.0
- DSCR +6.3/10.0
- 1% rule +4.5/10.0
- Schools +4.0/10.0
- Rent growth +2.5/5.0
- Livability +2.5/5.0
- Condition / age +2.5/5.0
- Appreciation +0.0/10.0
$335,000
🖨 Deal sheet 📄 Offer letter ✓ Due diligence
Listing remarks
Welcome to this beautifully renovated 4-bedroom, 3-bathroom home perfectly situated on a spacious 1-acre lot. Designed with modern living in mind, this home features a bright open-concept layout that seamlessly connects the living, dining, and kitchen areas—ideal for both everyday living and entertaining. Enjoy peace of mind with brand new finishes throughout, offering a fresh, stylish feel in every room. The kitchen and bathrooms have been thoughtfully updated, while the NEW ROOF adds long-term value and durability. With plenty of space inside and out, this property offers the perfect balance of comfort, functionality, and room to grow. Whether you're hosting gatherings or enjoying q
Key facts
- Brand new finishes
- Move-in-ready
- Thoughtfully updated
Tags
Property features AI
Exterior
- Parking: Attached garage with 2 spaces (garage approx. 28 x 24)
- Utilities: Private well water; Private septic system (tank with drainage field; system compliant); Propane fuel; Electric service with circuit breakers and 200+ amp capacity
- Home design: Residential property; Two levels
- Construction: Concrete construction materials; Block foundation; Asphalt roof (over 8 years old); Foundation dimensions approx. 48 x 28
- Exterior features: Front porch; Vinyl exterior; Storage shed on property; Lot approximately 1 acre with irregular dimensions
Interior
- Kitchen: Kitchen on main level
- Bedrooms: 4 bedrooms (primary on main level; additional bedrooms on main and lower levels)
- Bathrooms: 3 full bathrooms (including main-floor full bath and an ensuite)
- Heating & cooling: Forced air heating; Central air conditioning
- Interior features: Finished basement; Main floor primary bedroom; Primary bedroom with ensuite; Main floor laundry
- Laundry & utility: Main-level laundry; Additional laundry area on lower level; Utility/utility room in lower level
Neighborhood map
What this means for you Summary
Snapshot
- This is a 4-bed/3.0-bath single-family listed at $335k.
Deal economics
- At list price, monthly cash flow is $400 ($5k/yr) — positive.
- The deal already cash-flows at list — no discount required.
- To meet the 1% rule (rent ≥ 1% of price), the offer needs to be $319k (4.8% below list).
- Recommended offer: $319k (4.8% below list) — sets the bar for 1% rule.
Location & tenants
- Location reads: area grade C — affects rentability + tenant quality, not the cash-flow math above.
- Detroit Lakes Public School District (town): math 44% / reading 50% proficiency, ranked #155 of 301 in MN (top 52%) — families likely to look elsewhere, expect single-tenant / working-renter base with shorter leases.
- Market conditions: 301 active listings in the ZIP; 156 units permitted in Becker County in 2024 (0 in 5+ unit buildings).
Forward outlook
- Local home prices are declining (-3.0%/yr); year-one equity from $2k of loan paydown is wiped out by about $10k of value loss. Plan a longer hold.
- Becker County population projected at +4% by 2050 — modest demand growth; plan on rents tracking national, not racing it.
Negotiation context
- It's been on market 21 days — a 2% lower offer ($330k) is reasonable based on typical stale-listing flexibility.
- 2 sale attempts with the ask held roughly flat each time — persistent listings suggest the price (not the market) is what's stuck; bring a comps-based counter.
- Current owner paid $120k; list at $335k implies a 179% gain — meaningful room to come down on a strong offer.
Questions for the listing agent
- Is there a deadline driving the sale (1031 exchange, divorce, estate, relocation)? That informs how much negotiation room exists.
- What's the average days-on-market for RENTAL listings here right now (not sales)? A rising rental-DOM trend means longer vacancies and softer asking-rent achievability than the comps imply.
- What's the recent tenant-quality profile in this submarket — average credit score on applications, eviction rate, late-payment / NSF rate, and stable-employment percentage? A property-management company in the area should have these aggregated.
- How much new for-sale + rental construction is in the pipeline within 1–3 miles? Heavy new supply typically softens prices + rents 12–24 months out; constrained supply supports both.
Investment metrics
- 1% rule
- 0.95% ✗
- Cap rate
- 7.73%
- Cash-on-cash
- 5.12%
- DSCR
- 1.23
- GRM
- 8.7
CMA / ARV
- ARV (on-the-fly)
- $549,360
- Comps found
- 1
Show comp detail 1 sale within ~0.75 mi
| Address | Dist | Beds/Ba | Sqft | Sold | Price | $/sf | Match |
|---|---|---|---|---|---|---|---|
| 16051 Leisure Dr | 0.64mi | 4/3.0 | 2,832 (+8%) | 0mo | $594,900 | $210 | 56 |
Match score weights: distance 35% · size 25% · config 20% · recency 20%. Top-matched comps best support the ARV.
Projected returns pro-forma
-3.0% appreciation · 3.0% rent growth · sell at horizon
- IRR
- -8.4%
- Equity multiple
- 0.69×
- Total profit
- $-28,863
- Equity at exit
- $49,950
- IRR
- 1.1%
- Equity multiple
- 1.08×
- Total profit
- $7,403
- Equity at exit
- $28,965
Cash invested: $93,800 (down + closing). Projections, not guarantees.
Landlord ↔ Tenant lean methodology
- Overall (STATE)
- 46 Balanced
- State Minnesota
- 46 Balanced · D+2
- County
- — inherits STATE
- City
- — inherits STATE
ZIP-level market 56501
- Active inventory
- 301
- Price-to-rent
- 8.7×
Monthly cashflow live
- Estimated rent
- $3,191 medium interval (Pro) →
- Mortgage (P&I)
- −$1,757
- Tax from tax record
- −$224 /mo · $2,688/yr
- Insurance
- −$140
- HOA
- −$0
- Vacancy / Maint / Mgmt
- −$670
- Net cashflow
- $400
Break-even live
UW: 25.0% down · 7.5% · 30yr · 1.5% tax · 5.0% vac · 8.0% maint · 8.0% mgmt
Financing live
Cash to close
- Down payment
- $83,750
- Closing costs
- $10,050
- Reserves months
- —
- Total cash needed
- —
Loan-product check · same deal, 3 products live
Conventional
25% down · 7.5% · 30yr
- Down + closing
- —
- Monthly P&I
- —
- Monthly cashflow
- —
- DSCR
- —
- Eligible?
- —
Personal DTI + credit; lowest rate.
DSCR
20% down · 8.5% · 30yr
- Down + closing
- —
- Monthly P&I
- —
- Monthly cashflow
- —
- DSCR
- —
- Eligible?
- —
No personal income docs; deal must DSCR.
Hard money
10% down · 12.0% · 12mo
- Down + closing
- —
- Monthly P&I
- —
- Monthly cashflow
- —
- DSCR
- —
- Eligible?
- —
Short-term bridge; refi at stabilization.
Listing history 19 events
-
2026-06-18days on market $335,000 Active 21 DOM
-
2026-06-17days on market $335,000 Active 20 DOM
-
2026-06-17price $335,000 Active 19 DOM
-
2026-06-16days on market $342,000 Active 19 DOM
-
2026-06-15days on market $342,000 Active 18 DOM
-
2026-06-13days on market $342,000 Active 16 DOM
-
2026-06-12days on market $342,000 Active 15 DOM
-
2026-06-09days on market $342,000 Active 12 DOM
-
2026-06-08days on market $342,000 Active 11 DOM
-
2026-06-07days on market $342,000 Active 10 DOM
-
2026-06-07pricedays on market $342,000 Active 9 DOM
-
2026-06-04days on market $349,000 Active 6 DOM
-
2026-06-02days on market $349,000 Active 5 DOM
-
2026-06-01days on market $349,000 Active 4 DOM
-
2026-05-31days on market $349,000 Active 3 DOM
-
2026-05-31days on market $349,000 Active 2 DOM
-
2026-05-04historical
-
2026-03-25$369,000 Active
-
2001-01-19soldstatus $120,000
ⓘ Source: listings_history table (triggers on properties + properties_extension) + one-shot
backfill from property_details.listing_events for pre-trigger history.
Tax reassessment forecast MN · Partial reset (capped growth)
- Current annual tax
- $2,688 · $224/mo
- Projected year-2 tax
- $3,220 · $268/mo
- Expected delta
- +$532/yr (+$44/mo · 19.8%)
ⓘ Screening estimate from a state-policy table — verify with the county assessor before closing.
Climate risk First Street
- Flood 1/10 Low 0% chance over 30 yrs
- Wildfire 3/10 Moderate
- Heat 1/10 Low 7 d/yr ≥94°F today · 12 d/yr by 30 yrs out
- Wind 1/10 Low
- Air quality 2/10 Low 2 unhealthy d/yr today · 2 by 30 yrs out
Nearby sold comps map
Loading sold comps map…
Walkable amenities ~0.75 mi
Loading nearby amenities…
Taxation est. · year 1
- Rental income
- $38,288
- − Mortgage interest
- −$18,765
- − Property taxes
- −$2,688
- − Insurance
- −$1,675
- − Repairs & maintenance
- −$3,063
- − Management
- −$3,063
- − Depreciation
- −$9,745
- Taxable loss
- −$712
- Est. tax savings @ 24.0%
- +$171
- After-tax cash flow
- $4,974/yr
For passive investors: Depreciation is non-cash, so a rental often shows a tax loss while cash-flowing — sheltering income. Rental losses are passive: they offset passive income freely, and up to $25,000/yr can offset ordinary (W-2) income if you actively participate and your MAGI is under $100k (phasing out to $0 by $150k); unused losses carry forward. On sale, claimed depreciation is recaptured at up to 25%, and gains may owe capital-gains tax (a 1031 exchange can defer both). Figures are a year-1 estimate at your 24.0% rate — not tax advice; consult a CPA.
Schools (NCES district)
- District
- Detroit Lakes Public School District
- NCES district ID
- 2710230
- Math proficiency
- 44% ▼ -11.00%
- Reading proficiency
- 50% ▼ -11.00%
- Median HH income
- $50,571
- Composite
- 40.33/100
- National rank
- #3746
- State rank
- #155 of 301 in MN
Livability — Burlington
No livability data for this city. (Only ~50 U.S. cities are tracked.)
Census & demographics
- City population
- 18,239
- Population (ZIP)
- 18,239
Population outlook (Becker County) Hauer SSP2
- Today (2025)
- 34,604 people
- By 2030
- 35,095 · +1.4%
- By 2040
- 35,691 · +3.1%
- By 2050
- 35,869 · +3.7%
- By 2075
- 36,103 · +4.3%
- By 2100
- 32,798 · -5.2%
Race, ethnicity, and origin ACS 2023
- Neighborhood character
- Predominantly White (91%)
- Race & ethnicity
- White 91% Two or more races 5% Native American 2%
- Common ancestry
- Portuguese 25% Scottish 4% Lithuanian 3%
- Foreign-born
- 1% · Canada
- Languages at home
- 98% English-only · Spanish 1%
Political lean MEDSL · Becker
- 2024 margin
- Solid R (+33.1) · D 32.7% · R 65.8% · Other 1.5%
- 2008→2024 swing
- -26.3pp toward R · 2008: -6.9pp · 2024: -33.1pp
- All cycles
- 2024: R+33.1 2020: R+30.1 2016: R+33.2 2012: R+14.6 2008: R+6.9
Not yet ingested
- Civics
- —
Market trends
- HPI YoY
- ▼ -222.40%
- Current HPI
- 217.4973
- Rent YoY
- —
- Metro
- —
- State GDP YoY
- ▲ 2.41%
- F500 in state
- 34
Industry mix (Fortune 500 HQ in MN)
| Industry | F500 HQs | Revenue |
|---|---|---|
| Healthcare | 2 | $407B |
|
||
| Retail | 2 | $150B |
|
||
| Consumer Goods | 2 | $32B |
|
||
| Industrial Machinery | 2 | $6B |
|
||
| Agriculture | 1 | $40B |
|
||
| Healthcare / Medical Devices | 1 | $32B |
|
||
Price history
+179.2% since first listed6 events — show timeline
- 2026-06-16 Price Changed $335,000 NORTHSTARMLS as Distributed by MLS Grid
- 2026-06-05 Price Changed $342,000 NORTHSTARMLS as Distributed by MLS Grid
- 2026-05-28 Listed $349,000 NORTHSTARMLS as Distributed by MLS Grid
- 2026-05-04 Listing Removed — NORTHSTARMLS as Distributed by MLS Grid
- 2026-03-25 Listed $369,000 NORTHSTARMLS as Distributed by MLS Grid
- 2001-01-19 Sold (Public Records) $120,000 Public Records
Property tax history
+6.9%/yrLatest (2025): $2,688 · -3.0% YoY. Source: county tax records.
Cash-flow waterfall
monthlySold comps — $/sqft
last 12 mo · ≤1 miLoading sold comps…