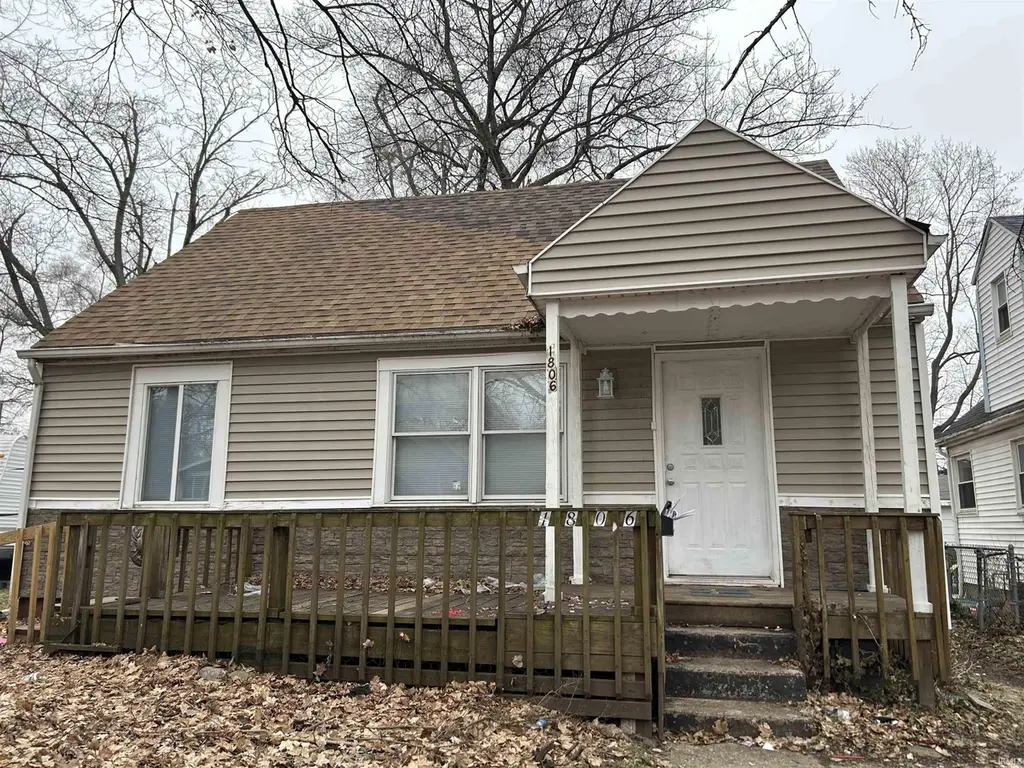
1806 Obrien St · South Bend, IN
Flood risk 1/10 · Minimal
- FEMA flood zone
- X (unshaded)
- Chance of flooding over 30 yrs
- 0.0%
- Est. flood insurance / yr
- $473 – $860
Fire risk 1/10 · Minimal
- Est. fire insurance / yr
- $717 – $1,331
Heat risk 2/10 · Minimal
- Hot days now (above 99°F)
- 7 days/yr
- Hot days in 30 yrs
- 16 days/yr
Wind risk 2/10 · Minimal
- Chance of severe wind over 30 yrs
- —
Air-quality risk 3/10 · Minor
- Unhealthy air days now
- 3 days/yr
- Unhealthy air days in 30 yrs
- 3 days/yr
Risk factors via First Street. Map © Google.
Why this score? — see what drove the C- grade
The composite is a weighted blend of 9 inputs, each scored 0–100. Each bar is that input's sub-score; the figure is the points it added to the 100-point composite (weight × sub-score).
- Cash flow +26.7/30.0
- DSCR +9.2/10.0
- 1% rule +6.7/10.0
- Rent growth +4.2/5.0
- Livability +3.2/5.0
- Condition / age +2.5/5.0
- Schools +1.4/10.0
- ARV discount +0.0/15.0
- Appreciation +0.0/10.0
$119,900
🖨 Deal sheet 📄 Offer letter ✓ Due diligence
Listing remarks MLS
Short sale, subject to servicers approval. Fire Damaged, Priced to sell. Interior access is not available. No interior picture per the seller.
Key facts
- 5,227 sq ft lot
- 2 garage spots
- Built 1947
Property features AI
Finance
- Other: Lot dimensions approximately 40 x 125 (0.12 acre)
- Financial info: Financial details not specified
- HOA & community: No HOA information specified
Exterior
- Parking: Detached 2-car garage
- Security: No security features specified
- Utilities: Public water; Public sewer
- Home design: Single-family site-built home; One story
- Construction: Vinyl siding; Concrete perimeter foundation; Built year not specified
- Exterior features: Level lot
Interior
- Kitchen: Appliances not specified
- Bedrooms: Bedrooms not specified
- Flooring: Flooring details not specified
- Bathrooms: 1 full bathroom (main level)
- Heating & cooling: Natural gas heat; No cooling
- Interior features: Full unfinished basement; 7 total rooms
- Laundry & utility: Laundry located in the basement; Natural gas heating
Neighborhood map
What this means for you Summary
Snapshot
- This is a 3-bed/1.0-bath single-family listed at $120k.
Deal economics
- At list price, monthly cash flow is $326 ($4k/yr) — positive.
- The deal already cash-flows at list — no discount required.
- Meets the 1% rule at list price ($1k rent vs $120k).
- Recommended offer: $118k (1.5% below list) — sets the bar for market timing.
- Cap rate 9.6% vs local median 4.4% in South Bend — top-decile yield for the area; either an underpriced asset or a hidden risk that comps aren't pricing in. Stress-test before assuming the spread holds.
Location & tenants
- Location reads 64/100 on livability (#365 in IN) — a middle-class / working-renter tenant base. Strengths: cost of living A+, housing A+, health & safety A+; Watch: amenities D, employment D, schools F.
- South Bend Community School Corporation (urban): math 12% / reading 21% proficiency, ranked #284 of 301 in IN (top 94%) — low school quality limits family demand, transient renter base, plan for 1-2y turnover; 66% free/reduced lunch — lower-income household profile, screen leases tightly.
- Market conditions: Rents rising fast (+6.8%/yr); 424 active listings in the ZIP; 28 comparable units currently listed for rent nearby; rentals at typical pace (median 21d on market — plan ~3-4 weeks tenant-placement turnaround); 754 units permitted in St. Joseph County in 2024 (460 in 5+ unit buildings).
Forward outlook
- Local home prices are declining (-3.0%/yr); year-one equity from $829 of loan paydown is wiped out by about $4k of value loss. Plan a longer hold.
- At projected returns (-3.0% appreciation + 6.8% rent growth), your $34k cash investment doubles in ~8 years — after that, you're playing with house money.
Negotiation context
- It's been on market 19 days — a 2% lower offer ($118k) is reasonable based on typical stale-listing flexibility.
- 3 sale attempts since 5y ago; this cycle's ask is 20% above the opening price — seller raised mid-cycle; expect resistance to lowballs.
- Current owner paid $9k; list at $120k implies a 1262% gain — meaningful room to come down on a strong offer.
Risks & watch-outs
- Watch-outs: built in 1947 — expect roof / HVAC / electrical / plumbing capex.
Questions for the listing agent
- Built in 1947 — when were the roof, HVAC, electrical panel, plumbing, and water heater last replaced?
- Is there a deadline driving the sale (1031 exchange, divorce, estate, relocation)? That informs how much negotiation room exists.
- Schools are F-rated, which usually means shorter tenancies and higher turnover. Who's the typical renter profile here, and what's been the actual vacancy rate?
- Crime grade is F in this area — have there been break-ins, vandalism, or insurance claims at this property in the last 3 years? What carrier currently insures it and at what premium?
- What's the average days-on-market for RENTAL listings here right now (not sales)? A rising rental-DOM trend means longer vacancies and softer asking-rent achievability than the comps imply.
- What's the recent tenant-quality profile in this submarket — average credit score on applications, eviction rate, late-payment / NSF rate, and stable-employment percentage? A property-management company in the area should have these aggregated.
- How much new for-sale + rental construction is in the pipeline within 1–3 miles? Heavy new supply typically softens prices + rents 12–24 months out; constrained supply supports both.
Investment metrics
- 1% rule
- 1.17% ✓
- Cap rate
- 9.56%
- Cash-on-cash
- 11.66%
- DSCR
- 1.52
- GRM
- 7.1
CMA / ARV
- ARV (median comp)
- $87,537
- List price
- $119,900
- Delta
- 36.97%
- Verdict
- OVERPRICED
- Comps
- 20 within 1.0 mi
Show comp detail 12 sales within ~0.75 mi
| Address | Dist | Beds/Ba | Sqft | Sold | Price | $/sf | Match |
|---|---|---|---|---|---|---|---|
| 1614 O'brien St | 0.24mi | 4/1.0 (+1) | 1,440 (0%) | 5mo | $170,000 | $118 | 80 |
| 1421 N Brookfield St | 0.36mi | 4/1.0 (+1) | 1,440 (0%) | 5mo | $107,500 | $75 | 74 |
| 1821 Marquette Blvd | 0.12mi | 3/1.5 | 1,584 (+10%) | 6mo | $135,000 | $85 | 71 |
| 1337 N Adams St | 0.50mi | 3/1.0 | 1,366 (-5%) | 2mo | $95,000 | $70 | 66 |
| 2221 Portage Ave | 0.55mi | 2/1.5 (-1) | 1,414 (-2%) | 1mo | $215,000 | $152 | 63 |
| 1521 Huey St | 0.30mi | 2/1.0 (-1) | 1,280 (-11%) | 2mo | $105,900 | $83 | 61 |
| 1501 N Huey St | 0.33mi | 3/1.0 | 1,270 (-12%) | 5mo | $95,000 | $75 | 61 |
| 2111 Inglewood Pl | 0.56mi | 3/1.5 | 1,524 (+6%) | 2mo | $170,500 | $112 | 60 |
| 1207 N Olive St | 0.63mi | 4/1.5 (+1) | 1,386 (-4%) | 5mo | $149,000 | $108 | 53 |
| 1210 Johnson St | 0.58mi | 3/2.0 | 1,568 (+9%) | 4mo | $98,000 | $63 | 51 |
| 1115 Johnson St | 0.67mi | 3/1.0 | 1,300 (-10%) | 4mo | $88,000 | $68 | 49 |
| 1054 Huey St | 0.72mi | 4/1.5 (+1) | 1,288 (-11%) | 2mo | $85,251 | $66 | 40 |
Match score weights: distance 35% · size 25% · config 20% · recency 20%. Top-matched comps best support the ARV.
Projected returns pro-forma
-3.0% appreciation · 6.78% rent growth · sell at horizon
- IRR
- 5.1%
- Equity multiple
- 1.21×
- Total profit
- $6,903
- Equity at exit
- $17,877
- IRR
- 17.6%
- Equity multiple
- 2.71×
- Total profit
- $57,407
- Equity at exit
- $10,367
Cash invested: $33,572 (down + closing). Projections, not guarantees.
Landlord ↔ Tenant lean methodology
- Overall (STATE)
- 90 Strongly Landlord-Friendly
- State Indiana
- 90 Strongly Landlord-Friendly · R+11
- County
- — inherits STATE
- City
- — inherits STATE
ZIP-level market 46628
- Rents YoY
- 6.8%
- Active inventory
- 424
- Price-to-rent
- 7.1×
Monthly cashflow live
- Estimated rent
- $1,408 high interval (Pro) →
- Mortgage (P&I)
- −$629
- Tax from tax record
- −$108 /mo · $1,292/yr
- Insurance
- −$50
- HOA
- −$0
- Vacancy / Maint / Mgmt
- −$296
- Net cashflow
- $326
Break-even live
UW: 25.0% down · 7.5% · 30yr · 1.5% tax · 5.0% vac · 8.0% maint · 8.0% mgmt
Financing live
Cash to close
- Down payment
- $29,975
- Closing costs
- $3,597
- Reserves months
- —
- Total cash needed
- —
Loan-product check · same deal, 3 products live
Conventional
25% down · 7.5% · 30yr
- Down + closing
- —
- Monthly P&I
- —
- Monthly cashflow
- —
- DSCR
- —
- Eligible?
- —
Personal DTI + credit; lowest rate.
DSCR
20% down · 8.5% · 30yr
- Down + closing
- —
- Monthly P&I
- —
- Monthly cashflow
- —
- DSCR
- —
- Eligible?
- —
No personal income docs; deal must DSCR.
Hard money
10% down · 12.0% · 12mo
- Down + closing
- —
- Monthly P&I
- —
- Monthly cashflow
- —
- DSCR
- —
- Eligible?
- —
Short-term bridge; refi at stabilization.
Rent comps 28 comps
| Address | Beds | Baths | Sqft | Rent | $/sqft | DOM | Units | Dist |
|---|---|---|---|---|---|---|---|---|
| 1918 Johnson St South Bend, IN | 3.0 | 1.0 | 1200 | $1,200 | $1.00 | 13d | 1 | 0.16mi |
| 1710 Johnson St South Bend, IN | 3.0 | 1.0 | 1000 | $1,350 | $1.35 | 43d | 1 | 0.16mi |
| 1642 Johnson St South Bend, IN | 3.0 | 1.0 | 1375 | $1,400 | $1.02 | 13d | 1 | 0.22mi |
| 1630 Obrien St South Bend, IN | 3.0 | 1.0 | 1120 | $1,400 | $1.25 | 13d | 1 | 0.24mi |
| 1505 N Adams St South Bend, IN | 3.0 | 1.0 | 1200 | $1,350 | $1.12 | 13d | 1 | 0.42mi |
| 1314 Johnson St South Bend, IN | 2.0 | 1.0 | 902 | $1,150 | $1.27 | 13d | 1 | 0.53mi |
| 2217 Inglewood Pl South Bend, IN | 3.0 | 1.0 | 1800 | $2,200 | $1.22 | 43d | 1 | 0.61mi |
| 1210 Johnson St South Bend, IN | 3.0 | 2.0 | 1568 | $1,250 | $0.80 | 20d | 1 | 0.61mi |
| 1206 Johnson St South Bend, IN | 3.0 | 1.5 | 1320 | $1,400 | $1.06 | 43d | 1 | 0.62mi |
| 1237 Wilber St South Bend, IN | 2.0 | 1.0 | 880 | $1,200 | $1.36 | 43d | 1 | 0.63mi |
| 1214 Queen St South Bend, IN | 3.0 | 1.0 | 1056 | $1,300 | $1.23 | 13d | 1 | 0.67mi |
| 1428 Kessler Blvd South Bend, IN | 3.0 | 1.0 | 936 | $1,000 | $1.07 | 43d | 1 | 0.74mi |
| 1054 Huey St South Bend, IN | 4.0 | 2.0 | 1288 | $1,550 | $1.20 | 13d | 1 | 0.75mi |
| 1046 N Elmer St South Bend, IN | 2.0 | 1.0 | 1050 | $1,025 | $0.98 | 20d | 1 | 0.77mi |
| 2205 Lincoln Way W South Bend, IN | 4.0 | 2.0 | 1440 | $1,565 | $1.09 | 13d | 1 | 0.84mi |
| 1008 O Brien St Unit O South Bend, IN | 3.0 | 1.0 | 1634 | $800 | $0.49 | 20d | 1 | 0.85mi |
| 1243 Portage Ave South Bend, IN | 3.0 | 1.0 | 1570 | $1,500 | $0.96 | 43d | 1 | 0.88mi |
| 2010 Lincoln Way W Unit 2 South Bend, IN | 3.0 | 1.0 | 1150 | $1,325 | $1.15 | 20d | 1 | 0.92mi |
| 2527 Riverside Dr South Bend, IN | 3.0 | 1.5 | 1048 | $1,595 | $1.52 | 20d | 1 | 0.92mi |
| 1201 Woodward Ave South Bend, IN | 2.0 | 1.0 | 960 | $1,675 | $1.74 | 43d | 1 | 1.01mi |
| 1032 Allen St South Bend, IN | 3.0 | 2.0 | 1580 | $1,200 | $0.76 | 43d | 1 | 1.05mi |
| 752 Diamond Ave South Bend, IN | 3.0 | 1.5 | 1248 | $1,400 | $1.12 | 43d | 1 | 1.12mi |
| 736 Lawndale Ave Unit 1 South Bend, IN | 3.0 | 1.0 | 1072 | $1,200 | $1.12 | 13d | 1 | 1.13mi |
| 910 Allen St South Bend, IN | 3.0 | 1.0 | 1100 | $1,350 | $1.23 | 20d | 1 | 1.14mi |
| 1118 Van Buren St South Bend, IN | 3.0 | 1.0 | 1394 | $1,375 | $0.99 | 20d | 1 | 1.19mi |
| 2203 Smith St South Bend, IN | 3.0 | 1.0 | 1248 | $1,215 | $0.97 | 13d | 1 | 1.38mi |
| 344 Parkovash Ave South Bend, IN | 3.0 | 1.0 | 950 | $1,900 | $2.00 | 13d | 1 | 1.38mi |
| 2417 Linden Ave South Bend, IN | 2.0 | 1.0 | 1000 | $1,200 | $1.20 | 43d | 1 | 1.40mi |
Listing history 12 events
-
2026-06-03days on market $119,900 Active 19 DOM
-
2026-06-02days on market $119,900 Active 18 DOM
-
2026-06-01days on market $119,900 Active 17 DOM
-
2026-05-31days on market $119,900 Active 16 DOM
-
2026-05-30days on market $119,900 Active 15 DOM
-
2026-05-19price $119,900 631-char remark
-
2026-05-18status Active 631-char remark
-
2026-05-08status Pending 631-char remark
-
2026-05-05price $114,900 631-char remark
-
2026-05-05$100,000 Active 631-char remark
-
2021-07-30soldstatus $8,800 142-char remark
Show marketing remark (142 chars)
Short sale, subject to servicers approval. Fire Damaged, Priced to sell. Interior access is not available. No interior picture per the seller.
-
2021-05-08$9,000 142-char remark
Show marketing remark (142 chars)
Short sale, subject to servicers approval. Fire Damaged, Priced to sell. Interior access is not available. No interior picture per the seller.
ⓘ Source: listings_history table (triggers on properties + properties_extension) + one-shot
backfill from property_details.listing_events for pre-trigger history.
Tax reassessment forecast IN · Partial reset (capped growth)
- Current annual tax
- $1,292 · $108/mo
- Projected year-2 tax
- $1,292 · $108/mo
- Expected delta
- $0/yr ($0/mo · 0.0%)
ⓘ Screening estimate from a state-policy table — verify with the county assessor before closing.
Climate risk First Street
- Flood 1/10 Low FEMA zone X (unshaded) · 0% chance over 30 yrs
- Wildfire 1/10 Low
- Heat 2/10 Low 7 d/yr ≥99°F today · 16 d/yr by 30 yrs out
- Wind 2/10 Low
- Air quality 3/10 Moderate 3 unhealthy d/yr today · 3 by 30 yrs out
Nearby sold comps map
Loading sold comps map…
Walkable amenities ~0.75 mi
Loading nearby amenities…
Taxation est. · year 1
- Rental income
- $16,900
- − Mortgage interest
- −$6,716
- − Property taxes
- −$1,292
- − Insurance
- −$600
- − Repairs & maintenance
- −$1,352
- − Management
- −$1,352
- − Depreciation
- −$3,488
- Taxable income
- $2,101
- Est. tax owed @ 24.0%
- −$504
- After-tax cash flow
- $3,410/yr
For passive investors: Depreciation is non-cash, so a rental often shows a tax loss while cash-flowing — sheltering income. Rental losses are passive: they offset passive income freely, and up to $25,000/yr can offset ordinary (W-2) income if you actively participate and your MAGI is under $100k (phasing out to $0 by $150k); unused losses carry forward. On sale, claimed depreciation is recaptured at up to 25%, and gains may owe capital-gains tax (a 1031 exchange can defer both). Figures are a year-1 estimate at your 24.0% rate — not tax advice; consult a CPA.
Schools (NCES district)
- District
- South Bend Community School Corporation
- NCES district ID
- 1810290
- Math proficiency
- 12% ▼ -10.00%
- Reading proficiency
- 21% ▼ -6.00%
- Median HH income
- $41,935
- Composite
- 14.21/100
- National rank
- #9452
- State rank
- #284 of 301 in IN
Livability — South Bend
- Score
- 64/100
- State rank
- #365
- US rank
- #13730
Category grades
Schools grade is shown separately in the Schools card above.
Census & demographics
- Census place
- South Bend, IN
- County
- Saint Joseph County · 189,048 people
- City population
- 99,767
- Metro
- South Bend-Mishawaka, IN-MI
- Population (ZIP)
- 27,685
- Household income
- $61,759
- Rent vs Own
- Severe rent burden
- 1024.0
Population outlook (St. Joseph County) Hauer SSP2
- Today (2025)
- 273,186 people
- By 2030
- 273,594 · +0.1%
- By 2040
- 271,641 · -0.6%
- By 2050
- 269,187 · -1.5%
- By 2075
- 263,136 · -3.7%
- By 2100
- 245,659 · -10.1%
Race, ethnicity, and origin ACS 2023
- Neighborhood character
- Diverse neighborhood (Simpson 0.60)
- Race & ethnicity
- White 55% Black 30% Hispanic / Latino 10% Two or more races 8%
- Hispanic origin (detail)
- Mexican 8%
- Common ancestry
- Romanian 12% Lithuanian 1% Slovak 1%
- Foreign-born
- 7% · Canada, China
- Languages at home
- 89% English-only · Spanish 7% Russian/Polish/Slavic 1%
Political lean MEDSL · St. Joseph
- 2024 margin
- Toss-up / Even · D 50.0% · R 48.5% · Other 1.5%
- 2008→2024 swing
- -15.6pp toward R · 2008: 17.1pp · 2024: 1.5pp
- All cycles
- 2024: D+1.5 2020: D+5.8 2016: D+0.2 2012: D+3.5 2008: D+17.1
Not yet ingested
- Civics
- —
Market trends
- HPI YoY
- ▼ -130.47%
- Current HPI
- 202.112
- Rent YoY
- ▲ 6.78%
- Metro
- South Bend-Mishawaka, IN-MI
- State GDP YoY
- ▲ 2.90%
- F500 in state
- 18
Industry mix (Fortune 500 HQ in IN)
| Industry | F500 HQs | Revenue |
|---|---|---|
| Industrial Machinery | 2 | $37B |
|
||
| Healthcare | 1 | $177B |
|
||
| Pharmaceuticals | 1 | $45B |
|
||
| Metals / Steel | 1 | $18B |
|
||
| Agriculture | 1 | $17B |
|
||
| Packaging | 1 | $12B |
|
||
Price history
+1232.2% since first listed7 events — show timeline
- 2026-05-19 Price Changed $119,900 IRMLS
- 2026-05-18 Relisted — IRMLS
- 2026-05-08 Pending — IRMLS
- 2026-05-05 Price Changed $114,900 IRMLS
- 2026-05-05 Listed $100,000 IRMLS
- 2021-07-30 Sold (MLS) $8,800 IRMLS
- 2021-05-08 Listed $9,000 IRMLS
Property tax history
+47.1%/yrLatest (2025): $1,292 · -1.2% YoY. Source: county tax records.
Cash-flow waterfall
monthlySold comps — $/sqft
last 12 mo · ≤1 miLoading sold comps…