1535 Trafalgar Ln · Golden Gate, FL
Flood risk 4/10 · Minor
- FEMA flood zone
- AH
- Chance of flooding over 30 yrs
- 0.22%
- Est. flood insurance / yr
- $1,142 – $2,507
Fire risk 2/10 · Minimal
- Est. fire insurance / yr
- $947 – $1,759
Heat risk 10/10 · Severe
- Hot days now (above 107°F)
- 7 days/yr
- Hot days in 30 yrs
- 30 days/yr
Wind risk 10/10 · Severe
- Chance of severe wind over 30 yrs
- 99.0%
Air-quality risk 2/10 · Minimal
- Unhealthy air days now
- 2 days/yr
- Unhealthy air days in 30 yrs
- 2 days/yr
Risk factors via First Street. Map © Google.
Why this score? — see what drove the D+ grade
The composite is a weighted blend of 9 inputs, each scored 0–100. Each bar is that input's sub-score; the figure is the points it added to the 100-point composite (weight × sub-score).
- Cash flow +15.2/30.0
- ARV discount +7.5/15.0
- Schools +5.0/10.0
- DSCR +4.7/10.0
- 1% rule +4.2/10.0
- Condition / age +3.8/5.0
- Livability +3.5/5.0
- Rent growth +2.0/5.0
- Appreciation +0.0/10.0
$275,000
🖨 Deal sheet 📄 Offer letter ✓ Due diligence
Listing remarks
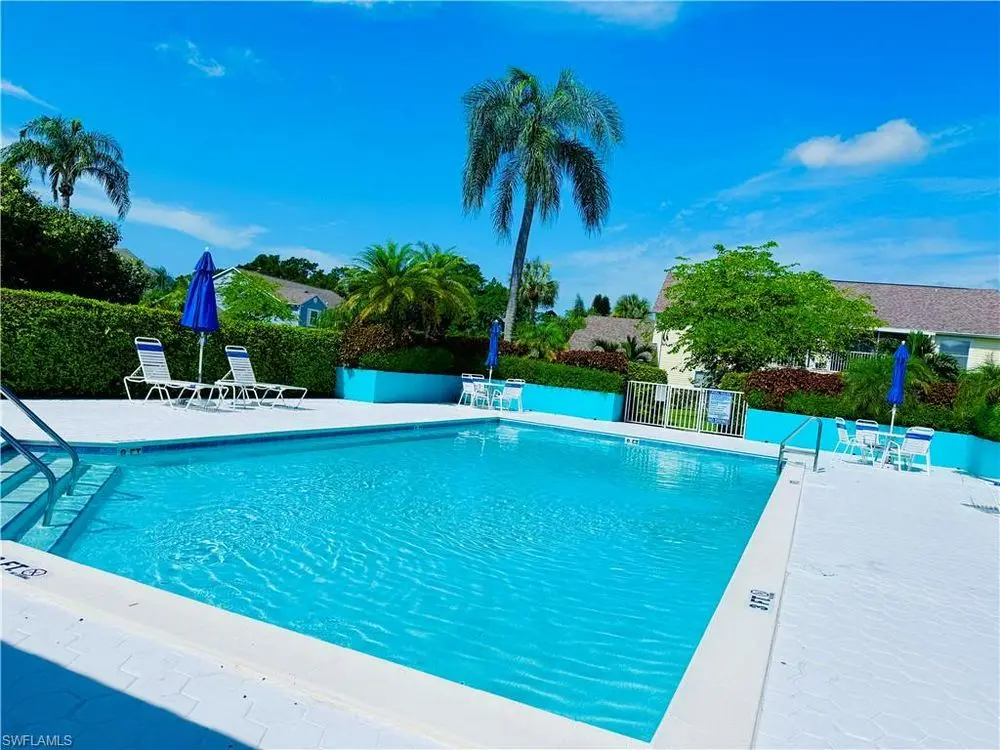
For Sale in Beautiful Berkshire Village FULLY FURNISHED 2/2 with all upgraded interior. Located in a small quiet community. One car attached garage with washer/dryer. New fridge (2023), microwave(2023), washer and garbage disposal(2026). Spacious living area with vaulted ceilings. Huge master bedroom and bath with large walk in closet with plenty of storage and built in custom shelves/drawers. Main bath has a jet tub. Hurricane windows with plantain shutters throughout. Screened lanai that leads to the pool. Perfect for first time buyers, snowbirds or investors. All you have to do is move in! Close to park, shopping, Publix and I-75.
Key facts
- New garbage disposal
- New fridge
- New washer
Tags
Neighborhood map
What this means for you Summary
Snapshot
- This is a 2-bed/2.0-bath condo listed at $275k. Condition is rated good.
Deal economics
- At list price, monthly cash flow is $-56 ($-677/yr) — negative.
- To cash-flow at today's rent, offer at most $267k (3.0% below list).
- To meet the 1% rule (rent ≥ 1% of price), the offer needs to be $253k (8.1% below list).
- Recommended offer: $253k (8.1% below list) — sets the bar for 1% rule.
Location & tenants
- Location reads 69/100 on livability (#455 in FL) — a middle-class / working-renter tenant base. Strengths: housing A+, health & safety A+, cost of living B; Watch: schools C-, employment D+, amenities F.
- Collier (suburban): math 60% / reading 56% proficiency, ranked #16 of 73 in FL (top 22%) — acceptable for families but not a draw, mixed tenant base, ~2y average lease.
- Market conditions: Rents soft (-2.2%/yr); 121 active listings in the ZIP; 40 comparable units currently listed for rent nearby; rentals at typical pace (median 14d on market — plan ~3-4 weeks tenant-placement turnaround); 3,520 units permitted in Collier County in 2024 (959 in 5+ unit buildings).
- This rent runs 41% of the median local income ($74k/yr) — at the standard rent-burdened threshold; future hikes will face affordability resistance.
Forward outlook
- Local home prices are declining (-3.0%/yr); year-one equity from $2k of loan paydown is wiped out by about $8k of value loss. Plan a longer hold.
- Collier County population projected at +30% by 2050 — long-run rental-demand tailwind backs the buy-and-hold thesis.
Negotiation context
- Only 14 days on market — expect competitive offers; lowballing is unlikely to land.
Risks & watch-outs
- Watch-outs: flood insurance adds $152/mo.
- Climate carrying-cost: in FEMA flood zone AH (mandatory federal flood insurance); severe wind risk, 99% chance of damaging wind over 30y; extreme-heat days projected 7→30/yr by 2055 (HVAC capex compounding) — expect insurance premiums to compound above CPI over the hold.
Questions for the listing agent
- What do current leases actually rent for vs. the listed asking? Can we see a recent rent roll and the last 12 months of T-12 income?
- What's the actual annual flood-insurance premium (NFIP or private), and is the property in a SFHA with mandatory coverage?
- Any open or pending special assessments — roof, HVAC, plumbing, elevator, façade? What's the per-unit balance and payoff schedule, and is the seller paying it off at close or rolling it to the buyer?
- Is there a deadline driving the sale (1031 exchange, divorce, estate, relocation)? That informs how much negotiation room exists.
- The area grade is low — what's the realistic commute time and amenity access for the typical tenant pool here? Any planned neighborhood developments (good or bad) we should know about?
- What's the average days-on-market for RENTAL listings here right now (not sales)? A rising rental-DOM trend means longer vacancies and softer asking-rent achievability than the comps imply.
- What's the recent tenant-quality profile in this submarket — average credit score on applications, eviction rate, late-payment / NSF rate, and stable-employment percentage? A property-management company in the area should have these aggregated.
- How much new apartment / multifamily construction is in the pipeline within 1–3 miles? Heavy new supply (>2% of stock underway) typically softens rents 12–24 months out; light construction supports rent growth.
Investment metrics
- 1% rule
- 0.92% ✗
- Cap rate
- 6.71%
- Cash-on-cash
- 1.49%
- DSCR
- 1.07
- GRM
- 9.1
CMA / ARV
No comps found within radius.
Projected returns pro-forma
-3.0% appreciation · 0.0% rent growth · sell at horizon
- IRR
- -21.4%
- Equity multiple
- 0.28×
- Total profit
- $-55,426
- Equity at exit
- $41,003
- IRR
- -25.3%
- Equity multiple
- -0.05×
- Total profit
- $-80,970
- Equity at exit
- $23,777
Cash invested: $77,000 (down + closing). Projections, not guarantees.
Landlord ↔ Tenant lean methodology
- Overall (STATE)
- 87 Strongly Landlord-Friendly
- State Florida
- 87 Strongly Landlord-Friendly · R+3
- County
- — inherits STATE
- City
- — inherits STATE
ZIP-level market 34116
- Rents YoY
- -2.2%
- Active inventory
- 121
- Price-to-rent
- 9.1×
Monthly cashflow live
- Estimated rent
- $2,527 high interval (Pro) →
- Mortgage (P&I)
- −$1,442
- Tax est. 1.5%
- −$344 /mo · $4,125/yr
- Insurance
- −$115
- Flood insurance flood zone
- −$152 /mo · $1,824/yr
- HOA
- −$0
- Vacancy / Maint / Mgmt
- −$531
- Net cashflow
- $-56
Break-even live
UW: 25.0% down · 7.5% · 30yr · 1.5% tax · 5.0% vac · 8.0% maint · 8.0% mgmt
Financing live
Cash to close
- Down payment
- $68,750
- Closing costs
- $8,250
- Reserves months
- —
- Total cash needed
- —
Loan-product check · same deal, 3 products live
Conventional
25% down · 7.5% · 30yr
- Down + closing
- —
- Monthly P&I
- —
- Monthly cashflow
- —
- DSCR
- —
- Eligible?
- —
Personal DTI + credit; lowest rate.
DSCR
20% down · 8.5% · 30yr
- Down + closing
- —
- Monthly P&I
- —
- Monthly cashflow
- —
- DSCR
- —
- Eligible?
- —
No personal income docs; deal must DSCR.
Hard money
10% down · 12.0% · 12mo
- Down + closing
- —
- Monthly P&I
- —
- Monthly cashflow
- —
- DSCR
- —
- Eligible?
- —
Short-term bridge; refi at stabilization.
Rent comps 40 comps
| Address | Beds | Baths | Sqft | Rent | $/sqft | DOM | Units | Dist |
|---|---|---|---|---|---|---|---|---|
| 1448 Churchill Cir #103 Naples, FL | 2.0 | 2.0 | 1200 | $1,900 | $1.58 | 14d | 1 | 0.12mi |
| 1357 Churchill Cir Unit G202 Naples, FL | 2.0 | 2.0 | 1200 | $1,995 | $1.66 | 14d | 1 | 0.16mi |
| 1392 Churchill Cir Unit O101 Naples, FL | 3.0 | 2.0 | 1350 | $2,300 | $1.70 | 14d | 1 | 0.21mi |
| 1600 Wellesley Cir Naples, FL | 1.0–2.0 | 1.0–2.0 | 950 | $1,900 | $2.00 | 14d | 12 | 0.22mi |
| 1200 Commonwealth Cir #103 Naples, FL | 2.0 | 2.0 | 1245 | $1,875 | $1.51 | 14d | 1 | 0.35mi |
| 3536 Winifred Row Ln Naples, FL | 3.0 | 2.5 | 1300 | $2,350 | $1.81 | 14d | 10 | 0.41mi |
| 1220 Commonwealth Cir Unit M106 Naples, FL | 2.0 | 2.0 | 1245 | $2,100 | $1.69 | 23d | 1 | 0.44mi |
| 1228 Commonwealth Cir Unit O203 Naples, FL | 2.0 | 2.0 | 1245 | $2,100 | $1.69 | 14d | 1 | 0.49mi |
| 661 Squire Cir #101 Naples, FL | 3.0 | 2.0 | 1450 | $2,095 | $1.44 | 14d | 1 | 0.51mi |
| 716 Landover Cir #102 Naples, FL | 2.0 | 2.0 | 1300 | $3,200 | $2.46 | 23d | 1 | 0.54mi |
| 7790 Woodbrook Cir #2603 Naples, FL | 3.0 | 2.5 | 1406 | $4,500 | $3.20 | 23d | 1 | 0.54mi |
| 717 Landover Cir #103 Naples, FL | 2.0 | 2.0 | 1300 | $3,800 | $2.92 | 23d | 1 | 0.56mi |
| 915 New Waterford Dr Unit H201 Naples, FL | 2.0 | 2.0 | 1362 | $4,150 | $3.05 | 14d | 1 | 0.59mi |
| 505 Windsor Sq #201 Naples, FL | 3.0 | 2.0 | 1191 | $2,365 | $1.99 | 14d | 1 | 0.60mi |
| 529 Mardel Dr #311 Naples, FL | 2.0 | 2.0 | 1093 | $3,500 | $3.20 | 23d | 1 | 0.62mi |
| 541 Windsor Sq Unit 9 Naples, FL | 2.0 | 2.0 | 1421 | $2,500 | $1.76 | 14d | 1 | 0.66mi |
| 565 Windsor Sq #201 Naples, FL | 3.0 | 2.0 | 1421 | $3,800 | $2.67 | 21d | 1 | 0.68mi |
| 484 Belina Dr Naples, FL | 2.0 | 1.0 | 1200 | $2,400 | $2.00 | 23d | 1 | 0.68mi |
| 191 Bennington Dr Unit 12-6 Naples, FL | 2.0 | 2.0 | 1240 | $1,450 | $1.17 | 23d | 1 | 0.68mi |
| 636 Windsor Sq #102 Naples, FL | 2.0 | 2.0 | 1191 | $3,750 | $3.15 | 23d | 1 | 0.68mi |
| 1130 Partridge Cir Ofc Season Naples, FL | 2.0 | 2.0 | 1191 | $1,800 | $1.51 | 23d | 1 | 0.69mi |
| 1130 Partridge Cir Unit Annual Naples, FL | 2.0 | 2.0 | 1191 | $1,950 | $1.64 | 23d | 1 | 0.69mi |
| 1130 Partridge Cir #102 Naples, FL | 2.0 | 2.0 | 1191 | $3,800 | $3.19 | 23d | 1 | 0.69mi |
| 800 New Waterford Dr #201 Naples, FL | 2.0 | 2.0 | 1362 | $2,440 | $1.79 | 21d | 1 | 0.71mi |
| 613 Windsor Sq #101 Naples, FL | 2.0 | 2.0 | 1316 | $3,800 | $2.89 | 23d | 1 | 0.72mi |
| 515 Gabriel Cir Unit 1910 Naples, FL | 2.0 | 2.0 | 1200 | $4,700 | $3.92 | 14d | 1 | 0.74mi |
| 388 Belina Dr Unit 1104 Naples, FL | 2.0 | 2.0 | 1200 | $4,000 | $3.33 | 14d | 1 | 0.74mi |
| 1095 Partridge Cir #201 Naples, FL | 2.0 | 2.0 | 1402 | $1,800 | $1.28 | 21d | 1 | 0.76mi |
| 620 Luisa Ct Unit 803 Naples, FL | 2.0 | 2.0 | 1200 | $2,400 | $2.00 | 14d | 1 | 0.81mi |
| 448 Gabriel Cir Unit 3310 Naples, FL | 2.0 | 2.0 | 1200 | $3,500 | $2.92 | 14d | 1 | 0.82mi |
| 228 Belina Dr Unit 606 Naples, FL | 2.0 | 2.0 | 1200 | $4,800 | $4.00 | 14d | 1 | 0.87mi |
| 675 Luisa Ln Unit 825 Naples, FL | 3.0 | 2.0 | 1484 | $2,300 | $1.55 | 14d | 1 | 0.87mi |
| 153 Gabriel Cir Unit 3003 Naples, FL | 2.0 | 2.0 | 1200 | $4,000 | $3.33 | 14d | 1 | 1.00mi |
| 218 Gabriel Cir Unit 3809 Naples, FL | 2.0 | 2.0 | 1200 | $3,800 | $3.17 | 14d | 1 | 1.03mi |
| 116 Santa Clara Dr #12 Naples, FL | 1.0 | 1.0 | 745 | $1,600 | $2.15 | 14d | 1 | 1.03mi |
| 108 Santa Clara Dr #4 Naples, FL | 2.0 | 2.0 | 974 | $1,950 | $2.00 | 14d | 1 | 1.04mi |
| 7725 Tara Cir Naples, FL | 1.0–3.0 | 1.0–2.0 | 929 | $1,512 | $1.63 | 14d | 1 | 1.07mi |
| 6643 Craven Hill Way Naples, FL | 3.0 | 2.0 | 1384 | $2,900 | $2.10 | 14d | 1 | 1.08mi |
| 2400 55th Ter SW Naples, FL | 2.0 | 1.0 | 1100 | $1,950 | $1.77 | 23d | 1 | 1.09mi |
| 7320 Glenmoor Ln Unit 2206 Naples, FL | 2.0 | 2.0 | 1053 | $6,000 | $5.70 | 14d | 1 | 1.09mi |
HOA detail condo
- Monthly dues
- $0 · $0/yr
- Likely covers
- trashpool
- Assessments
- None detected in remarks — confirm with the listing agent.
Listing history 10 events
-
2026-06-18days on market $275,000 Active 14 DOM
-
2026-06-17days on market $275,000 Active 13 DOM
-
2026-06-16days on market $275,000 Active 12 DOM
-
2026-06-15remarks 643-char remark
-
2026-06-15pricedays on market $275,000 Active 11 DOM
-
2026-06-10days on market $279,000 Active 6 DOM
-
2026-06-09days on market $279,000 Active 5 DOM
-
2026-06-08days on market $279,000 Active 4 DOM
-
2026-06-07remarks 624-char remark
-
2026-06-07$279,000 Active 3 DOM
ⓘ Source: listings_history table (triggers on properties + properties_extension) + one-shot
backfill from property_details.listing_events for pre-trigger history.
Climate risk First Street
- Flood 4/10 Moderate FEMA zone AH · 22% chance over 30 yrs
- Wildfire 2/10 Low
- Heat 10/10 Extreme 7 d/yr ≥107°F today · 30 d/yr by 30 yrs out
- Wind 10/10 Extreme 99% chance of damaging wind over 30 yrs
- Air quality 2/10 Low 2 unhealthy d/yr today · 2 by 30 yrs out
Nearby sold comps map
Loading sold comps map…
Walkable amenities ~0.75 mi
Loading nearby amenities…
Taxation est. · year 1
- Rental income
- $30,321
- − Mortgage interest
- −$15,404
- − Property taxes
- −$4,125
- − Insurance
- −$3,200
- − Repairs & maintenance
- −$2,426
- − Management
- −$2,426
- − Depreciation
- −$8,000
- Taxable loss
- −$5,259
- Est. tax savings @ 24.0%
- +$1,262
- After-tax cash flow
- $586/yr
For passive investors: Depreciation is non-cash, so a rental often shows a tax loss while cash-flowing — sheltering income. Rental losses are passive: they offset passive income freely, and up to $25,000/yr can offset ordinary (W-2) income if you actively participate and your MAGI is under $100k (phasing out to $0 by $150k); unused losses carry forward. On sale, claimed depreciation is recaptured at up to 25%, and gains may owe capital-gains tax (a 1031 exchange can defer both). Figures are a year-1 estimate at your 24.0% rate — not tax advice; consult a CPA.
Condition & rehab AI · 13 photos
This fully furnished 2/2 condo in Berkshire Village is in good condition with upgrades to the appliances and a well-maintained exterior. Minor updates to the flooring and interior paint could further enhance its resale and rental value.
Value-add opportunities
- Resale Upgrade the flooring in the kitchen and bathrooms to a more modern material — Modern flooring can enhance the overall aesthetic and appeal of the home to potential buyers.
- Resale Paint the interior walls to refresh the look of the home — Fresh paint can make the home feel more inviting and modern, which can appeal to potential buyers.
- Both Install new windows or replace the existing ones — New windows can improve energy efficiency and increase the home's curb appeal, benefiting both resale and rental value.
Renovation cost estimate screening
Value-add ROI direction
- Resale Upgrade the flooring in the kitchen and bathrooms to a more modern material — Modern flooring can enhance the overall aesthetic and appeal of the home to potential buyers. ↑
- Resale Paint the interior walls to refresh the look of the home — Fresh paint can make the home feel more inviting and modern, which can appeal to potential buyers. ↑
- Both Install new windows or replace the existing ones — New windows can improve energy efficiency and increase the home's curb appeal, benefiting both resale and rental value. ↑
ⓘ Cost ranges are severity-bucket heuristics (US national rule-of-thumb). Get contractor quotes + a written scope before underwriting a rehab budget.
Schools (NCES district)
- District
- Collier
- NCES district ID
- 1200330
- Math proficiency
- 60% ▼ -4.00%
- Reading proficiency
- 56% ▼ -2.00%
- Median HH income
- $58,275
- Composite
- 50.23/100
- National rank
- #1892
- State rank
- #16 of 73 in FL
Livability — Golden Gate
- Score
- 69/100
- State rank
- #455
- US rank
- #8290
Category grades
Schools grade is shown separately in the Schools card above.
Census & demographics
- County
- Collier County · 396,295 people
- City population
- 34,872
- Metro
- Naples-Marco Island, FL
- Population (ZIP)
- 35,591
- Household income
- $73,958
- Rent vs Own
- Severe rent burden
- 1540.0
Population outlook (Collier County) Hauer SSP2
- Today (2025)
- 420,858 people
- By 2030
- 450,054 · +6.9%
- By 2040
- 502,232 · +19.3%
- By 2050
- 544,932 · +29.5%
- By 2075
- 627,203 · +49.0%
- By 2100
- 659,015 · +56.6%
Race, ethnicity, and origin ACS 2023
- Neighborhood character
- Diverse neighborhood (Simpson 0.56)
- Race & ethnicity
- Hispanic / Latino 60% Two or more races 40% White 24% Black 13% Native American 2%
- Hispanic origin (detail)
- Mexican 15% Puerto Rican 2% Cuban 20%
- Common ancestry
- Hispanic 8% Slovak 1% Romanian 1%
- Foreign-born
- 47% · Canada, Jamaica, Dominican Republic
- Languages at home
- 33% English-only · Spanish 55% French/Haitian/Cajun 9% Other Indo-European 1%
Political lean MEDSL · Collier
- 2024 margin
- Solid R (+33.1) · D 33.1% · R 66.2%
- 2008→2024 swing
- -10.6pp toward R · 2008: -22.5pp · 2024: -33.1pp
- All cycles
- 2024: R+33.1 2020: R+24.7 2016: R+26.0 2012: R+30.1 2008: R+22.5
Not yet ingested
- Civics
- —
Market trends
- HPI YoY
- ▼ -313.48%
- Current HPI
- 397.7049
- Rent YoY
- ▼ -2.19%
- Metro
- Naples-Marco Island, FL
- State GDP YoY
- ▲ 3.28%
- F500 in state
- 36
Industry mix (Fortune 500 HQ in FL)
| Industry | F500 HQs | Revenue |
|---|---|---|
| Industrial Technology | 2 | $29B |
|
||
| Insurance | 2 | $17B |
|
||
| Retail | 1 | $60B |
|
||
| Technology Distribution | 1 | $58B |
|
||
| Homebuilding | 1 | $35B |
|
||
| Technology Manufacturing | 1 | $35B |
|
||
Price history
1 event — show timeline
- 2026-06-04 Listed $279,000 ForSaleByOwner.com
Cash-flow waterfall
monthlySold comps — $/sqft
last 12 mo · ≤1 miLoading sold comps…