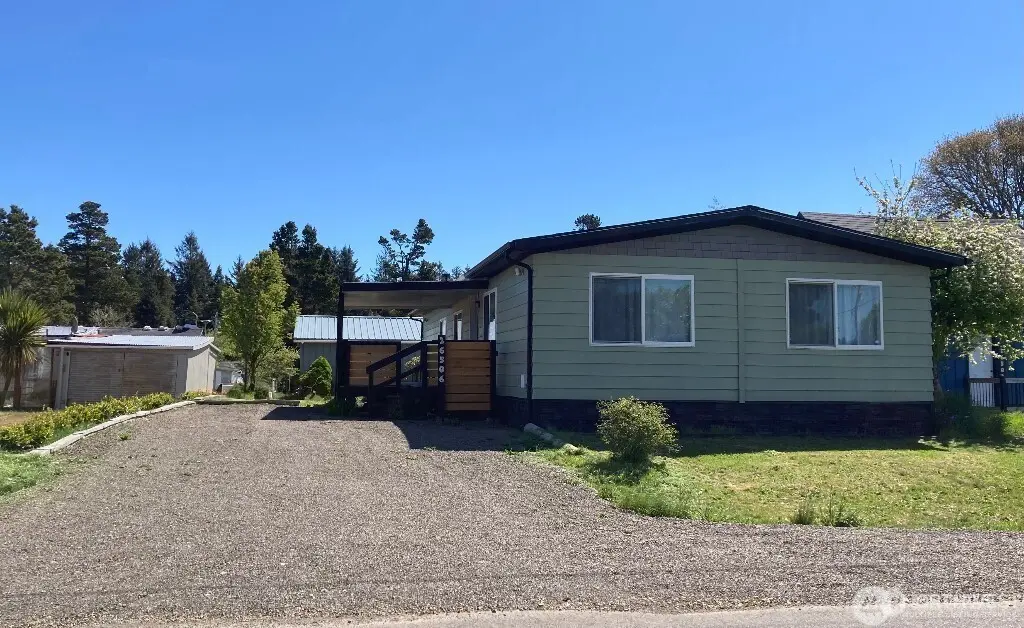
26506 Ridge Ave · Ocean Park, WA
Flood risk 1/10 · Minimal
- FEMA flood zone
- X (unshaded)
- Chance of flooding over 30 yrs
- 0.0%
- Est. flood insurance / yr
- $507 – $1,088
Fire risk 1/10 · Minimal
- Est. fire insurance / yr
- $604 – $1,122
Heat risk 1/10 · Minimal
- Hot days now (above 74°F)
- 7 days/yr
- Hot days in 30 yrs
- 16 days/yr
Wind risk 1/10 · Minimal
- Chance of severe wind over 30 yrs
- —
Air-quality risk 5/10 · Moderate
- Unhealthy air days now
- 6 days/yr
- Unhealthy air days in 30 yrs
- 6 days/yr
Risk factors via First Street. Map © Google.
Why this score? — see what drove the C+ grade
The composite is a weighted blend of 9 inputs, each scored 0–100. Each bar is that input's sub-score; the figure is the points it added to the 100-point composite (weight × sub-score).
- Cash flow +22.2/30.0
- ARV discount +15.0/15.0
- DSCR +7.1/10.0
- 1% rule +5.0/10.0
- Schools +3.7/10.0
- Livability +3.6/5.0
- Rent growth +2.5/5.0
- Condition / age +2.5/5.0
- Appreciation +0.0/10.0
$249,000
🖨 Deal sheet 📄 Offer letter ✓ Due diligence
Listing remarks
Remodeled and ready for your beach retreat or year-round residence! New in 2022: all new cabinets, countertops, energy efficient LED lighting, doors, security doors, security cameras, and Pergo flooring. Appliances replaced: stove, refrigerator, washer and dryer. Kitchen is wired for dishwasher and can be installed by removing the bank of drawers to the right of the sink. Big ticket items updated and replaced: Pex plumbing (freeze resistant), energy efficient windows, wall heaters, and new gravity fed-septic installed in 2023 and inspected in November 2025, new roof in 2024.
Key facts
- Security cameras
- Security doors
- New cabinets
Tags
Neighborhood map
What this means for you Summary
Snapshot
- This is a 3-bed/2.0-bath manufactured listed at $249k.
Deal economics
- At list price, monthly cash flow is $404 ($5k/yr) — positive.
- The deal already cash-flows at list — no discount required.
- Meets the 1% rule at list price ($2k rent vs $249k).
- Recommended offer: $219k (12.0% below list) — sets the bar for market timing.
- Cap rate 8.2% vs local median 4.2% in Ocean Park — top-decile yield for the area; either an underpriced asset or a hidden risk that comps aren't pricing in. Stress-test before assuming the spread holds.
Location & tenants
- Location reads 72/100 on livability (#216 in WA) — a middle-class / working-renter tenant base. Strengths: housing A+, health & safety A+, crime A; Watch: commute D+, employment D+, schools F.
- Ocean Beach School District (rural): math 34% / reading 50% proficiency, ranked #212 of 291 in WA (top 73%) — families likely to look elsewhere, expect single-tenant / working-renter base with shorter leases.
- Market conditions: 311 active listings in the ZIP; 3 comparable units currently listed for rent nearby; rentals lingering (median 44d on market — plan ~5-8 weeks vacancy on turnover, expect pricing pressure); 100% of comp listings sitting > 30 days — soft ceiling on asking rent; 90 units permitted in Pacific County in 2024 (0 in 5+ unit buildings).
Forward outlook
- Local home prices are declining (-3.0%/yr); year-one equity from $2k of loan paydown is wiped out by about $7k of value loss. Plan a longer hold.
- Pacific County population projected at -10% by 2050 — secular population decline; favor cash flow + early exit over multi-decade hold.
Negotiation context
- It's been on market 162 days — a 12% lower offer ($219k) is reasonable based on typical stale-listing flexibility.
- 3 sale attempts since 4y ago; this cycle's ask has dropped $60k (19%) from the opening price — seller is motivated, your offer sets the floor, not the list.
- Current owner paid $120k; list at $249k implies a 108% gain — meaningful room to come down on a strong offer.
Questions for the listing agent
- It's been on market 162 days. Have you received any prior offers? Is the seller open to a 12% concession, seller financing, or rate buy-down credit?
- Why hasn't it sold? Are there any deal-killer items the seller is aware of (foundation, flood, title, zoning, code violations)?
- Is there a deadline driving the sale (1031 exchange, divorce, estate, relocation)? That informs how much negotiation room exists.
- Schools are F-rated, which usually means shorter tenancies and higher turnover. Who's the typical renter profile here, and what's been the actual vacancy rate?
- What's the average days-on-market for RENTAL listings here right now (not sales)? A rising rental-DOM trend means longer vacancies and softer asking-rent achievability than the comps imply.
- What's the recent tenant-quality profile in this submarket — average credit score on applications, eviction rate, late-payment / NSF rate, and stable-employment percentage? A property-management company in the area should have these aggregated.
- How much new for-sale + rental construction is in the pipeline within 1–3 miles? Heavy new supply typically softens prices + rents 12–24 months out; constrained supply supports both.
Investment metrics
- 1% rule
- 1.00% ✓
- Cap rate
- 8.24%
- Cash-on-cash
- 6.95%
- DSCR
- 1.31
- GRM
- 8.3
CMA / ARV
- ARV (median comp)
- $329,151
- List price
- $249,000
- Delta
- -24.35%
- Verdict
- UNDERPRICED
- Comps
- 20 within 1.0 mi
Show comp detail 6 sales within ~0.75 mi
| Address | Dist | Beds/Ba | Sqft | Sold | Price | $/sf | Match |
|---|---|---|---|---|---|---|---|
| 26888 U St | 0.29mi | 2/2.0 (-1) | 1,458 (+1%) | 16mo | $400,000 | $274 | 66 |
| 1710 263rd St | 0.14mi | 2/2.0 (-1) | 1,296 (-10%) | 9mo | $386,250 | $298 | 65 |
| 27904 J Ln | 0.74mi | 3/2.0 | 1,404 (-2%) | 10mo | $353,500 | $252 | 53 |
| 27905 Q Ln | 0.68mi | 3/2.0 | 1,456 (+1%) | 22mo | $359,000 | $247 | 48 |
| 25211 U St | 0.71mi | 3/3.0 | 1,404 (-2%) | 21mo | $480,000 | $342 | 41 |
| 2550 259th Ln | 0.53mi | 2/3.0 (-1) | 1,539 (+7%) | 19mo | $353,000 | $229 | 39 |
Match score weights: distance 35% · size 25% · config 20% · recency 20%. Top-matched comps best support the ARV.
Projected returns pro-forma
-3.0% appreciation · 3.0% rent growth · sell at horizon
- IRR
- -5.7%
- Equity multiple
- 0.79×
- Total profit
- $-14,689
- Equity at exit
- $37,127
- IRR
- 4.0%
- Equity multiple
- 1.29×
- Total profit
- $20,096
- Equity at exit
- $21,529
Cash invested: $69,720 (down + closing). Projections, not guarantees.
Landlord ↔ Tenant lean methodology
- Overall (STATE)
- 28 Tenant-Leaning
- State Washington
- 28 Tenant-Leaning · D+8
- County
- — inherits STATE
- City
- — inherits STATE
ZIP-level market 98640
- Home prices YoY
- -26.7%
- Active inventory
- 311
- Price-to-rent
- 8.3×
Monthly cashflow live
- Estimated rent
- $2,497 medium interval (Pro) →
- Mortgage (P&I)
- −$1,306
- Tax from tax record
- −$160 /mo · $1,917/yr
- Insurance
- −$104
- HOA
- −$0
- Vacancy / Maint / Mgmt
- −$524
- Net cashflow
- $404
Break-even live
UW: 25.0% down · 7.5% · 30yr · 1.5% tax · 5.0% vac · 8.0% maint · 8.0% mgmt
Financing live
Cash to close
- Down payment
- $62,250
- Closing costs
- $7,470
- Reserves months
- —
- Total cash needed
- —
Loan-product check · same deal, 3 products live
Conventional
25% down · 7.5% · 30yr
- Down + closing
- —
- Monthly P&I
- —
- Monthly cashflow
- —
- DSCR
- —
- Eligible?
- —
Personal DTI + credit; lowest rate.
DSCR
20% down · 8.5% · 30yr
- Down + closing
- —
- Monthly P&I
- —
- Monthly cashflow
- —
- DSCR
- —
- Eligible?
- —
No personal income docs; deal must DSCR.
Hard money
10% down · 12.0% · 12mo
- Down + closing
- —
- Monthly P&I
- —
- Monthly cashflow
- —
- DSCR
- —
- Eligible?
- —
Short-term bridge; refi at stabilization.
Rent comps 3 comps
| Address | Beds | Baths | Sqft | Rent | $/sqft | DOM | Units | Dist |
|---|---|---|---|---|---|---|---|---|
| 24904 J Pl Ocean Park, WA | 2.0 | 1.0 | 900 | $2,900 | $3.22 | 43d | 1 | 0.86mi |
| 27906 U St Ocean Park, WA | 3.0 | 2.5 | 1440 | $2,600 | $1.81 | 43d | 1 | 0.87mi |
| 29014 S Ln Ocean Park, WA | 2.0 | 1.0 | 924 | $1,700 | $1.84 | 43d | 1 | 1.25mi |
Listing history 25 events
-
2026-06-18days on market $249,000 Active 162 DOM
-
2026-06-17days on market $249,000 Active 161 DOM
-
2026-06-16days on market $249,000 Active 160 DOM
-
2026-06-15days on market $249,000 Active 159 DOM
-
2026-06-15days on market $249,000 Active 158 DOM
-
2026-06-13days on market $249,000 Active 157 DOM
-
2026-06-12days on market $249,000 Active 156 DOM
-
2026-06-09days on market $249,000 Active 153 DOM
-
2026-06-08days on market $249,000 Active 152 DOM
-
2026-06-08days on market $249,000 Active 151 DOM
-
2026-06-07days on market $249,000 Active 150 DOM
-
2026-06-03days on market $249,000 Active 147 DOM
-
2026-06-02days on market $249,000 Active 146 DOM
-
2026-06-01days on market $249,000 Active 145 DOM
-
2026-05-31days on market $249,000 Active 144 DOM
-
2026-05-19price $249,000
-
2026-04-12price $279,000
-
2026-01-07$309,000 Active
-
2025-11-20soldstatus $120,000 Closed
-
2025-11-03status Pending
-
2025-09-28$149,000 Active
-
2022-06-24soldstatus $232,000 Closed
-
2022-06-24soldstatus $232,000
-
2022-06-11status Pending
-
2022-05-06$249,900 Active
ⓘ Source: listings_history table (triggers on properties + properties_extension) + one-shot
backfill from property_details.listing_events for pre-trigger history.
Tax reassessment forecast WA · Resets to sale price
- Current annual tax
- $1,917 · $160/mo
- Projected year-2 tax
- $2,440 · $203/mo
- Expected delta
- +$523/yr (+$44/mo · 27.3%)
ⓘ Screening estimate from a state-policy table — verify with the county assessor before closing.
Climate risk First Street
- Flood 1/10 Low FEMA zone X (unshaded) · 0% chance over 30 yrs
- Wildfire 1/10 Low
- Heat 1/10 Low 7 d/yr ≥74°F today · 16 d/yr by 30 yrs out
- Wind 1/10 Low
- Air quality 5/10 Major 6 unhealthy d/yr today · 6 by 30 yrs out
Nearby sold comps map
Loading sold comps map…
Walkable amenities ~0.75 mi
Loading nearby amenities…
Taxation est. · year 1
- Rental income
- $29,970
- − Mortgage interest
- −$13,948
- − Property taxes
- −$1,917
- − Insurance
- −$1,245
- − Repairs & maintenance
- −$2,398
- − Management
- −$2,398
- − Depreciation
- −$7,244
- Taxable income
- $821
- Est. tax owed @ 24.0%
- −$197
- After-tax cash flow
- $4,648/yr
For passive investors: Depreciation is non-cash, so a rental often shows a tax loss while cash-flowing — sheltering income. Rental losses are passive: they offset passive income freely, and up to $25,000/yr can offset ordinary (W-2) income if you actively participate and your MAGI is under $100k (phasing out to $0 by $150k); unused losses carry forward. On sale, claimed depreciation is recaptured at up to 25%, and gains may owe capital-gains tax (a 1031 exchange can defer both). Figures are a year-1 estimate at your 24.0% rate — not tax advice; consult a CPA.
Schools (NCES district)
- District
- Ocean Beach School District
- NCES district ID
- 5306060
- Math proficiency
- 34% ▼ -1.00%
- Reading proficiency
- 50% ▲ 1.00%
- Median HH income
- $38,549
- Composite
- 37.37/100
- National rank
- #8929
- State rank
- #212 of 291 in WA
Livability — Ocean Park
- Score
- 72/100
- State rank
- #216
- US rank
- #6161
Category grades
Schools grade is shown separately in the Schools card above.
Census & demographics
- Census place
- Ocean Park, WA
- Population (ZIP)
- 5,107
Population outlook (Pacific County) Hauer SSP2
- Today (2025)
- 20,636 people
- By 2030
- 20,137 · -2.4%
- By 2040
- 19,041 · -7.7%
- By 2050
- 18,504 · -10.3%
- By 2075
- 17,403 · -15.7%
- By 2100
- 16,241 · -21.3%
Race, ethnicity, and origin ACS 2023
- Neighborhood character
- Predominantly White (88%)
- Race & ethnicity
- White 88% Two or more races 6% Hispanic / Latino 6% Asian 3%
- Hispanic origin (detail)
- Mexican 5%
- Common ancestry
- Portuguese 5% Lithuanian 4% Slovak 4%
- Foreign-born
- 7% · Canada, China
- Languages at home
- 92% English-only · Spanish 4% Chinese 1% German/W. Germanic 1%
Political lean MEDSL · Pacific
- 2024 margin
- Toss-up / Even · D 48.1% · R 49.4% · Other 2.4%
- 2008→2024 swing
- -15.4pp toward R · 2008: 14.1pp · 2024: -1.3pp
- All cycles
- 2024: R+1.3 2020: R+1.1 2016: R+6.9 2012: D+11.4 2008: D+14.1
Not yet ingested
- Civics
- —
Market trends
- HPI YoY
- ▼ -81.15%
- Current HPI
- 222.8758
- Rent YoY
- —
- Metro
- —
- State GDP YoY
- ▲ 4.65%
- F500 in state
- 22
Industry mix (Fortune 500 HQ in WA)
| Industry | F500 HQs | Revenue |
|---|---|---|
| Retail | 2 | $269B |
|
||
| Technology / Retail | 1 | $638B |
|
||
| Technology | 1 | $245B |
|
||
| Telecommunications | 1 | $38B |
|
||
| Food / Beverage | 1 | $36B |
|
||
| Automotive / Trucks | 1 | $34B |
|
||
Price history
-0.4% since first listed10 events — show timeline
- 2026-05-19 Price Changed $249,000 NWMLS as Distributed by MLS Grid
- 2026-04-12 Price Changed $279,000 NWMLS as Distributed by MLS Grid
- 2026-01-07 Listed $309,000 NWMLS as Distributed by MLS Grid
- 2025-11-20 Sold (MLS) $120,000 NWMLS as Distributed by MLS Grid
- 2025-11-03 Pending — NWMLS as Distributed by MLS Grid
- 2025-09-28 Listed $149,000 NWMLS as Distributed by MLS Grid
- 2022-06-24 Sold (Public Records) $232,000 Public Records
- 2022-06-24 Sold (MLS) $232,000 NWMLS as Distributed by MLS Grid
- 2022-06-11 Pending — NWMLS as Distributed by MLS Grid
- 2022-05-06 Listed $249,900 NWMLS as Distributed by MLS Grid
Property tax history
+10.1%/yrLatest (2026): $1,917 · +30.4% YoY. Source: county tax records.
Cash-flow waterfall
monthlySold comps — $/sqft
last 12 mo · ≤1 miLoading sold comps…