366 S Grand Ave · Indianapolis city (balance), IN
Flood risk 1/10 · Minimal
- FEMA flood zone
- X (unshaded)
- Chance of flooding over 30 yrs
- 0.0%
- Est. flood insurance / yr
- $473 – $860
Fire risk 1/10 · Minimal
- Est. fire insurance / yr
- $717 – $1,331
Heat risk 3/10 · Minor
- Hot days now (above 102°F)
- 7 days/yr
- Hot days in 30 yrs
- 19 days/yr
Wind risk 2/10 · Minimal
- Chance of severe wind over 30 yrs
- 1.0%
Air-quality risk 4/10 · Minor
- Unhealthy air days now
- 5 days/yr
- Unhealthy air days in 30 yrs
- 7 days/yr
Risk factors via First Street. Map © Google.
Why this score? — see what drove the C- grade
The composite is a weighted blend of 9 inputs, each scored 0–100. Each bar is that input's sub-score; the figure is the points it added to the 100-point composite (weight × sub-score).
- Cash flow +18.0/30.0
- ARV discount +12.9/15.0
- DSCR +5.6/10.0
- 1% rule +5.3/10.0
- Rent growth +3.2/5.0
- Livability +2.5/5.0
- Condition / age +2.5/5.0
- Schools +1.4/10.0
- Appreciation +0.0/10.0
$139,900
🖨 Deal sheet (PDF) 📄 Offer letter ✓ Due diligence
Listing remarks
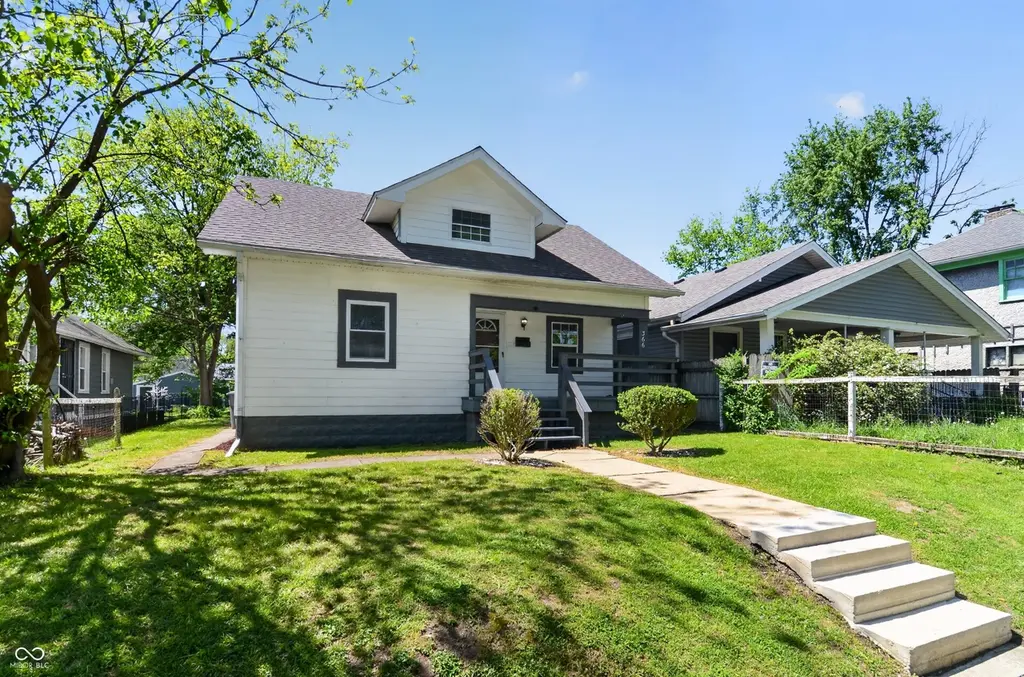
Charming bungalow-style home in an established neighborhood offering classic character and everyday convenience. This 1.5-story residence features a functional layout with comfortable living spaces, well-sized bedrooms, and a versatile upper level ideal for additional living or storage. The home sits on a mature city lot with shade trees and a welcoming front porch, perfect for relaxing outdoors. Detached parking and easy-maintenance yard add practicality. Conveniently located near local dining, shopping, parks, and quick access to major commuter routes and downtown Indianapolis. A great opportunity for homeowners or investors looking for value and potential in a well-loved area.
Key facts
- Mature city lot
- Shade trees
- Functional layout
Tags
Property features AI
Exterior
- Parking: No designated parking
- Security: Smoke alarm
- Utilities: Public water; Municipal sewer
- Home design: Single family residence; One level
- Construction: Aluminum siding; Block foundation
- Exterior features: City lot with sidewalks; Mature trees; Less than 1/4 acre (0.16 acres)
Interior
- Kitchen: Electric oven; Dishwasher; Refrigerator; Gas water heater
- Bedrooms: Three bedrooms on the main level (each approx. 10x10; one room 12x12)
- Flooring: Hardwood floors
- Bathrooms: One full bathroom (main level)
- Heating & cooling: Forced air heating (natural gas); No central air
- Interior features: Hardwood floors; Walk-in closet(s); Unfinished basement; Smoke alarm; Sump pump; Has view
- Laundry & utility: Sump pump
Neighborhood map
What this means for you Summary
Snapshot
- This is a 3-bed/1.0-bath single-family listed at $140k.
Deal economics
- At list price, monthly cash flow is $120 ($1k/yr) — positive.
- The deal already cash-flows at list — no discount required.
- Meets the 1% rule at list price ($1k rent vs $140k).
- Recommended offer: $136k (3.0% below list) — sets the bar for market timing.
- Cap rate 7.3% vs local median 4.4% in Indianapolis city (balance) — top-decile yield for the area; either an underpriced asset or a hidden risk that comps aren't pricing in. Stress-test before assuming the spread holds.
Location & tenants
- Location reads: area grade C — affects rentability + tenant quality, not the cash-flow math above.
- Indianapolis Public Schools (urban): math 14% / reading 20% proficiency, ranked #286 of 301 in IN (top 95%) — low school quality limits family demand, transient renter base, plan for 1-2y turnover; 77% free/reduced lunch — lower-income household profile, screen leases tightly.
- Zoned schools: Christian Park School 82 (math 8% / reading 8%, grade F, #949 of 994 statewide, top 97%, 246 students, 83% FRL); Arsenal Technical High School (math 6% / reading 27%, grade F, #353 of 369 statewide, top 96%, 2,366 students, 74% FRL) — zoned schools at 79% FRL track the district average.
- Market conditions: Rents rising (+2.6%/yr); 143 active listings in the ZIP; 31 comparable units currently listed for rent nearby; rentals at typical pace (median 25d on market — plan ~3-4 weeks tenant-placement turnaround); 42% of comp listings sitting > 30 days — soft ceiling on asking rent; 1,906 units permitted in Marion County in 2024 (621 in 5+ unit buildings).
Forward outlook
- Local home prices are declining (-3.0%/yr); year-one equity from $967 of loan paydown is wiped out by about $4k of value loss. Plan a longer hold.
- Marion County population projected at +18% by 2050 — long-run rental-demand tailwind backs the buy-and-hold thesis.
Negotiation context
- It's been on market 58 days — a 3% lower offer ($136k) is reasonable based on typical stale-listing flexibility.
- 11 sale attempts since 25y ago with the ask held roughly flat each time — persistent listings suggest the price (not the market) is what's stuck; bring a comps-based counter.
- Current owner paid $86k; list at $140k implies a 63% gain — meaningful room to come down on a strong offer.
Risks & watch-outs
- Watch-outs: built in 1900 — expect roof / HVAC / electrical / plumbing capex.
Questions for the listing agent
- It's been on market 58 days. Have you received any prior offers? Is the seller open to a 3% concession, seller financing, or rate buy-down credit?
- Built in 1900 — when were the roof, HVAC, electrical panel, plumbing, and water heater last replaced?
- Is there a deadline driving the sale (1031 exchange, divorce, estate, relocation)? That informs how much negotiation room exists.
- What's the average days-on-market for RENTAL listings here right now (not sales)? A rising rental-DOM trend means longer vacancies and softer asking-rent achievability than the comps imply.
- What's the recent tenant-quality profile in this submarket — average credit score on applications, eviction rate, late-payment / NSF rate, and stable-employment percentage? A property-management company in the area should have these aggregated.
- How much new for-sale + rental construction is in the pipeline within 1–3 miles? Heavy new supply typically softens prices + rents 12–24 months out; constrained supply supports both.
Investment metrics
- 1% rule
- 1.03% ✓
- Cap rate
- 7.33%
- Cash-on-cash
- 3.69%
- DSCR
- 1.16
- GRM
- 8.1
CMA / ARV
- ARV (median comp)
- $159,129
- List price
- $139,900
- Delta
- -12.08%
- Verdict
- UNDERPRICED
- Comps
- 20 within 1.0 mi
Show comp detail 12 sales within ~0.75 mi
| Address | Dist | Beds/Ba | Sqft | Sold | Price | $/sf | Match |
|---|---|---|---|---|---|---|---|
| 340 S Grand Ave | 0.05mi | 3/1.0 | 1,741 (+3%) | 0mo | $125,000 | $72 | 92 |
| 4922 Brookville Rd | 0.20mi | 2/1.0 (-1) | 1,624 (-4%) | 1mo | $165,000 | $102 | 78 |
| 145 S Bancroft St | 0.37mi | 2/1.0 (-1) | 1,535 (-9%) | 1mo | $110,000 | $72 | 62 |
| 5338 Brookville Rd | 0.27mi | 2/1.5 (-1) | 1,491 (-12%) | 1mo | $155,000 | $104 | 60 |
| 527 S Grand Ave | 0.23mi | 2/1.0 (-1) | 1,450 (-14%) | 1mo | $90,000 | $62 | 59 |
| 5413 Greenfield Ave | 0.31mi | 2/1.0 (-1) | 1,920 (+14%) | 1mo | $103,600 | $54 | 58 |
| 5754 Rawles Ave | 0.72mi | 2/1.0 (-1) | 1,728 (+2%) | 1mo | $220,000 | $127 | 57 |
| 701 S Grand Ave | 0.35mi | 2/1.0 (-1) | 1,450 (-14%) | 1mo | $118,000 | $81 | 54 |
| 621 S Butler Ave | 0.35mi | 2/1.0 (-1) | 1,450 (-14%) | 1mo | $120,000 | $83 | 54 |
| 4650 Young Ave | 0.44mi | 2/1.0 (-1) | 1,464 (-14%) | 1mo | $133,000 | $91 | 51 |
| 4601 English Ave | 0.53mi | 2/1.0 (-1) | 1,920 (+14%) | 1mo | $173,000 | $90 | 47 |
| 4301 English Ave | 0.71mi | 2/1.0 (-1) | 1,920 (+14%) | 0mo | $110,000 | $57 | 39 |
Match score weights: distance 35% · size 25% · config 20% · recency 20%. Top-matched comps best support the ARV.
Projected returns pro-forma
-3.0% appreciation · 2.63% rent growth · sell at horizon
- IRR
- -10.9%
- Equity multiple
- 0.60×
- Total profit
- $-15,476
- Equity at exit
- $20,860
- IRR
- -2.1%
- Equity multiple
- 0.86×
- Total profit
- $-5,553
- Equity at exit
- $12,096
Cash invested: $39,172 (down + closing). Projections, not guarantees.
Landlord ↔ Tenant lean methodology
- Overall (STATE)
- 90 Strongly Landlord-Friendly
- State Indiana
- 90 Strongly Landlord-Friendly · R+11
- County
- — inherits STATE
- City
- — inherits STATE
ZIP-level market 46219
- Rents YoY
- 2.6%
- Active inventory
- 143
- Price-to-rent
- 8.1×
Monthly cashflow live
- Estimated rent
- $1,444 high interval (Pro) →
- Mortgage (P&I)
- −$734
- Tax from tax record
- −$228 /mo · $2,742/yr
- Insurance
- −$58
- HOA
- −$0
- Vacancy / Maint / Mgmt
- −$303
- Net cashflow
- $120
Break-even live
Sensitivity live
| Price | -10% $200 | -5% $160 | +0% $120 | +5% $81 | +10% $41 |
|---|---|---|---|---|---|
| Rent | -10% $6 | -5% $63 | +0% $120 | +5% $178 | +10% $235 |
| Rate | -1.0pp $191 | -0.5pp $156 | base $120 | +0.5pp $84 | +1.0pp $47 |
UW: 25.0% down · 7.5% · 30yr · 1.5% tax · 5.0% vac · 8.0% maint · 8.0% mgmt
Financing live
Cash to close
- Down payment
- $34,975
- Closing costs
- $4,197
- Reserves months
- —
- Total cash needed
- —
Loan-product check · same deal, 3 products live
Conventional
25% down · 7.5% · 30yr
- Down + closing
- —
- Monthly P&I
- —
- Monthly cashflow
- —
- DSCR
- —
- Eligible?
- —
Personal DTI + credit; lowest rate.
DSCR
20% down · 8.5% · 30yr
- Down + closing
- —
- Monthly P&I
- —
- Monthly cashflow
- —
- DSCR
- —
- Eligible?
- —
No personal income docs; deal must DSCR.
Hard money
10% down · 12.0% · 12mo
- Down + closing
- —
- Monthly P&I
- —
- Monthly cashflow
- —
- DSCR
- —
- Eligible?
- —
Short-term bridge; refi at stabilization.
Rent comps 31 comps
| Address | Beds | Baths | Sqft | Rent | $/sqft | DOM | Units | Dist |
|---|---|---|---|---|---|---|---|---|
| 5010 Brookville Rd Indianapolis, IN | 3.0 | 2.0 | 1656 | $1,350 | $0.82 | 8d | 1 | 0.12mi |
| 4931 Orion Ave Indianapolis, IN | 2.0 | 1.0 | 1200 | $1,450 | $1.21 | 24d | 1 | 0.17mi |
| 117 N Riley Ave Indianapolis, IN | 3.0 | 3.0 | 1664 | $1,600 | $0.96 | 20d | 1 | 0.63mi |
| 739 Temperance Ave Indianapolis, IN | 3.0 | 1.0 | 1136 | $1,350 | $1.19 | 44d | 1 | 0.68mi |
| 4318 Spann Ave Indianapolis, IN | 3.0 | 1.0 | 1411 | $1,200 | $0.85 | 44d | 1 | 0.68mi |
| 306 N Riley Ave Indianapolis, IN | 3.0 | 1.0 | 1320 | $1,095 | $0.83 | 18d | 1 | 0.70mi |
| 25 N Drexel Ave Unit A Indianapolis, IN | 3.0 | 2.0 | 1250 | $1,325 | $1.06 | 44d | 1 | 0.71mi |
| 415 N Dequincy St Indianapolis, IN | 3.0 | 2.0 | 1250 | $1,900 | $1.52 | 15d | 1 | 0.79mi |
| 508 Emerson Ave Indianapolis, IN | 3.0 | 1.5 | 1094 | $1,150 | $1.05 | 15d | 1 | 0.84mi |
| 21 N Colorado Ave Indianapolis, IN | 3.0 | 1.5 | 1520 | $2,000 | $1.32 | 44d | 1 | 0.84mi |
| 5105 E North St Indianapolis, IN | 2.0 | 2.0 | 1180 | $2,250 | $1.91 | 44d | 1 | 0.88mi |
| 606 N Emerson Ave Indianapolis, IN | 2.0 | 1.5 | 1372 | $2,450 | $1.79 | 24d | 1 | 0.89mi |
| 5750 E Washington St Indianapolis, IN | 2.0 | 1.0 | 1186 | $1,100 | $0.93 | 4d | 2 | 0.92mi |
| 338 S Arlington Ave Indianapolis, IN | 2.0 | 2.0 | 1303 | $1,610 | $1.24 | 24d | 1 | 0.94mi |
| 338 S Arlington Ave Apt 204 Indianapolis, IN | 2.0 | 2.0 | 1303 | $1,674 | $1.28 | 15d | 1 | 0.94mi |
| 119 N Grant Ave Indianapolis, IN | 3.0 | 1.0 | 1408 | $1,195 | $0.85 | 44d | 1 | 1.00mi |
| 8 S Bradley Ave Indianapolis, IN | 2.0 | 1.0 | 1300 | $950 | $0.73 | 24d | 1 | 1.09mi |
| 614 N Colorado Ave Indianapolis, IN | 2.0 | 2.0 | 1736 | $1,200 | $0.69 | 24d | 1 | 1.14mi |
| 5015 Reeder St Indianapolis, IN | 3.0 | 2.0 | 1482 | $1,950 | $1.32 | 44d | 1 | 1.14mi |
| 314 N Denny St Indianapolis, IN | 3.0 | 1.0 | 1184 | $975 | $0.82 | 24d | 1 | 1.16mi |
| 33 N Sherman Dr Unit 33 Indianapolis, IN | 3.0 | 1.5 | 1288 | $1,500 | $1.16 | 8d | 1 | 1.17mi |
| 642 N Colorado Ave Indianapolis, IN | 3.0 | 2.0 | 1572 | $1,450 | $0.92 | 44d | 1 | 1.17mi |
| 405 S Sheridan Ave Indianapolis, IN | 2.0 | 1.0 | 1700 | $1,350 | $0.79 | 18d | 1 | 1.19mi |
| 442 N Denny St Indianapolis, IN | 3.0 | 1.0 | 1140 | $1,045 | $0.92 | 24d | 1 | 1.25mi |
| 801 N Gladstone Ave Indianapolis, IN | 3.0 | 1.5 | 1776 | $1,225 | $0.69 | 44d | 1 | 1.25mi |
| 3712 E Market St Indianapolis, IN | 3.0 | 1.0 | 1800 | $1,450 | $0.81 | 15d | 1 | 1.27mi |
| 4703 E Minnesota St Indianapolis, IN | 4.0 | 1.5 | 1588 | $1,695 | $1.07 | 44d | 1 | 1.29mi |
| 447 N Sherman Dr Indianapolis, IN | 3.0 | 1.5 | 1312 | $1,195 | $0.91 | 44d | 1 | 1.33mi |
| 603 N Sherman Dr Indianapolis, IN | 3.0 | 1.0 | 1250 | $1,300 | $1.04 | 44d | 1 | 1.37mi |
| 822 N Bradley Ave Unit 822 Indianapolis, IN | 3.0 | 1.0 | 1100 | $1,200 | $1.09 | 44d | 1 | 1.47mi |
| 49 S Lasalle St Unit 1540092P Indianapolis, IN | 3.0 | 2.0 | 1991 | $3,053 | $1.53 | 4d | 1 | 1.48mi |
Listing history 37 events
-
2026-06-21days on market $139,900 Active 58 DOM
-
2026-06-18days on market $139,900 Active 55 DOM
-
2026-06-17days on market $139,900 Active 54 DOM
-
2026-06-16days on market $139,900 Active 53 DOM
-
2026-06-15days on market $139,900 Active 52 DOM
-
2026-06-13days on market $139,900 Active 50 DOM
-
2026-06-13days on market $139,900 Active 49 DOM
-
2026-06-09days on market $139,900 Active 46 DOM
-
2026-06-08days on market $139,900 Active 45 DOM
-
2026-06-07days on market $139,900 Active 44 DOM
-
2026-06-03days on market $139,900 Active 40 DOM
-
2026-06-02days on market $139,900 Active 39 DOM
-
2026-06-01days on market $139,900 Active 38 DOM
-
2026-05-31price $139,900 Active 37 DOM
-
2026-05-31days on market $144,900 Active 37 DOM
-
2026-04-24$144,900 Active 688-char remark
-
2022-10-05soldstatus $86,000
-
2022-09-29soldstatus $86,000 Closed
-
2022-09-09historical
-
2022-09-08$86,000
-
2022-03-10status Active
-
2022-03-09historical
-
2022-02-12status Pending
-
2022-02-12status Active
-
2022-01-31status Active
-
2021-12-07status Pending
-
2021-12-05$110,000 Active
-
2018-07-16status Pending
-
2018-05-25$1,100,000 Active
-
2012-01-13historical
-
2011-07-12$32,000
-
2008-05-09soldstatus $13,500
-
2007-12-31$15,000
-
2003-01-03soldstatus $24,500
-
2002-07-19$26,500
-
2002-02-28historical
-
2001-08-27$40,000
ⓘ Source: listings_history table (triggers on properties + properties_extension) + one-shot
backfill from property_details.listing_events for pre-trigger history.
Tax reassessment forecast IN · Partial reset (capped growth)
- Current annual tax
- $2,742 · $228/mo
- Projected year-2 tax
- $2,742 · $228/mo
- Expected delta
- $0/yr ($0/mo · 0.0%)
ⓘ Screening estimate from a state-policy table — verify with the county assessor before closing.
Climate risk First Street
- Flood 1/10 Low FEMA zone X (unshaded) · 0% chance over 30 yrs
- Wildfire 1/10 Low
- Heat 3/10 Moderate 7 d/yr ≥102°F today · 19 d/yr by 30 yrs out
- Wind 2/10 Low 100% chance of damaging wind over 30 yrs
- Air quality 4/10 Moderate 5 unhealthy d/yr today · 7 by 30 yrs out
Nearby sold comps map
Loading sold comps map…
Walkable amenities ~0.75 mi
Loading nearby amenities…
Taxation est. · year 1
- Rental income
- $17,331
- − Mortgage interest
- −$7,837
- − Property taxes
- −$2,742
- − Insurance
- −$700
- − Repairs & maintenance
- −$1,386
- − Management
- −$1,386
- − Depreciation
- −$4,070
- Taxable loss
- −$790
- Est. tax savings @ 24.0%
- +$190
- After-tax cash flow
- $1,636/yr
For passive investors: Depreciation is non-cash, so a rental often shows a tax loss while cash-flowing — sheltering income. Rental losses are passive: they offset passive income freely, and up to $25,000/yr can offset ordinary (W-2) income if you actively participate and your MAGI is under $100k (phasing out to $0 by $150k); unused losses carry forward. On sale, claimed depreciation is recaptured at up to 25%, and gains may owe capital-gains tax (a 1031 exchange can defer both). Figures are a year-1 estimate at your 24.0% rate — not tax advice; consult a CPA.
Schools (NCES district)
- District
- Indianapolis Public Schools
- NCES district ID
- 1804770
- Math proficiency
- 14% ▼ -7.00%
- Reading proficiency
- 20% ▼ -3.00%
- Median HH income
- $32,034
- Composite
- 13.69/100
- National rank
- #9499
- State rank
- #286 of 301 in IN
Livability — Indianapolis city (balance)
No livability data for this city. (Only ~50 U.S. cities are tracked.)
Census & demographics
- Census place
- Indianapolis city (balance), IN
- County
- Marion County · 998,460 people
- City population
- 881,119
- Metro
- Indianapolis-Carmel-Anderson, IN
- Population (ZIP)
- 38,855
- Household income
- $60,803
- Rent vs Own
- Severe rent burden
- 2191.0
Population outlook (Marion County) Hauer SSP2
- Today (2025)
- 1,025,572 people
- By 2030
- 1,065,727 · +3.9%
- By 2040
- 1,141,577 · +11.3%
- By 2050
- 1,208,920 · +17.9%
- By 2075
- 1,367,288 · +33.3%
- By 2100
- 1,438,201 · +40.2%
Race, ethnicity, and origin ACS 2023
- Neighborhood character
- Diverse neighborhood (Simpson 0.63)
- Race & ethnicity
- White 54% Black 22% Hispanic / Latino 18% Two or more races 9%
- Hispanic origin (detail)
- Mexican 10% Puerto Rican 1%
- Common ancestry
- Slovak 2% Romanian 2% Lithuanian 2%
- Foreign-born
- 10% · Canada
- Languages at home
- 85% English-only · Spanish 14%
Political lean MEDSL · Marion
- 2024 margin
- Strong D (+27.7) · D 63.0% · R 35.3% · Other 1.7%
- 2008→2024 swing
- -0.7pp no change · 2008: 28.4pp · 2024: 27.7pp
- All cycles
- 2024: D+27.7 2020: D+29.1 2016: D+22.8 2012: D+22.2 2008: D+28.4
Not yet ingested
- Civics
- —
Market trends
- HPI YoY
- ▼ -199.69%
- Current HPI
- 289.8788
- Rent YoY
- ▲ 2.63%
- Metro
- Indianapolis-Carmel-Anderson, IN
- State GDP YoY
- ▲ 2.90%
- F500 in state
- 18
Industry mix (Fortune 500 HQ in IN)
| Industry | F500 HQs | Revenue |
|---|---|---|
| Industrial Machinery | 2 | $37B |
|
||
| Healthcare | 1 | $177B |
|
||
| Pharmaceuticals | 1 | $45B |
|
||
| Metals / Steel | 1 | $18B |
|
||
| Agriculture | 1 | $17B |
|
||
| Packaging | 1 | $12B |
|
||
Price history
+249.8% since first listed23 events — show timeline
- 2026-05-31 Price Changed $139,900 MIBOR as Distributed by MLS Grid
- 2026-04-24 Listed $144,900 MIBOR as Distributed by MLS Grid
- 2022-10-05 Sold (Public Records) $86,000 Public Records
- 2022-09-29 Sold (MLS) $86,000 MIBOR as Distributed by MLS Grid
- 2022-09-09 Listing Removed — MIBOR as Distributed by MLS Grid
- 2022-09-08 Listed $86,000 MIBOR as Distributed by MLS Grid
- 2022-03-10 Relisted — MIBOR as Distributed by MLS Grid
- 2022-03-09 Listing Removed — MIBOR as Distributed by MLS Grid
- 2022-02-12 Pending — MIBOR as Distributed by MLS Grid
- 2022-02-12 Relisted — MIBOR as Distributed by MLS Grid
- 2022-01-31 Relisted — MIBOR as Distributed by MLS Grid
- 2021-12-07 Pending — MIBOR as Distributed by MLS Grid
- 2021-12-05 Listed $110,000 MIBOR as Distributed by MLS Grid
- 2018-07-16 Pending — MIBOR as Distributed by MLS Grid
- 2018-05-25 Listed $1,100,000 MIBOR as Distributed by MLS Grid
- 2012-01-13 Listing Removed — MIBOR as Distributed by MLS Grid
- 2011-07-12 Listed $32,000 MIBOR as Distributed by MLS Grid
- 2008-05-09 Sold (MLS) $13,500 MIBOR as Distributed by MLS Grid
- 2007-12-31 Listed $15,000 MIBOR as Distributed by MLS Grid
- 2003-01-03 Sold (MLS) $24,500 MIBOR as Distributed by MLS Grid
- 2002-07-19 Listed $26,500 MIBOR as Distributed by MLS Grid
- 2002-02-28 Listing Removed — MIBOR as Distributed by MLS Grid
- 2001-08-27 Listed $40,000 MIBOR as Distributed by MLS Grid
Property tax history
+11.1%/yrLatest (2025): $2,742 · +28.3% YoY. Source: county tax records.
Cash-flow waterfall
monthlySold comps — $/sqft
last 12 mo · ≤1 miLoading sold comps…