 Fourplex
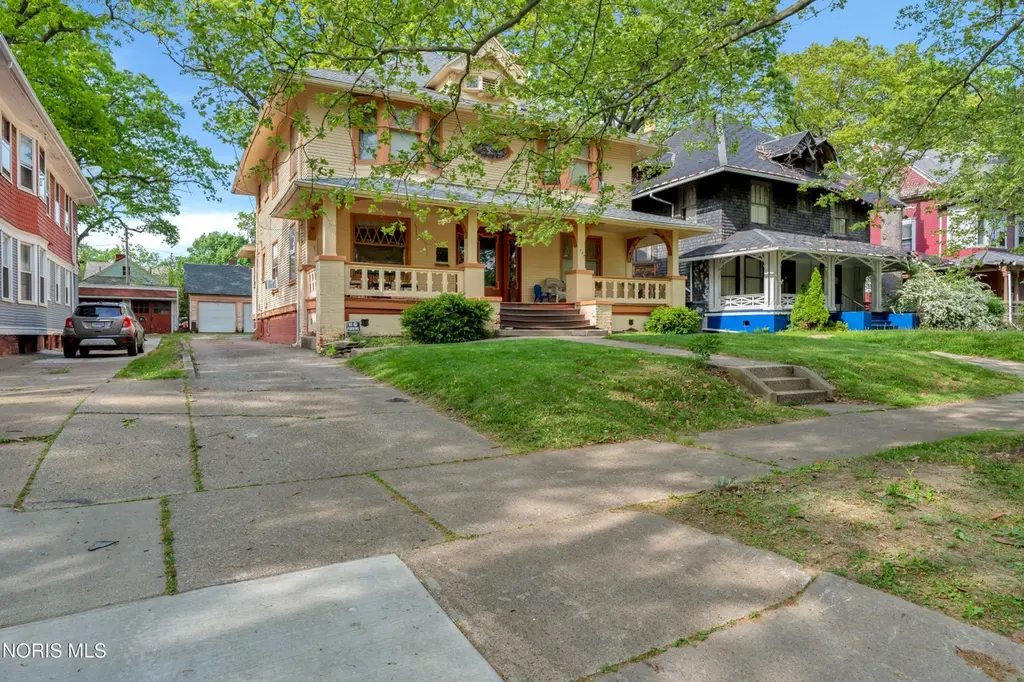
338 Kenilworth Ave · Toledo, OH
Flood risk 1/10 · Minimal
- FEMA flood zone
- X (unshaded)
- Chance of flooding over 30 yrs
- 0.0%
- Est. flood insurance / yr
- $507 – $1,088
Fire risk 1/10 · Minimal
- Est. fire insurance / yr
- $713 – $1,323
Heat risk 3/10 · Minor
- Hot days now (above 100°F)
- 7 days/yr
- Hot days in 30 yrs
- 16 days/yr
Wind risk 2/10 · Minimal
- Chance of severe wind over 30 yrs
- —
Air-quality risk 2/10 · Minimal
- Unhealthy air days now
- 1 days/yr
- Unhealthy air days in 30 yrs
- 3 days/yr
Risk factors via First Street. Map © Google.
Why this score? — see what drove the B grade
The composite is a weighted blend of 9 inputs, each scored 0–100. Each bar is that input's sub-score; the figure is the points it added to the 100-point composite (weight × sub-score).
- Cash flow +30.0/30.0
- 1% rule +10.0/10.0
- DSCR +10.0/10.0
- ARV discount +7.5/15.0
- Appreciation +7.3/10.0
- Livability +3.3/5.0
- Rent growth +2.5/5.0
- Condition / age +2.5/5.0
- Schools +1.6/10.0
$169,900
🖨 Deal sheet 📄 Offer letter ✓ Due diligence
Multi-family units
County records classify this as Multi-Family (5+ Unit). Listing-text estimate: 4 units. estimate disagrees with records
5+ unit building — per-unit beds/baths from public records are typically unavailable; the breakdown below (if shown) is an estimate from the listing text.
Listing remarks MLS
LENDER OWNED-SOLD AS IS-ADDENDUM REQUIRED WITH OFFER - OWNER MAKES NO REPRESENTATION AS TO UTILITY SERVICES - OWNER WILL MAKE NO REPAIRS.
Key facts
- 8,202 sq ft lot
- 4 garage spots
- Built 1897
Property features AI
Finance
- Financial info: Residential income property with 4 total units (3 leased, 1 vacant); Tenant pays electricity; owner pays gas, sewer, water, insurance, and taxes
- HOA & community: Cats allowed
Exterior
- Parking: Detached garage; Concrete driveway; Total parking for 8 vehicles; 4 garage spaces
- Utilities: Electricity connected; Natural gas connected; Public sewer; Public water
- Home design: Residential income property (quadruplex); Two-and-a-half level structure; Two stories total
- Construction: Brick and wood siding construction; Block foundation; Full unfinished block basement
- Exterior features: Asphalt roof; Level lot
Interior
- Kitchen: Electric oven; Electric range; Refrigerator
- Flooring: Hardwood
- Heating & cooling: Electric heating; Boiler heating; Window unit cooling
- Interior features: Other
- Laundry & utility: Laundry in basement
Neighborhood map
What this means for you Summary
Snapshot
- This is a 4 × 4-bed/4.0-bath units multifamily listed at $170k.
Deal economics
- At list price, monthly cash flow is $3k ($31k/yr) — positive. Per door: $637/mo.
- The deal already cash-flows at list — no discount required.
- Meets the 1% rule at list price ($5k rent vs $170k).
- Recommended offer: $167k (1.5% below list) — sets the bar for market timing.
- Cap rate 24.3% vs local median 7.6% in Toledo — top-decile yield for the area; either an underpriced asset or a hidden risk that comps aren't pricing in. Stress-test before assuming the spread holds.
Location & tenants
- Location reads 66/100 on livability (#645 in OH) — a middle-class / working-renter tenant base. Strengths: cost of living A+, housing A+, health & safety A+; Watch: amenities C-, crime F, commute F.
- Toledo City (urban): math 15% / reading 24% proficiency, ranked #634 of 656 in OH (top 97%) — low school quality limits family demand, transient renter base, plan for 1-2y turnover; 72% free/reduced lunch — lower-income household profile, screen leases tightly.
- Zoned schools: Rosa Parks Elementary School (math 2% / reading 8%, grade F, #1,554 of 1,584 statewide, top 100%, 263 students, 0% FRL); Jesup W. Scott High School (math 8% / reading 17%, grade F, #726 of 781 statewide, top 94%, 736 students, 0% FRL) — zoned schools average 0% FRL vs 72% district-wide (72 pts lower); this property's tenant base skews higher-income than the district average.
- Market conditions: 30 active listings in the ZIP; lower-income renter base — watch delinquency; 415 units permitted in Lucas County in 2024 (122 in 5+ unit buildings).
Forward outlook
- In year one you build about $9k of equity ($1k loan paydown + $8k appreciation (4.7% local appreciation)).
- Lucas County population projected at -16% by 2050 — secular population decline; favor cash flow + early exit over multi-decade hold.
- At projected returns (4.7% appreciation + 3.0% rent growth), your $48k cash investment doubles in ~2 years — after that, you're playing with house money.
- By year 4, paydown + projected appreciation supports a ~$31k cash-out refi (75% LTV) — recoverable capital for the next deal without selling this one.
Negotiation context
- It's been on market 22 days — a 2% lower offer ($167k) is reasonable based on typical stale-listing flexibility.
- 5 sale attempts since 28y ago with the ask held roughly flat each time — persistent listings suggest the price (not the market) is what's stuck; bring a comps-based counter.
- Current owner paid $121k; 40% above their basis — modest negotiation headroom, anchor on the comps not their cost.
Risks & watch-outs
- Watch-outs: built in 1897 — expect roof / HVAC / electrical / plumbing capex.
Questions for the listing agent
- Can we see the unit-by-unit rent roll, current vacancy, and any below-market leases? What's the average tenancy length?
- What capital expenditures (roof, boiler, parking lot, exteriors) have been made in the last 5 years, and what's planned in the next 2?
- Built in 1897 — when were the roof, HVAC, electrical panel, plumbing, and water heater last replaced?
- Is there a deadline driving the sale (1031 exchange, divorce, estate, relocation)? That informs how much negotiation room exists.
- Schools are D-rated, which usually means shorter tenancies and higher turnover. Who's the typical renter profile here, and what's been the actual vacancy rate?
- Crime grade is F in this area — have there been break-ins, vandalism, or insurance claims at this property in the last 3 years? What carrier currently insures it and at what premium?
- What's the average days-on-market for RENTAL listings here right now (not sales)? A rising rental-DOM trend means longer vacancies and softer asking-rent achievability than the comps imply.
- What's the recent tenant-quality profile in this submarket — average credit score on applications, eviction rate, late-payment / NSF rate, and stable-employment percentage? A property-management company in the area should have these aggregated.
- How much new apartment / multifamily construction is in the pipeline within 1–3 miles? Heavy new supply (>2% of stock underway) typically softens rents 12–24 months out; light construction supports rent growth.
Investment metrics
- 1% rule
- 2.69% ✓
- Cap rate
- 24.30%
- Cash-on-cash
- 64.31%
- DSCR
- 3.86
- GRM
- 3.1
CMA / ARV
No comps found within radius.
Projected returns pro-forma
4.65% appreciation · 3.0% rent growth · sell at horizon
- IRR
- 70.7%
- Equity multiple
- 5.16×
- Total profit
- $198,135
- Equity at exit
- $92,660
- IRR
- 68.9%
- Equity multiple
- 10.68×
- Total profit
- $460,281
- Equity at exit
- $157,001
Cash invested: $47,572 (down + closing). Projections, not guarantees.
Landlord ↔ Tenant lean methodology
- Overall (STATE)
- 73 Landlord-Friendly
- State Ohio
- 73 Landlord-Friendly · R+6
- County
- — inherits STATE
- City
- — inherits STATE
ZIP-level market 43610
- Home prices YoY
- 3.8%
- Active inventory
- 30
- Price-to-rent
- 12.4×
Monthly cashflow live
- Estimated rent
- $4,569 high interval (Pro) →
- Mortgage (P&I)
- −$891
- Tax from tax record
- −$98 /mo · $1,179/yr
- Insurance
- −$71
- HOA
- −$0
- Vacancy / Maint / Mgmt
- −$959
- Net cashflow
- $2,550
Break-even live
4-unit breakdown (identical units grouped — click to expand)
| Units | Beds | Baths | Est. rent |
|---|---|---|---|
| 4× units | 4 | 4 | $4,568 |
| #1 | 4 | 4 | $1,142 |
| #2 | 4 | 4 | $1,142 |
| #3 | 4 | 4 | $1,142 |
| #4 | 4 | 4 | $1,142 |
| Total (4 units) | $4,569 | ||
UW: 25.0% down · 7.5% · 30yr · 1.5% tax · 5.0% vac · 8.0% maint · 8.0% mgmt
Financing live
Cash to close
- Down payment
- $42,475
- Closing costs
- $5,097
- Reserves months
- —
- Total cash needed
- —
Loan-product check · same deal, 3 products live
Conventional
25% down · 7.5% · 30yr
- Down + closing
- —
- Monthly P&I
- —
- Monthly cashflow
- —
- DSCR
- —
- Eligible?
- —
Personal DTI + credit; lowest rate.
DSCR
20% down · 8.5% · 30yr
- Down + closing
- —
- Monthly P&I
- —
- Monthly cashflow
- —
- DSCR
- —
- Eligible?
- —
No personal income docs; deal must DSCR.
Hard money
10% down · 12.0% · 12mo
- Down + closing
- —
- Monthly P&I
- —
- Monthly cashflow
- —
- DSCR
- —
- Eligible?
- —
Short-term bridge; refi at stabilization.
Listing history 17 events
-
2026-04-24status Pending
-
2026-04-15status Active
-
2026-04-08historical Contingent
-
2026-04-02$169,900 Active
-
2026-03-30historical $169,900
-
2025-10-14price $45,000 137-char remark
Show marketing remark (137 chars)
LENDER OWNED-SOLD AS IS-ADDENDUM REQUIRED WITH OFFER - OWNER MAKES NO REPRESENTATION AS TO UTILITY SERVICES - OWNER WILL MAKE NO REPAIRS.
-
2023-08-21soldstatus $121,000
-
2023-07-24soldstatus $121,000 Closed
-
2023-05-26status Pending
-
2023-05-26price $121,000
-
2023-05-19$120,000 Active
-
2004-09-28soldstatus $56,300
-
2004-06-11soldstatus $45,000 137-char remark
Show marketing remark (137 chars)
LENDER OWNED-SOLD AS IS-ADDENDUM REQUIRED WITH OFFER - OWNER MAKES NO REPRESENTATION AS TO UTILITY SERVICES - OWNER WILL MAKE NO REPAIRS.
-
2004-04-14$45,500 137-char remark
Show marketing remark (137 chars)
LENDER OWNED-SOLD AS IS-ADDENDUM REQUIRED WITH OFFER - OWNER MAKES NO REPRESENTATION AS TO UTILITY SERVICES - OWNER WILL MAKE NO REPAIRS.
-
2000-01-31historical
-
1998-09-02$81,900
-
1995-09-01soldstatus $36,000
ⓘ Source: listings_history table (triggers on properties + properties_extension) + one-shot
backfill from property_details.listing_events for pre-trigger history.
Tax reassessment forecast OH · Partial reset (capped growth)
- Current annual tax
- $1,179 · $98/mo
- Projected year-2 tax
- $1,915 · $160/mo
- Expected delta
- +$736/yr (+$61/mo · 62.4%)
ⓘ Screening estimate from a state-policy table — verify with the county assessor before closing.
Climate risk First Street
- Flood 1/10 Low FEMA zone X (unshaded) · 0% chance over 30 yrs
- Wildfire 1/10 Low
- Heat 3/10 Moderate 7 d/yr ≥100°F today · 16 d/yr by 30 yrs out
- Wind 2/10 Low
- Air quality 2/10 Low 1 unhealthy d/yr today · 3 by 30 yrs out
Nearby sold comps map
Loading sold comps map…
Walkable amenities ~0.75 mi
Loading nearby amenities…
Taxation est. · year 1
- Rental income
- $54,828
- − Mortgage interest
- −$9,517
- − Property taxes
- −$1,179
- − Insurance
- −$850
- − Repairs & maintenance
- −$4,386
- − Management
- −$4,386
- − Depreciation
- −$4,943
- Taxable income
- $29,568
- Est. tax owed @ 24.0%
- −$7,096
- After-tax cash flow
- $23,498/yr
For passive investors: Depreciation is non-cash, so a rental often shows a tax loss while cash-flowing — sheltering income. Rental losses are passive: they offset passive income freely, and up to $25,000/yr can offset ordinary (W-2) income if you actively participate and your MAGI is under $100k (phasing out to $0 by $150k); unused losses carry forward. On sale, claimed depreciation is recaptured at up to 25%, and gains may owe capital-gains tax (a 1031 exchange can defer both). Figures are a year-1 estimate at your 24.0% rate — not tax advice; consult a CPA.
Schools (NCES district)
- District
- Toledo City
- NCES district ID
- 3904490
- Math proficiency
- 15% ▼ -16.00%
- Reading proficiency
- 24% ▼ -13.00%
- Median HH income
- $32,137
- Composite
- 15.76/100
- National rank
- #9276
- State rank
- #634 of 656 in OH
Livability — Toledo
- Score
- 66/100
- State rank
- #645
- US rank
- #11442
Category grades
Schools grade is shown separately in the Schools card above.
Census & demographics
- Census place
- Toledo, OH
- County
- Lucas · 437,818 people
- City population
- 280,811
- Metro
- Toledo, OH
- Population (ZIP)
- 4,057
- Household income
- $38,369
- Rent vs Own
- Severe rent burden
- 15.7
Population outlook (Lucas County) Hauer SSP2
- Today (2025)
- 420,751 people
- By 2030
- 410,187 · -2.5%
- By 2040
- 384,019 · -8.7%
- By 2050
- 355,125 · -15.6%
- By 2075
- 291,683 · -30.7%
- By 2100
- 233,670 · -44.5%
Race, ethnicity, and origin ACS 2023
- Neighborhood character
- Majority Black (64%)
- Race & ethnicity
- Black 64% White 29% Hispanic / Latino 4% Two or more races 4%
- Common ancestry
- Romanian 5% Iranian 3% Slovak 1%
- Foreign-born
- 1% · Canada
- Languages at home
- 98% English-only · Spanish 2%
Political lean MEDSL · Lucas
- 2024 margin
- D (+12.6) · D 55.8% · R 43.2%
- 2008→2024 swing
- -18.9pp toward R · 2008: 31.4pp · 2024: 12.6pp
- All cycles
- 2024: D+12.6 2020: D+16.8 2016: D+17.4 2012: D+30.4 2008: D+31.4
Not yet ingested
- Civics
- —
Market trends
- HPI YoY
- ▲ 4.65%
- Current HPI
- 126.1457
- Rent YoY
- —
- Metro
- —
- State GDP YoY
- ▲ 1.98%
- F500 in state
- 48
Industry mix (Fortune 500 HQ in OH)
| Industry | F500 HQs | Revenue |
|---|---|---|
| Insurance | 3 | $145B |
|
||
| Industrial Machinery | 3 | $49B |
|
||
| Financial Services | 3 | $24B |
|
||
| Consumer Goods | 2 | $93B |
|
||
| Aerospace / Defense | 2 | $47B |
|
||
| Utilities | 2 | $33B |
|
||
Price history
+371.9% since first listed17 events — show timeline
- 2026-04-24 Pending — NORIS
- 2026-04-15 Relisted — NORIS
- 2026-04-08 Contingent — NORIS
- 2026-04-02 Listed $169,900 NORIS
- 2026-03-30 Coming Soon $169,900 NORIS
- 2025-10-14 Price Changed $45,000 NORIS
- 2023-08-21 Sold (Public Records) $121,000 Public Records
- 2023-07-24 Sold (MLS) $121,000 NORIS
- 2023-05-26 Pending — NORIS
- 2023-05-26 Price Changed $121,000 NORIS
- 2023-05-19 Listed $120,000 NORIS
- 2004-09-28 Sold (Public Records) $56,300 Public Records
- 2004-06-11 Sold (MLS) $45,000 NORIS
- 2004-04-14 Listed $45,500 NORIS
- 2000-01-31 Listing Removed — NORIS
- 1998-09-02 Listed $81,900 NORIS
- 1995-09-01 Sold (Public Records) $36,000 Public Records
Property tax history
-1.5%/yrLatest (2025): $1,179 · +4.7% YoY. Source: county tax records.
Cash-flow waterfall
monthlySold comps — $/sqft
last 12 mo · ≤1 miLoading sold comps…