815 Thicket Trl · Granbury, TX
Flood risk No data
- FEMA flood zone
- —
- Chance of flooding over 30 yrs
- —
- Est. flood insurance / yr
- —
Fire risk No data
- Est. fire insurance / yr
- —
Heat risk No data
- Hot days now (above threshold)
- —
- Hot days in 30 yrs
- —
Wind risk No data
- Chance of severe wind over 30 yrs
- —
Air-quality risk No data
- Unhealthy air days now
- —
- Unhealthy air days in 30 yrs
- —
Risk factors via First Street. Map © Google.
Why this score? — see what drove the C+ grade
The composite is a weighted blend of 9 inputs, each scored 0–100. Each bar is that input's sub-score; the figure is the points it added to the 100-point composite (weight × sub-score).
- Cash flow +24.9/30.0
- ARV discount +9.0/15.0
- DSCR +8.1/10.0
- 1% rule +6.3/10.0
- Schools +4.0/10.0
- Livability +3.3/5.0
- Rent growth +2.8/5.0
- Condition / age +2.5/5.0
- Appreciation +0.0/10.0
$175,900
🖨 Deal sheet (PDF) 📄 Offer letter ✓ Due diligence
Listing remarks MLS
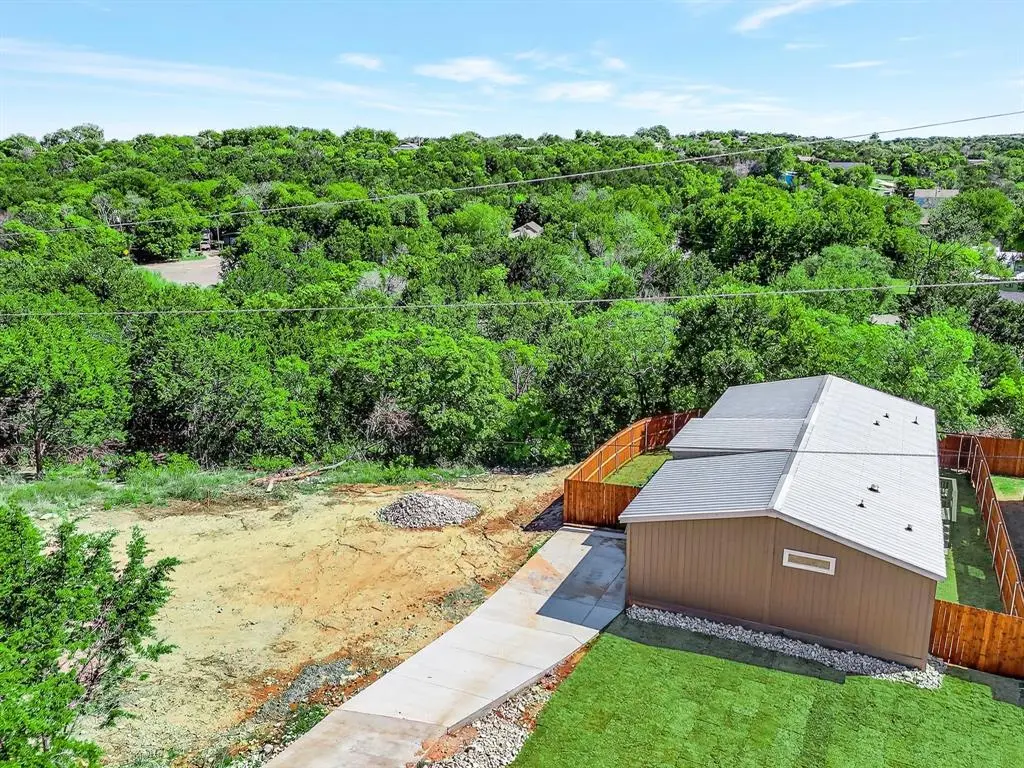
Includes Septic Design Done for a 3 bedroom 14x72 Single wide manufactured home. Lot has been cleared and surveyed, Lot size is 7,419 SQ.FT. Water and Electric at street. This lot in Comanche Cove allows single wide manufactured homes with a min 800 SQ.FT. Design is for a 14x72 Home with a 12x12 deck 6' walkway and a concrete driveway.
Key facts
- Concrete driveway
- 7,841 sq ft lot
- Community pool
Tags
Property features AI
Finance
- Other: Seller is a builder (special listing condition); Property intended for residential/single-family manufactured home use
- Financial info: Listing accepts Cash, Conventional, and VA loan terms; Loan type: Treat As Clear
- HOA & community: Mandatory association (Comanche Cove Property Owners Association); Annual association fee of $95 covering full use of facilities and maintenance of structures; Community amenities include clubhouse, community pool, lake access, park, and playground
Exterior
- Parking: Driveway parking; Concrete parking surfaces; No covered, carport, or garage spaces
- Security: Smoke detector(s)
- Utilities: Aerobic septic; Co-op water; Co-op electric; Electricity connected; Cable available; Individual water meter; Asphalt access; Outside city limits
- Home design: Manufactured home (attached); One story; Year built 2024; Facing direction not specified; Located in Comanche Cove subdivision; Waterfront: Granbury (nearby waterbody)
- Construction: Siding exterior; Pillar/post/pier foundation; Composition shingle roof
- Exterior features: Wood fencing; Deck; Front porch; Rear porch; Hilly, sloped lot with many trees; Large backyard with grass; Interior lot in a subdivision; Utilities easement
Interior
- Kitchen: Dishwasher; Electric range; Microwave; Refrigerator; Water line to refrigerator; Breakfast bar; Solid surface (non-natural) countertops; Built-in cabinets
- Bedrooms: 4 bedrooms (all on main level); Primary bedroom with ensuite bath and walk-in closet; Other bedrooms feature split-bedroom layout and walk-in closets
- Flooring: Laminate flooring
- Bathrooms: 2 full bathrooms; Primary bathroom with dual sinks, separate shower, built-in cabinets, and solid surface countertops
- Heating & cooling: Central heating (electric); Central air (electric); Ceiling fan(s)
- Interior features: Open floorplan; Eat-in kitchen; Kitchen island; Decorative lighting; Cable TV available; High speed internet available; Window coverings; Walk-in closet(s); Built-in cabinets
- Laundry & utility: Utility room / separate laundry room; Washer hookup; Electric dryer hookup
Neighborhood map
What this means for you Summary
Snapshot
- This is a 4-bed/2.0-bath manufactured listed at $176k.
Deal economics
- At list price, monthly cash flow is $377 ($5k/yr) — positive.
- The deal already cash-flows at list — no discount required.
- Meets the 1% rule at list price ($2k rent vs $176k).
- Recommended offer: $173k (1.5% below list) — sets the bar for market timing.
- Cap rate 8.9% vs local median 3.8% in Granbury — top-decile yield for the area; either an underpriced asset or a hidden risk that comps aren't pricing in. Stress-test before assuming the spread holds.
Location & tenants
- Location reads 66/100 on livability (#628 in TX) — a middle-class / working-renter tenant base. Strengths: cost of living A+, housing A+, health & safety A+; Watch: employment C-, crime D+, schools D.
- Granbury ISD (town): math 46% / reading 46% proficiency, ranked #237 of 826 in TX (top 29%) — families likely to look elsewhere, expect single-tenant / working-renter base with shorter leases.
- Market conditions: Rents rising (+1.1%/yr); 929 active listings in the ZIP; 9 comparable units currently listed for rent nearby; rentals at typical pace (median 25d on market — plan ~3-4 weeks tenant-placement turnaround); 125 units permitted in Hood County in 2024 (0 in 5+ unit buildings).
- This rent runs 34% of the median local income ($70k/yr) — at the standard rent-burdened threshold; future hikes will face affordability resistance.
Forward outlook
- Local home prices are declining (-3.0%/yr); year-one equity from $1k of loan paydown is wiped out by about $5k of value loss. Plan a longer hold.
- Hood County population projected at +29% by 2050 — long-run rental-demand tailwind backs the buy-and-hold thesis.
Negotiation context
- It's been on market 26 days — a 2% lower offer ($173k) is reasonable based on typical stale-listing flexibility.
- 4 sale attempts since 2y ago with the ask held roughly flat each time — persistent listings suggest the price (not the market) is what's stuck; bring a comps-based counter.
Questions for the listing agent
- What does the HOA fee cover, when was the last increase, and are there any pending special assessments or reserve-fund shortfalls?
- Is there a deadline driving the sale (1031 exchange, divorce, estate, relocation)? That informs how much negotiation room exists.
- Schools are D-rated, which usually means shorter tenancies and higher turnover. Who's the typical renter profile here, and what's been the actual vacancy rate?
- Crime grade is D in this area — have there been break-ins, vandalism, or insurance claims at this property in the last 3 years? What carrier currently insures it and at what premium?
- What's the average days-on-market for RENTAL listings here right now (not sales)? A rising rental-DOM trend means longer vacancies and softer asking-rent achievability than the comps imply.
- What's the recent tenant-quality profile in this submarket — average credit score on applications, eviction rate, late-payment / NSF rate, and stable-employment percentage? A property-management company in the area should have these aggregated.
- How much new for-sale + rental construction is in the pipeline within 1–3 miles? Heavy new supply typically softens prices + rents 12–24 months out; constrained supply supports both.
Investment metrics
- 1% rule
- 1.13% ✓
- Cap rate
- 8.86%
- Cash-on-cash
- 9.17%
- DSCR
- 1.41
- GRM
- 7.4
CMA / ARV
- ARV (median comp)
- $181,859
- List price
- $175,900
- Delta
- -3.28%
- Verdict
- FAIR
- Comps
- 3 within 1.0 mi
Show comp detail 8 sales within ~0.75 mi
| Address | Dist | Beds/Ba | Sqft | Sold | Price | $/sf | Match |
|---|---|---|---|---|---|---|---|
| 915 Arkansas River Dr | 0.61mi | 3/2.0 (-1) | 1,493 (+2%) | 4mo | $198,900 | $133 | 59 |
| 1315 Woodmere Trl | 0.38mi | 3/2.0 (-1) | 1,456 (0%) | 22mo | $145,000 | $100 | 59 |
| 2821 Brazos River Dr | 0.25mi | 3/2.0 (-1) | 1,512 (+4%) | 23mo | $149,990 | $99 | 58 |
| 1418 Corona Dr | 0.47mi | 3/2.0 (-1) | 1,364 (-6%) | 11mo | $180,000 | $132 | 54 |
| 2217 Cedarwood Trl | 0.55mi | 3/2.0 (-1) | 1,456 (0%) | 23mo | $188,000 | $129 | 50 |
| 917 Arkansas River Dr | 0.61mi | 3/2.0 (-1) | 1,344 (-8%) | 6mo | $185,900 | $138 | 48 |
| 915 Pecos River Dr | 0.52mi | 3/2.0 (-1) | 1,344 (-8%) | 14mo | $199,000 | $148 | 46 |
| 908 Devils River Dr | 0.53mi | 3/2.0 (-1) | 1,344 (-8%) | 18mo | $194,900 | $145 | 43 |
Match score weights: distance 35% · size 25% · config 20% · recency 20%. Top-matched comps best support the ARV.
Projected returns pro-forma
-3.0% appreciation · 1.1% rent growth · sell at horizon
- IRR
- -4.6%
- Equity multiple
- 0.83×
- Total profit
- $-8,240
- Equity at exit
- $26,227
- IRR
- 2.8%
- Equity multiple
- 1.18×
- Total profit
- $9,020
- Equity at exit
- $15,209
Cash invested: $49,252 (down + closing). Projections, not guarantees.
Landlord ↔ Tenant lean methodology
- Overall (STATE)
- 87 Strongly Landlord-Friendly
- State Texas
- 87 Strongly Landlord-Friendly · R+5
- County
- — inherits STATE
- City
- — inherits STATE
ZIP-level market 76048
- Home prices YoY
- -23.4%
- Rents YoY
- 1.1%
- Active inventory
- 929
- Price-to-rent
- 7.4×
Monthly cashflow live
- Estimated rent
- $1,992 high interval (Pro) →
- Mortgage (P&I)
- −$922
- Tax from tax record
- −$193 /mo · $2,321/yr
- Insurance
- −$73
- HOA
- −$8
- Vacancy / Maint / Mgmt
- −$418
- Net cashflow
- $377
Break-even live
Sensitivity live
| Price | -10% $476 | -5% $426 | +0% $377 | +5% $327 | +10% $277 |
|---|---|---|---|---|---|
| Rent | -10% $219 | -5% $298 | +0% $377 | +5% $455 | +10% $534 |
| Rate | -1.0pp $465 | -0.5pp $421 | base $377 | +0.5pp $331 | +1.0pp $285 |
UW: 25.0% down · 7.5% · 30yr · 1.5% tax · 5.0% vac · 8.0% maint · 8.0% mgmt
Financing live
Cash to close
- Down payment
- $43,975
- Closing costs
- $5,277
- Reserves months
- —
- Total cash needed
- —
Loan-product check · same deal, 3 products live
Conventional
25% down · 7.5% · 30yr
- Down + closing
- —
- Monthly P&I
- —
- Monthly cashflow
- —
- DSCR
- —
- Eligible?
- —
Personal DTI + credit; lowest rate.
DSCR
20% down · 8.5% · 30yr
- Down + closing
- —
- Monthly P&I
- —
- Monthly cashflow
- —
- DSCR
- —
- Eligible?
- —
No personal income docs; deal must DSCR.
Hard money
10% down · 12.0% · 12mo
- Down + closing
- —
- Monthly P&I
- —
- Monthly cashflow
- —
- DSCR
- —
- Eligible?
- —
Short-term bridge; refi at stabilization.
Rent comps 9 comps
| Address | Beds | Baths | Sqft | Rent | $/sqft | DOM | Units | Dist |
|---|---|---|---|---|---|---|---|---|
| 2509 Elk Trl Granbury, TX | 3.0 | 2.0 | 1425 | $1,695 | $1.19 | 44d | 1 | 0.08mi |
| 606 Heritage Trl Granbury, TX | 3.0 | 2.0 | 1415 | $1,875 | $1.33 | 44d | 1 | 0.33mi |
| 408 Heritage Trl Granbury, TX | 3.0 | 2.0 | 1635 | $1,890 | $1.16 | 22d | 1 | 0.46mi |
| 2314 Creekview Dr Granbury, TX | 3.0 | 2.0 | 1294 | $1,850 | $1.43 | 25d | 1 | 0.48mi |
| 2224 Hercules Dr Granbury, TX | 3.0 | 2.0 | 1703 | $2,000 | $1.17 | 25d | 1 | 0.48mi |
| 919 Arkansas River Dr Granbury, TX | 3.0 | 2.0 | 1200 | $1,775 | $1.48 | 13d | 1 | 0.62mi |
| 3505 Brazos River Dr Granbury, TX | 3.0 | 2.0 | 1337 | $1,900 | $1.42 | 44d | 1 | 0.77mi |
| 1414 Lauren Ln Granbury, TX | 3.0 | 2.0 | 1500 | $2,100 | $1.40 | 25d | 1 | 0.94mi |
| 1113 Gifford Dr Granbury, TX | 3.0 | 2.0 | 1248 | $1,749 | $1.40 | 25d | 1 | 1.24mi |
HOA detail
- Monthly dues
- $8 · $96/yr
- Likely covers
- waterelectric
Listing history 20 events
-
2026-05-31days on market $175,900 Active 26 DOM
-
2026-05-05$175,900 Active 1775-char remark
-
2025-06-30price $175,000
-
2025-06-02price $185,000
-
2025-03-25price $189,900
-
2025-03-03price $198,000
-
2025-02-04price $199,000
-
2024-12-26price $205,000
-
2024-12-26$205 Active
-
2024-09-11soldstatus
-
2024-09-05soldstatus Closed
Show marketing remark (339 chars)
Includes Septic Design Done for a 3 bedroom 14x72 Single wide manufactured home. Lot has been cleared and surveyed, Lot size is 7,419 SQ.FT. Water and Electric at street. This lot in Comanche Cove allows single wide manufactured homes with a min 800 SQ.FT. Design is for a 14x72 Home with a 12x12 deck 6' walkway and a concrete driveway.
-
2024-08-27status Pending
Show marketing remark (339 chars)
Includes Septic Design Done for a 3 bedroom 14x72 Single wide manufactured home. Lot has been cleared and surveyed, Lot size is 7,419 SQ.FT. Water and Electric at street. This lot in Comanche Cove allows single wide manufactured homes with a min 800 SQ.FT. Design is for a 14x72 Home with a 12x12 deck 6' walkway and a concrete driveway.
-
2024-08-20historical Active Option Contract
Show marketing remark (339 chars)
Includes Septic Design Done for a 3 bedroom 14x72 Single wide manufactured home. Lot has been cleared and surveyed, Lot size is 7,419 SQ.FT. Water and Electric at street. This lot in Comanche Cove allows single wide manufactured homes with a min 800 SQ.FT. Design is for a 14x72 Home with a 12x12 deck 6' walkway and a concrete driveway.
-
2024-08-15$14,995 Active
Show marketing remark (339 chars)
Includes Septic Design Done for a 3 bedroom 14x72 Single wide manufactured home. Lot has been cleared and surveyed, Lot size is 7,419 SQ.FT. Water and Electric at street. This lot in Comanche Cove allows single wide manufactured homes with a min 800 SQ.FT. Design is for a 14x72 Home with a 12x12 deck 6' walkway and a concrete driveway.
-
2024-05-03soldstatus Closed
-
2024-04-08status Pending
-
2024-04-01price $9,500
-
2024-02-07$15,000 Active
-
2006-02-06soldstatus
-
1984-09-26soldstatus
ⓘ Source: listings_history table (triggers on properties + properties_extension) + one-shot
backfill from property_details.listing_events for pre-trigger history.
Tax reassessment forecast TX · Resets to sale price
- Current annual tax
- $2,321 · $193/mo
- Projected year-2 tax
- $3,219 · $268/mo
- Expected delta
- +$898/yr (+$75/mo · 38.7%)
ⓘ Screening estimate from a state-policy table — verify with the county assessor before closing.
Nearby sold comps map
Loading sold comps map…
Walkable amenities ~0.75 mi
Loading nearby amenities…
Taxation est. · year 1
- Rental income
- $23,905
- − Mortgage interest
- −$9,853
- − Property taxes
- −$2,321
- − Insurance
- −$880
- − Repairs & maintenance
- −$1,912
- − Management
- −$1,912
- − HOA
- −$96
- − Depreciation
- −$5,117
- Taxable income
- $1,813
- Est. tax owed @ 24.0%
- −$435
- After-tax cash flow
- $4,084/yr
For passive investors: Depreciation is non-cash, so a rental often shows a tax loss while cash-flowing — sheltering income. Rental losses are passive: they offset passive income freely, and up to $25,000/yr can offset ordinary (W-2) income if you actively participate and your MAGI is under $100k (phasing out to $0 by $150k); unused losses carry forward. On sale, claimed depreciation is recaptured at up to 25%, and gains may owe capital-gains tax (a 1031 exchange can defer both). Figures are a year-1 estimate at your 24.0% rate — not tax advice; consult a CPA.
Schools (NCES district)
- District
- Granbury ISD
- NCES district ID
- 4821390
- Math proficiency
- 46% ▬ 0.00%
- Reading proficiency
- 46% ▲ 4.00%
- Median HH income
- $55,856
- Composite
- 40.04/100
- National rank
- #3820
- State rank
- #237 of 826 in TX
Livability — Granbury
- Score
- 66/100
- State rank
- #628
- US rank
- #11998
Category grades
Schools grade is shown separately in the Schools card above.
Census & demographics
- County
- Hood County · 58,506 people
- City population
- 58,506
- Metro
- Granbury, TX
- Population (ZIP)
- 27,000
- Household income
- $70,346
- Rent vs Own
- Severe rent burden
- 612.0
Population outlook (Hood County) Hauer SSP2
- Today (2025)
- 63,502 people
- By 2030
- 67,459 · +6.2%
- By 2040
- 74,958 · +18.0%
- By 2050
- 81,922 · +29.0%
- By 2075
- 98,872 · +55.7%
- By 2100
- 107,796 · +69.8%
Race, ethnicity, and origin ACS 2023
- Neighborhood character
- Predominantly White (80%)
- Race & ethnicity
- White 80% Hispanic / Latino 14% Two or more races 11% Black 1%
- Hispanic origin (detail)
- Mexican 13%
- Common ancestry
- Italian 2% Slovak 2% Portuguese 1%
- Foreign-born
- 4% · Canada
- Languages at home
- 89% English-only · Spanish 10%
Political lean MEDSL · Hood
- 2024 margin
- Solid R (+66.0) · D 16.6% · R 82.6%
- 2008→2024 swing
- -11.9pp toward R · 2008: -54.0pp · 2024: -66.0pp
- All cycles
- 2024: R+66.0 2020: R+64.1 2016: R+66.5 2012: R+64.7 2008: R+54.0
Not yet ingested
- Civics
- —
Market trends
- HPI YoY
- ▼ -83.25%
- Current HPI
- 272.2126
- Rent YoY
- ▲ 1.10%
- Metro
- Granbury, TX
- State GDP YoY
- ▲ 3.95%
- F500 in state
- 110
Industry mix (Fortune 500 HQ in TX)
| Industry | F500 HQs | Revenue |
|---|---|---|
| Energy | 16 | $1,198B |
|
||
| Technology | 5 | $198B |
|
||
| Engineering / Construction | 4 | $72B |
|
||
| Energy Services | 3 | $60B |
|
||
| Utilities | 3 | $41B |
|
||
| Healthcare | 2 | $330B |
|
||
Price history
+1072.7% since first listed20 events — show timeline
- 2026-05-31 Listing Removed — NTREIS
- 2026-05-05 Listed $175,900 NTREIS
- 2025-06-30 Price Changed $175,000 NTREIS
- 2025-06-02 Price Changed $185,000 NTREIS
- 2025-03-25 Price Changed $189,900 NTREIS
- 2025-03-03 Price Changed $198,000 NTREIS
- 2025-02-04 Price Changed $199,000 NTREIS
- 2024-12-26 Price Changed $205,000 NTREIS
- 2024-12-26 Listed $205 NTREIS
- 2024-09-11 Sold (Public Records) — Public Records
- 2024-09-05 Sold (MLS) — NTREIS
- 2024-08-27 Pending — NTREIS
- 2024-08-20 Contingent — NTREIS
- 2024-08-15 Listed $14,995 NTREIS
- 2024-05-03 Sold (MLS) — NTREIS
- 2024-04-08 Pending — NTREIS
- 2024-04-01 Price Changed $9,500 NTREIS
- 2024-02-07 Listed $15,000 NTREIS
- 2006-02-06 Sold (Public Records) — Public Records
- 1984-09-26 Sold (Public Records) — Public Records
Property tax history
+37.1%/yrLatest (2025): $2,321 · +1282.8% YoY. Source: county tax records.
Cash-flow waterfall
monthlySold comps — $/sqft
last 12 mo · ≤1 miLoading sold comps…