1240 N Cowan Ave · Lewisville, TX
Flood risk 1/10 · Minimal
- FEMA flood zone
- X (unshaded)
- Chance of flooding over 30 yrs
- 0.0%
- Est. flood insurance / yr
- $507 – $1,088
Fire risk 3/10 · Minor
- Est. fire insurance / yr
- $1,222 – $2,270
Heat risk 7/10 · Major
- Hot days now (above 109°F)
- 7 days/yr
- Hot days in 30 yrs
- 22 days/yr
Wind risk 5/10 · Moderate
- Chance of severe wind over 30 yrs
- 26.0%
Air-quality risk 4/10 · Minor
- Unhealthy air days now
- 4 days/yr
- Unhealthy air days in 30 yrs
- 5 days/yr
Risk factors via First Street. Map © Google.
Why this score? — see what drove the B- grade
The composite is a weighted blend of 9 inputs, each scored 0–100. Each bar is that input's sub-score; the figure is the points it added to the 100-point composite (weight × sub-score).
- Cash flow +30.0/30.0
- 1% rule +10.0/10.0
- DSCR +10.0/10.0
- ARV discount +7.5/15.0
- Schools +4.7/10.0
- Livability +3.5/5.0
- Condition / age +2.5/5.0
- Rent growth +1.7/5.0
- Appreciation +0.0/10.0
$78,000
🖨 Deal sheet (PDF) 📄 Offer letter ✓ Due diligence
Listing remarks
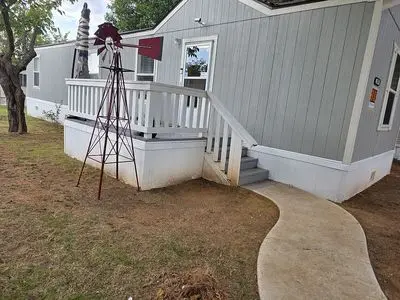
WILL CONSIDER OWNER TO OWNER FINANCING YR: 2020 MAKE: OAKCREEK 2 bedroom/ 2 bath Smoke & amp; pet free home Great condition & amp; maintained home Sits in a great family oriented community here in lewisville tx Or can be moved to your choice of location Nice deck on front & amp; back Only 6 years old New carpet in both bedrooms in 2020 New Flooring in 2020 Shingled roof Matching shed 3 car parking Price: 70,000 Serious inquiries only
Key facts
- New carpet
- Matching shed
- New flooring
Tags
Neighborhood map
What this means for you Summary
Snapshot
- This is a 2-bed/2.0-bath land listed at $78k.
Deal economics
- At list price, monthly cash flow is $542 ($7k/yr) — positive.
- The deal already cash-flows at list — no discount required.
- Meets the 1% rule at list price ($1k rent vs $78k).
- Recommended offer: $77k (1.5% below list) — sets the bar for market timing.
- Cap rate 14.6% vs local median 3.2% in Lewisville — top-decile yield for the area; either an underpriced asset or a hidden risk that comps aren't pricing in. Stress-test before assuming the spread holds.
Location & tenants
- Location reads 69/100 on livability (#440 in TX) — a middle-class / working-renter tenant base. Strengths: housing A+, cost of living A, crime B+; Watch: commute D+, schools D-, amenities F.
- Lewisville ISD (suburban): math 49% / reading 54% proficiency, ranked #109 of 826 in TX (top 13%) — acceptable for families but not a draw, mixed tenant base, ~2y average lease.
- Market conditions: Rents falling (-3.3%/yr); 37 active listings in the ZIP; solid renter incomes; 10,531 units permitted in Denton County in 2024 (2,713 in 5+ unit buildings).
Forward outlook
- Local home prices are declining (-3.0%/yr); year-one equity from $539 of loan paydown is wiped out by about $2k of value loss. Plan a longer hold.
- Denton County population projected at +66% by 2050 — long-run rental-demand tailwind backs the buy-and-hold thesis.
- At projected returns (-3.0% appreciation + 0.0% rent growth), your $22k cash investment doubles in ~5 years — after that, you're playing with house money.
Negotiation context
- It's been on market 26 days — a 2% lower offer ($77k) is reasonable based on typical stale-listing flexibility.
Risks & watch-outs
- Climate carrying-cost: moderate wind risk, 26% chance of damaging wind over 30y; extreme-heat days projected 7→22/yr by 2055 (HVAC capex compounding) — expect insurance premiums to compound above CPI over the hold.
Questions for the listing agent
- Is there a deadline driving the sale (1031 exchange, divorce, estate, relocation)? That informs how much negotiation room exists.
- Schools are D-rated, which usually means shorter tenancies and higher turnover. Who's the typical renter profile here, and what's been the actual vacancy rate?
- What's the average days-on-market for RENTAL listings here right now (not sales)? A rising rental-DOM trend means longer vacancies and softer asking-rent achievability than the comps imply.
- What's the recent tenant-quality profile in this submarket — average credit score on applications, eviction rate, late-payment / NSF rate, and stable-employment percentage? A property-management company in the area should have these aggregated.
- How much new for-sale + rental construction is in the pipeline within 1–3 miles? Heavy new supply typically softens prices + rents 12–24 months out; constrained supply supports both.
Investment metrics
- 1% rule
- 1.75% ✓
- Cap rate
- 14.63%
- Cash-on-cash
- 29.77%
- DSCR
- 2.32
- GRM
- 4.8
CMA / ARV
No comps found within radius.
Projected returns pro-forma
-3.0% appreciation · 0.0% rent growth · sell at horizon
- IRR
- 20.9%
- Equity multiple
- 1.82×
- Total profit
- $17,885
- Equity at exit
- $11,630
- IRR
- 26.9%
- Equity multiple
- 3.04×
- Total profit
- $44,604
- Equity at exit
- $6,744
Cash invested: $21,840 (down + closing). Projections, not guarantees.
Landlord ↔ Tenant lean methodology
- Overall (STATE)
- 87 Strongly Landlord-Friendly
- State Texas
- 87 Strongly Landlord-Friendly · R+5
- County
- — inherits STATE
- City
- — inherits STATE
ZIP-level market 75057
- Home prices YoY
- -19.8%
- Rents YoY
- -3.3%
- Active inventory
- 37
- Price-to-rent
- 4.8×
Monthly cashflow live
- Estimated rent
- $1,368 medium interval (Pro) →
- Mortgage (P&I)
- −$409
- Tax est. 1.5%
- −$98 /mo · $1,170/yr
- Insurance
- −$32
- HOA
- −$0
- Vacancy / Maint / Mgmt
- −$287
- Net cashflow
- $542
Break-even live
Sensitivity live
| Price | -10% $596 | -5% $569 | +0% $542 | +5% $515 | +10% $488 |
|---|---|---|---|---|---|
| Rent | -10% $434 | -5% $488 | +0% $542 | +5% $596 | +10% $650 |
| Rate | -1.0pp $581 | -0.5pp $562 | base $542 | +0.5pp $522 | +1.0pp $501 |
UW: 25.0% down · 7.5% · 30yr · 1.5% tax · 5.0% vac · 8.0% maint · 8.0% mgmt
Financing live
Cash to close
- Down payment
- $19,500
- Closing costs
- $2,340
- Reserves months
- —
- Total cash needed
- —
Loan-product check · same deal, 3 products live
Conventional
25% down · 7.5% · 30yr
- Down + closing
- —
- Monthly P&I
- —
- Monthly cashflow
- —
- DSCR
- —
- Eligible?
- —
Personal DTI + credit; lowest rate.
DSCR
20% down · 8.5% · 30yr
- Down + closing
- —
- Monthly P&I
- —
- Monthly cashflow
- —
- DSCR
- —
- Eligible?
- —
No personal income docs; deal must DSCR.
Hard money
10% down · 12.0% · 12mo
- Down + closing
- —
- Monthly P&I
- —
- Monthly cashflow
- —
- DSCR
- —
- Eligible?
- —
Short-term bridge; refi at stabilization.
Listing history 41 events
-
2026-06-21days on market $78,000 Active 26 DOM
-
2026-06-18days on market $78,000 Active 23 DOM
-
2026-06-17days on market $78,000 Active 22 DOM
-
2026-06-16days on market $78,000 Active 21 DOM
-
2026-06-15days on market $78,000 Active 20 DOM
-
2026-06-13days on market $78,000 Active 18 DOM
-
2026-06-13days on market $78,000 Active 17 DOM
-
2026-06-09days on market $78,000 Active 14 DOM
-
2026-06-08days on market $78,000 Active 13 DOM
-
2026-06-07days on market $78,000 Active 12 DOM
-
2026-06-04days on market $78,000 Active 9 DOM
-
2026-06-03days on market $78,000 Active 8 DOM
-
2026-06-02days on market $78,000 Active 7 DOM
-
2026-06-01days on market $78,000 Active 6 DOM
-
2026-05-31days on market $78,000 Active 5 DOM
-
2026-05-26$78,000 Active
-
2013-04-11soldstatus
-
1997-04-15soldstatus
-
1997-04-15soldstatus
-
1997-04-15soldstatus
-
1997-04-15soldstatus
-
1997-04-15soldstatus
-
1997-04-15soldstatus
-
1997-04-15soldstatus
-
1997-04-15soldstatus
-
1997-04-15soldstatus
-
1997-04-15soldstatus
-
1997-04-15soldstatus
-
1997-04-15soldstatus
-
1997-04-15soldstatus
-
1997-04-15soldstatus
-
1997-04-15soldstatus
-
1997-04-15soldstatus
-
1997-04-15soldstatus
-
1997-04-15soldstatus
-
1997-04-15soldstatus
-
1997-04-15soldstatus
-
1997-04-15soldstatus
-
1997-04-15soldstatus
-
1997-04-15soldstatus
-
1997-04-15soldstatus
ⓘ Source: listings_history table (triggers on properties + properties_extension) + one-shot
backfill from property_details.listing_events for pre-trigger history.
Climate risk First Street
- Flood 1/10 Low FEMA zone X (unshaded) · 0% chance over 30 yrs
- Wildfire 3/10 Moderate
- Heat 7/10 Severe 7 d/yr ≥109°F today · 22 d/yr by 30 yrs out
- Wind 5/10 Major 26% chance of damaging wind over 30 yrs
- Air quality 4/10 Moderate 4 unhealthy d/yr today · 5 by 30 yrs out
Nearby sold comps map
Loading sold comps map…
Walkable amenities ~0.75 mi
Loading nearby amenities…
Taxation est. · year 1
- Rental income
- $16,419
- − Mortgage interest
- −$4,369
- − Property taxes
- −$1,170
- − Insurance
- −$390
- − Repairs & maintenance
- −$1,314
- − Management
- −$1,314
- − Depreciation
- −$2,269
- Taxable income
- $5,594
- Est. tax owed @ 24.0%
- −$1,343
- After-tax cash flow
- $5,160/yr
For passive investors: Depreciation is non-cash, so a rental often shows a tax loss while cash-flowing — sheltering income. Rental losses are passive: they offset passive income freely, and up to $25,000/yr can offset ordinary (W-2) income if you actively participate and your MAGI is under $100k (phasing out to $0 by $150k); unused losses carry forward. On sale, claimed depreciation is recaptured at up to 25%, and gains may owe capital-gains tax (a 1031 exchange can defer both). Figures are a year-1 estimate at your 24.0% rate — not tax advice; consult a CPA.
Schools (NCES district)
- District
- Lewisville ISD
- NCES district ID
- 4827300
- Math proficiency
- 49% ▼ -10.00%
- Reading proficiency
- 54% ▼ -4.00%
- Median HH income
- $82,351
- Composite
- 47.1/100
- National rank
- #2333
- State rank
- #109 of 826 in TX
Livability — Lewisville
- Score
- 69/100
- State rank
- #440
- US rank
- #8991
Category grades
Schools grade is shown separately in the Schools card above.
Census & demographics
- Census place
- Lewisville, TX
- County
- Denton County · 901,654 people
- City population
- 84,871
- Metro
- Dallas-Fort Worth-Arlington, TX
- Population (ZIP)
- 17,958
- Household income
- $82,803
- Rent vs Own
- Severe rent burden
- 975.0
Population outlook (Denton County) Hauer SSP2
- Today (2025)
- 1,053,010 people
- By 2030
- 1,192,269 · +13.2%
- By 2040
- 1,472,920 · +39.9%
- By 2050
- 1,746,506 · +65.9%
- By 2075
- 2,358,497 · +124.0%
- By 2100
- 2,779,183 · +163.9%
Race, ethnicity, and origin ACS 2023
- Neighborhood character
- Diverse neighborhood (Simpson 0.66)
- Race & ethnicity
- Hispanic / Latino 42% White 39% Two or more races 23% Black 11% Asian 3% Native American 2%
- Hispanic origin (detail)
- Mexican 34%
- Common ancestry
- Swedish 1% Slovak 1% Serbian 1%
- Foreign-born
- 17% · Canada, South Korea, Vietnam
- Languages at home
- 62% English-only · Spanish 32% Korean 1% Other Asian/Pacific 1%
Political lean MEDSL · Denton
- 2024 margin
- R (+13.2) · D 42.7% · R 55.8% · Other 1.5%
- 2008→2024 swing
- +11.0pp toward D · 2008: -24.2pp · 2024: -13.2pp
- All cycles
- 2024: R+13.2 2020: R+8.1 2016: R+20.2 2012: R+31.7 2008: R+24.2
Not yet ingested
- Civics
- —
Market trends
- HPI YoY
- ▼ -76.22%
- Current HPI
- 308.1135
- Rent YoY
- ▼ -3.28%
- Metro
- Dallas-Fort Worth-Arlington, TX
- State GDP YoY
- ▲ 3.95%
- F500 in state
- 110
Industry mix (Fortune 500 HQ in TX)
| Industry | F500 HQs | Revenue |
|---|---|---|
| Energy | 16 | $1,198B |
|
||
| Technology | 5 | $198B |
|
||
| Engineering / Construction | 4 | $72B |
|
||
| Energy Services | 3 | $60B |
|
||
| Utilities | 3 | $41B |
|
||
| Healthcare | 2 | $330B |
|
||
Price history
26 events — show timeline
- 2026-05-26 Listed $78,000 FSBO.com
- 2013-04-11 Sold (Public Records) — Public Records
- 1997-04-15 Sold (Public Records) — Public Records
- 1997-04-15 Sold (Public Records) — Public Records
- 1997-04-15 Sold (Public Records) — Public Records
- 1997-04-15 Sold (Public Records) — Public Records
- 1997-04-15 Sold (Public Records) — Public Records
- 1997-04-15 Sold (Public Records) — Public Records
- 1997-04-15 Sold (Public Records) — Public Records
- 1997-04-15 Sold (Public Records) — Public Records
- 1997-04-15 Sold (Public Records) — Public Records
- 1997-04-15 Sold (Public Records) — Public Records
- 1997-04-15 Sold (Public Records) — Public Records
- 1997-04-15 Sold (Public Records) — Public Records
- 1997-04-15 Sold (Public Records) — Public Records
- 1997-04-15 Sold (Public Records) — Public Records
- 1997-04-15 Sold (Public Records) — Public Records
- 1997-04-15 Sold (Public Records) — Public Records
- 1997-04-15 Sold (Public Records) — Public Records
- 1997-04-15 Sold (Public Records) — Public Records
- 1997-04-15 Sold (Public Records) — Public Records
- 1997-04-15 Sold (Public Records) — Public Records
- 1997-04-15 Sold (Public Records) — Public Records
- 1997-04-15 Sold (Public Records) — Public Records
- 1997-04-15 Sold (Public Records) — Public Records
- 1997-04-15 Sold (Public Records) — Public Records
Property tax history
+53.1%/yrLatest (2025): $343,533 · +24.7% YoY. Source: county tax records.
Cash-flow waterfall
monthlySold comps — $/sqft
last 12 mo · ≤1 miLoading sold comps…