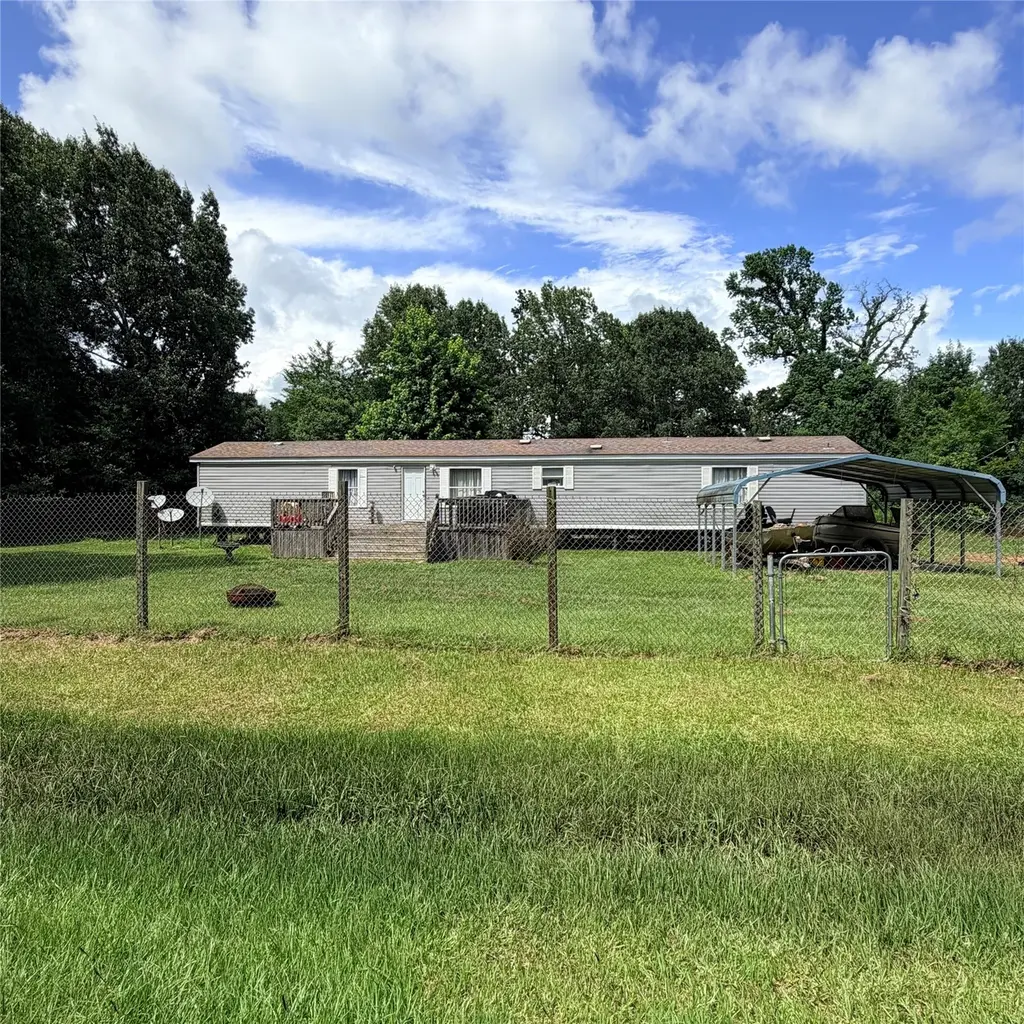
270 Fitzgerald Ln · West Livingston, TX
Flood risk 1/10 · Minimal
- FEMA flood zone
- X (unshaded)
- Chance of flooding over 30 yrs
- 0.0%
- Est. flood insurance / yr
- $507 – $1,088
Fire risk 4/10 · Minor
- Est. fire insurance / yr
- $1,222 – $2,270
Heat risk 8/10 · Major
- Hot days now (above 111°F)
- 7 days/yr
- Hot days in 30 yrs
- 24 days/yr
Wind risk 8/10 · Major
- Chance of severe wind over 30 yrs
- 99.0%
Air-quality risk 1/10 · Minimal
- Unhealthy air days now
- 0 days/yr
- Unhealthy air days in 30 yrs
- 0 days/yr
Risk factors via First Street. Map © Google.
Why this score? — see what drove the B- grade
The composite is a weighted blend of 9 inputs, each scored 0–100. Each bar is that input's sub-score; the figure is the points it added to the 100-point composite (weight × sub-score).
- Cash flow +28.1/30.0
- ARV discount +11.9/15.0
- DSCR +10.0/10.0
- 1% rule +6.7/10.0
- Schools +3.2/10.0
- Rent growth +2.5/5.0
- Livability +2.5/5.0
- Condition / age +2.5/5.0
- Appreciation +0.0/10.0
$125,000
🖨 Deal sheet (PDF) 📄 Offer letter ✓ Due diligence
Listing remarks
Escape to the country and enjoy the relaxed lifestyle this property has to offer. Situated on approximately 1 acre comprised of 6 lots, this 3-bedroom, 2-bath home offers 1,216 square feet of comfortable living space. Water heater installed 2022, AC inside unit installed 2020. The provides privacy and room for pets, gardening, or outdoor activities. Multiple storage buildings offer ample space for tools, equipment, and recreational gear. The roof is approximately 5 years old. Conveniently located with easy access to Lake Livingston, this property is ideal for fishing enthusiasts, weekend getaways, or full-time country living. Bring your boat, enjoy the outdoors, and experience the charm of
Key facts
- Approximately 1 acre
- Room for pets
- Room for gardening
Tags
Property features AI
Finance
- HOA & community: Putnams Landing POA with $300 annual fee
Exterior
- Parking: Detached carport; Additional parking available; Boat parking; Carport for 2 vehicles
- Utilities: Public water; Aerobic septic system
- Home design: Residential property; Full ownership; Block foundation; Composition roof; Built in 1998
- Construction: Block foundation; Composition roof; Built in 1998
- Exterior features: Private yard; Cleared lot; Subdivision lot; Above-ground private pool; Gravel road access; Additional parcel(s) included
Interior
- Kitchen: Dishwasher; Electric range; Refrigerator
- Bedrooms: Total rooms: 8
- Flooring: Carpet; Laminate
- Bathrooms: 2 full bathrooms
- Heating & cooling: Central heating (electric); Central air (electric)
- Interior features: Kitchen/family room combo; Kitchen/dining combo; Soaking tub; Tub with shower; Ceiling fans
- Laundry & utility: Washer hookup; Electric dryer hookup
Neighborhood map
What this means for you Summary
Snapshot
- This is a 3-bed/2.0-bath single-family listed at $125k.
Deal economics
- At list price, monthly cash flow is $392 ($5k/yr) — positive.
- The deal already cash-flows at list — no discount required.
- Meets the 1% rule at list price ($1k rent vs $125k).
- Cap rate 10.1% vs local median 2.5% in West Livingston — top-decile yield for the area; either an underpriced asset or a hidden risk that comps aren't pricing in. Stress-test before assuming the spread holds.
Location & tenants
- Location reads 50/100 on livability (#1,501 in TX) — a working-class tenant base; expect higher turnover. Strengths: cost of living A+, housing A+; Watch: crime F, amenities F, commute F.
- Livingston ISD (rural): math 38% / reading 39% proficiency, ranked #459 of 826 in TX (top 56%) — families likely to look elsewhere, expect single-tenant / working-renter base with shorter leases.
- Zoned schools: Livingston J H (math 30% / reading 32%, grade F, #1,015 of 1,662 statewide, top 62%, 893 students, 62% FRL); Livingston H S (math 35% / reading 46%, grade F, #798 of 1,632 statewide, top 49%, 1,128 students, 51% FRL) — zoned schools at 57% FRL track the district average.
- Market conditions: 1202 active listings in the ZIP; 769 units permitted in Polk County in 2024 (0 in 5+ unit buildings).
Forward outlook
- Local home prices are declining (-3.0%/yr); year-one equity from $864 of loan paydown is wiped out by about $4k of value loss. Plan a longer hold.
- Polk County population projected at +16% by 2050 — long-run rental-demand tailwind backs the buy-and-hold thesis.
- At projected returns (-3.0% appreciation + 3.0% rent growth), your $35k cash investment doubles in ~9 years — after that, you're playing with house money.
Negotiation context
- Only 13 days on market — expect competitive offers; lowballing is unlikely to land.
- Current owner paid $6k; list at $125k implies a 1983% gain — meaningful room to come down on a strong offer.
Risks & watch-outs
- Climate carrying-cost: severe wind risk, 99% chance of damaging wind over 30y; extreme-heat days projected 7→24/yr by 2055 (HVAC capex compounding) — expect insurance premiums to compound above CPI over the hold.
Questions for the listing agent
- What does the HOA fee cover, when was the last increase, and are there any pending special assessments or reserve-fund shortfalls?
- Is there a deadline driving the sale (1031 exchange, divorce, estate, relocation)? That informs how much negotiation room exists.
- Schools are F-rated, which usually means shorter tenancies and higher turnover. Who's the typical renter profile here, and what's been the actual vacancy rate?
- Crime grade is F in this area — have there been break-ins, vandalism, or insurance claims at this property in the last 3 years? What carrier currently insures it and at what premium?
- What's the average days-on-market for RENTAL listings here right now (not sales)? A rising rental-DOM trend means longer vacancies and softer asking-rent achievability than the comps imply.
- What's the recent tenant-quality profile in this submarket — average credit score on applications, eviction rate, late-payment / NSF rate, and stable-employment percentage? A property-management company in the area should have these aggregated.
- How much new for-sale + rental construction is in the pipeline within 1–3 miles? Heavy new supply typically softens prices + rents 12–24 months out; constrained supply supports both.
Investment metrics
- 1% rule
- 1.17% ✓
- Cap rate
- 10.05%
- Cash-on-cash
- 13.43%
- DSCR
- 1.60
- GRM
- 7.1
CMA / ARV
- ARV (on-the-fly)
- $138,624
- Comps found
- 1
Show comp detail 1 sale within ~0.75 mi
| Address | Dist | Beds/Ba | Sqft | Sold | Price | $/sf | Match |
|---|---|---|---|---|---|---|---|
| 235 Osborne Ave | 0.25mi | 3/2.0 | 1,200 (-1%) | 22mo | $137,000 | $114 | 68 |
Match score weights: distance 35% · size 25% · config 20% · recency 20%. Top-matched comps best support the ARV.
Projected returns pro-forma
-3.0% appreciation · 3.0% rent growth · sell at horizon
- IRR
- 3.4%
- Equity multiple
- 1.13×
- Total profit
- $4,652
- Equity at exit
- $18,638
- IRR
- 13.0%
- Equity multiple
- 2.03×
- Total profit
- $36,019
- Equity at exit
- $10,808
Cash invested: $35,000 (down + closing). Projections, not guarantees.
Landlord ↔ Tenant lean methodology
- Overall (STATE)
- 87 Strongly Landlord-Friendly
- State Texas
- 87 Strongly Landlord-Friendly · R+5
- County
- — inherits STATE
- City
- — inherits STATE
ZIP-level market 77351
- Home prices YoY
- -14.8%
- Active inventory
- 1202
- Price-to-rent
- 7.1×
Monthly cashflow live
- Estimated rent
- $1,467 medium interval (Pro) →
- Mortgage (P&I)
- −$656
- Tax from tax record
- −$34 /mo · $414/yr
- Insurance
- −$52
- HOA
- −$25
- Vacancy / Maint / Mgmt
- −$308
- Net cashflow
- $392
Break-even live
Sensitivity live
| Price | -10% $462 | -5% $427 | +0% $392 | +5% $356 | +10% $321 |
|---|---|---|---|---|---|
| Rent | -10% $276 | -5% $334 | +0% $392 | +5% $450 | +10% $508 |
| Rate | -1.0pp $455 | -0.5pp $423 | base $392 | +0.5pp $359 | +1.0pp $326 |
UW: 25.0% down · 7.5% · 30yr · 1.5% tax · 5.0% vac · 8.0% maint · 8.0% mgmt
Financing live
Cash to close
- Down payment
- $31,250
- Closing costs
- $3,750
- Reserves months
- —
- Total cash needed
- —
Loan-product check · same deal, 3 products live
Conventional
25% down · 7.5% · 30yr
- Down + closing
- —
- Monthly P&I
- —
- Monthly cashflow
- —
- DSCR
- —
- Eligible?
- —
Personal DTI + credit; lowest rate.
DSCR
20% down · 8.5% · 30yr
- Down + closing
- —
- Monthly P&I
- —
- Monthly cashflow
- —
- DSCR
- —
- Eligible?
- —
No personal income docs; deal must DSCR.
Hard money
10% down · 12.0% · 12mo
- Down + closing
- —
- Monthly P&I
- —
- Monthly cashflow
- —
- DSCR
- —
- Eligible?
- —
Short-term bridge; refi at stabilization.
HOA detail
- Monthly dues
- $25 · $300/yr
- Likely covers
- water
Listing history 8 events
-
2026-06-21days on market $125,000 Active 13 DOM
-
2026-06-18days on market $125,000 Active 10 DOM
-
2026-06-17days on market $125,000 Active 9 DOM
-
2026-06-16days on market $125,000 Active 8 DOM
-
2026-06-15days on market $125,000 Active 7 DOM
-
2026-06-13days on market $125,000 Active 5 DOM
-
2026-06-09remarks 699-char remark
-
2026-06-09$125,000 Active 1 DOM
ⓘ Source: listings_history table (triggers on properties + properties_extension) + one-shot
backfill from property_details.listing_events for pre-trigger history.
Tax reassessment forecast TX · Resets to sale price
- Current annual tax
- $414 · $34/mo
- Projected year-2 tax
- $2,288 · $191/mo
- Expected delta
- +$1,874/yr (+$156/mo · 453.1%)
ⓘ Screening estimate from a state-policy table — verify with the county assessor before closing.
Climate risk First Street
- Flood 1/10 Low FEMA zone X (unshaded) · 0% chance over 30 yrs
- Wildfire 4/10 Moderate
- Heat 8/10 Severe 7 d/yr ≥111°F today · 24 d/yr by 30 yrs out
- Wind 8/10 Severe 99% chance of damaging wind over 30 yrs
- Air quality 1/10 Low 0 unhealthy d/yr today · 0 by 30 yrs out
Nearby sold comps map
Loading sold comps map…
Walkable amenities ~0.75 mi
Loading nearby amenities…
Taxation est. · year 1
- Rental income
- $17,601
- − Mortgage interest
- −$7,002
- − Property taxes
- −$414
- − Insurance
- −$625
- − Repairs & maintenance
- −$1,408
- − Management
- −$1,408
- − HOA
- −$300
- − Depreciation
- −$3,636
- Taxable income
- $2,808
- Est. tax owed @ 24.0%
- −$674
- After-tax cash flow
- $4,026/yr
For passive investors: Depreciation is non-cash, so a rental often shows a tax loss while cash-flowing — sheltering income. Rental losses are passive: they offset passive income freely, and up to $25,000/yr can offset ordinary (W-2) income if you actively participate and your MAGI is under $100k (phasing out to $0 by $150k); unused losses carry forward. On sale, claimed depreciation is recaptured at up to 25%, and gains may owe capital-gains tax (a 1031 exchange can defer both). Figures are a year-1 estimate at your 24.0% rate — not tax advice; consult a CPA.
Schools (NCES district)
- District
- Livingston ISD
- NCES district ID
- 4827780
- Math proficiency
- 38% ▼ -1.00%
- Reading proficiency
- 39% ▲ 3.00%
- Median HH income
- $39,531
- Composite
- 32.25/100
- National rank
- #5767
- State rank
- #459 of 826 in TX
Livability — West Livingston
- Score
- 50/100
- State rank
- #1501
- US rank
- #25668
Category grades
Schools grade is shown separately in the Schools card above.
Census & demographics
- Census place
- West Livingston, TX
- County
- Polk County · 37,143 people
- Metro
- nan
- Population (ZIP)
- 37,143
- Household income
- $66,834
- Rent vs Own
- Severe rent burden
- 608.0
Population outlook (Polk County) Hauer SSP2
- Today (2025)
- 51,049 people
- By 2030
- 53,243 · +4.3%
- By 2040
- 56,528 · +10.7%
- By 2050
- 59,243 · +16.1%
- By 2075
- 63,528 · +24.4%
- By 2100
- 60,376 · +18.3%
Race, ethnicity, and origin ACS 2023
- Neighborhood character
- Predominantly White (72%)
- Race & ethnicity
- White 72% Hispanic / Latino 14% Two or more races 9% Black 8% Native American 2%
- Hispanic origin (detail)
- Mexican 11%
- Common ancestry
- Lithuanian 2% Italian 2% Portuguese 2%
- Foreign-born
- 5% · Canada
- Languages at home
- 88% English-only · Spanish 10%
Political lean MEDSL · Polk
- 2024 margin
- Solid R (+58.9) · D 20.2% · R 79.1%
- 2008→2024 swing
- -21.7pp toward R · 2008: -37.2pp · 2024: -58.9pp
- All cycles
- 2024: R+58.9 2020: R+54.5 2016: R+56.5 2012: R+48.2 2008: R+37.2
Not yet ingested
- Civics
- —
Market trends
- HPI YoY
- ▼ -31.11%
- Current HPI
- 178.5316
- Rent YoY
- —
- Metro
- nan
- State GDP YoY
- ▲ 3.95%
- F500 in state
- 110
Industry mix (Fortune 500 HQ in TX)
| Industry | F500 HQs | Revenue |
|---|---|---|
| Energy | 16 | $1,198B |
|
||
| Technology | 5 | $198B |
|
||
| Engineering / Construction | 4 | $72B |
|
||
| Energy Services | 3 | $60B |
|
||
| Utilities | 3 | $41B |
|
||
| Healthcare | 2 | $330B |
|
||
Price history
+1983.3% since first listed2 events — show timeline
- 2026-06-08 Listed $125,000 HARMLS
- 2004-08-04 Sold (Public Records) $6,000 Public Records
Property tax history
+9.5%/yrLatest (2025): $414 · +17.1% YoY. Source: county tax records.
Cash-flow waterfall
monthlySold comps — $/sqft
last 12 mo · ≤1 miLoading sold comps…