11117 Red Bud Ln · Lakeshore Resort, IN
Flood risk 1/10 · Minimal
- FEMA flood zone
- X (unshaded)
- Chance of flooding over 30 yrs
- 0.0%
- Est. flood insurance / yr
- $507 – $1,088
Fire risk 1/10 · Minimal
- Est. fire insurance / yr
- $717 – $1,331
Heat risk 3/10 · Minor
- Hot days now (above 102°F)
- 7 days/yr
- Hot days in 30 yrs
- 19 days/yr
Wind risk 2/10 · Minimal
- Chance of severe wind over 30 yrs
- 1.0%
Air-quality risk 2/10 · Minimal
- Unhealthy air days now
- 0 days/yr
- Unhealthy air days in 30 yrs
- 1 days/yr
Risk factors via First Street. Map © Google.
Why this score? — see what drove the B grade
The composite is a weighted blend of 9 inputs, each scored 0–100. Each bar is that input's sub-score; the figure is the points it added to the 100-point composite (weight × sub-score).
- Cash flow +29.0/30.0
- ARV discount +15.0/15.0
- DSCR +10.0/10.0
- 1% rule +8.1/10.0
- Schools +5.0/10.0
- Rent growth +2.5/5.0
- Livability +2.5/5.0
- Condition / age +1.0/5.0
- Appreciation +0.0/10.0
$67,900
🖨 Deal sheet (PDF) 📄 Offer letter ✓ Due diligence
Listing remarks
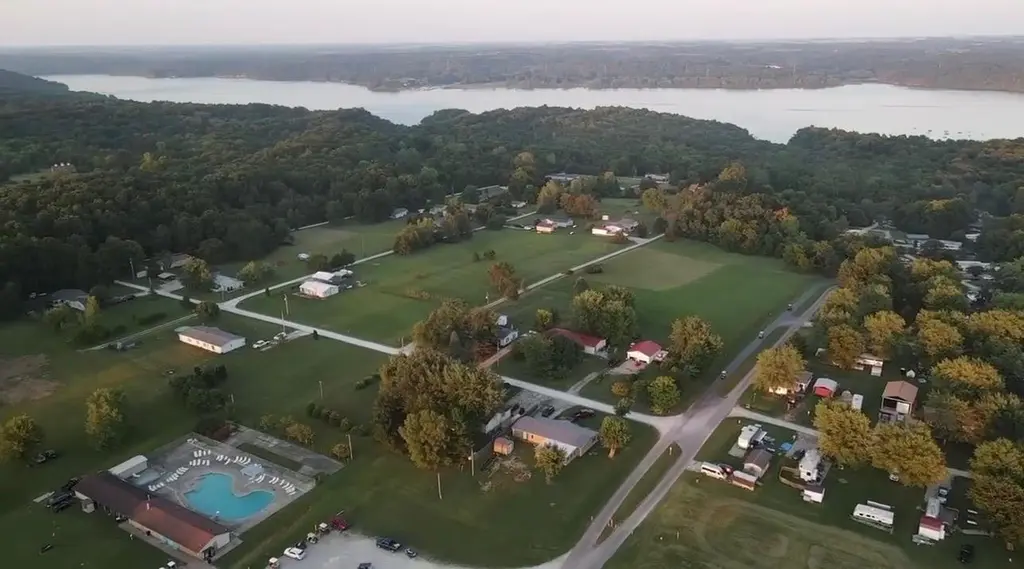
Escape to your own private retreat with this beautiful home situated on your own deeded property. Offering the perfect blend of relaxation and adventure with a sparkling swimming pool, spacious playgrounds, and endless opportunities for family fun. Located right next to a scenic Brookville lake, you'll enjoy skiing, fishing, boating, and peaceful evenings. Whether you're looking for a weekend getaway, vacation home, this property has something for everyone. Create unforgettable memories with outdoor activities, entertaining spaces, and the perfect setting for enjoying life with family and friends. https://lakeshoreresort. us/
Key facts
- 5,000 sq ft lot
- Pool
- Built 1981
Property features AI
Finance
- HOA & community: Homeowners association present
Exterior
- Parking: Gravel parking
- Utilities: Public water; Septic tank
- Home design: Single-family residence; One story
- Construction: Aluminum siding; Metal roof
- Exterior features: In-ground pool; Wooded lot; Gravel road access
Interior
- Kitchen: Range; Oven; Refrigerator
- Bedrooms: Total of 4 rooms (includes living spaces and bedrooms)
- Bathrooms: 1 full bathroom
- Heating & cooling: Central air conditioning
- Interior features: One fireplace
- Laundry & utility: Electric water heater
Neighborhood map
What this means for you Summary
Snapshot
- This is a 2-bed/1.0-bath single-family listed at $68k. Condition is rated poor.
Deal economics
- At list price, monthly cash flow is $232 ($3k/yr) — positive.
- The deal already cash-flows at list — no discount required.
- Meets the 1% rule at list price ($888 rent vs $68k).
- Recommended offer: $67k (1.5% below list) — sets the bar for market timing.
Location & tenants
- Location reads: area grade B — affects rentability + tenant quality, not the cash-flow math above.
- Zoned schools: Franklin County Middle School (math 29% / reading 37%, grade F, #180 of 330 statewide, top 56%, 358 students, 53% FRL); Franklin County High (math 27% / reading 57%, grade F, #197 of 369 statewide, top 57%, 713 students, 44% FRL).
- Market conditions: 4 active listings in the ZIP; 58 units permitted in Franklin County in 2024 (0 in 5+ unit buildings).
Forward outlook
- Local home prices are declining (-3.0%/yr); year-one equity from $469 of loan paydown is wiped out by about $2k of value loss. Plan a longer hold.
- Franklin County population projected to shrink 10% by 2050 — rents likely to lag national; underwrite the cash flow, not the appreciation.
- At projected returns (-3.0% appreciation + 3.0% rent growth), your $19k cash investment doubles in ~8 years — after that, you're playing with house money.
Negotiation context
- It's been on market 26 days — a 2% lower offer ($67k) is reasonable based on typical stale-listing flexibility.
Questions for the listing agent
- Have any recent inspections been done? Can we get a copy of the seller's disclosures and any deferred-maintenance estimates?
- Is there a deadline driving the sale (1031 exchange, divorce, estate, relocation)? That informs how much negotiation room exists.
- What's the average days-on-market for RENTAL listings here right now (not sales)? A rising rental-DOM trend means longer vacancies and softer asking-rent achievability than the comps imply.
- What's the recent tenant-quality profile in this submarket — average credit score on applications, eviction rate, late-payment / NSF rate, and stable-employment percentage? A property-management company in the area should have these aggregated.
- How much new for-sale + rental construction is in the pipeline within 1–3 miles? Heavy new supply typically softens prices + rents 12–24 months out; constrained supply supports both.
Investment metrics
- 1% rule
- 1.31% ✓
- Cap rate
- 10.40%
- Cash-on-cash
- 14.65%
- DSCR
- 1.65
- GRM
- 6.4
CMA / ARV
- ARV (median comp)
- $87,148
- List price
- $67,900
- Delta
- -22.09%
- Verdict
- UNDERPRICED
- Comps
- 6 within 1.0 mi
Show comp detail 2 sales within ~0.75 mi
| Address | Dist | Beds/Ba | Sqft | Sold | Price | $/sf | Match |
|---|---|---|---|---|---|---|---|
| 11117 Red Bud Ln | 0.00mi | 2/1.0 | 938 (0%) | 1mo | $67,000 | $71 | 100 |
| 11118 Cedar St | 0.13mi | 3/1.0 (+1) | 920 (-2%) | 7mo | $204,000 | $222 | 80 |
Match score weights: distance 35% · size 25% · config 20% · recency 20%. Top-matched comps best support the ARV.
Projected returns pro-forma
-3.0% appreciation · 3.0% rent growth · sell at horizon
- IRR
- 5.1%
- Equity multiple
- 1.20×
- Total profit
- $3,796
- Equity at exit
- $10,124
- IRR
- 14.6%
- Equity multiple
- 2.18×
- Total profit
- $22,399
- Equity at exit
- $5,871
Cash invested: $19,012 (down + closing). Projections, not guarantees.
Landlord ↔ Tenant lean methodology
- Overall (STATE)
- 90 Strongly Landlord-Friendly
- State Indiana
- 90 Strongly Landlord-Friendly · R+11
- County
- — inherits STATE
- City
- — inherits STATE
ZIP-level market 47012
- Home prices YoY
- -27.1%
- Active inventory
- 4
- Price-to-rent
- 6.4×
Monthly cashflow live
- Estimated rent
- $888 medium interval (Pro) →
- Mortgage (P&I)
- −$356
- Tax est. 1.5%
- −$85 /mo · $1,018/yr
- Insurance
- −$28
- HOA
- −$0
- Vacancy / Maint / Mgmt
- −$186
- Net cashflow
- $232
Break-even live
Sensitivity live
| Price | -10% $279 | -5% $256 | +0% $232 | +5% $209 | +10% $185 |
|---|---|---|---|---|---|
| Rent | -10% $162 | -5% $197 | +0% $232 | +5% $267 | +10% $302 |
| Rate | -1.0pp $266 | -0.5pp $249 | base $232 | +0.5pp $215 | +1.0pp $197 |
UW: 25.0% down · 7.5% · 30yr · 1.5% tax · 5.0% vac · 8.0% maint · 8.0% mgmt
Financing live
Cash to close
- Down payment
- $16,975
- Closing costs
- $2,037
- Reserves months
- —
- Total cash needed
- —
Loan-product check · same deal, 3 products live
Conventional
25% down · 7.5% · 30yr
- Down + closing
- —
- Monthly P&I
- —
- Monthly cashflow
- —
- DSCR
- —
- Eligible?
- —
Personal DTI + credit; lowest rate.
DSCR
20% down · 8.5% · 30yr
- Down + closing
- —
- Monthly P&I
- —
- Monthly cashflow
- —
- DSCR
- —
- Eligible?
- —
No personal income docs; deal must DSCR.
Hard money
10% down · 12.0% · 12mo
- Down + closing
- —
- Monthly P&I
- —
- Monthly cashflow
- —
- DSCR
- —
- Eligible?
- —
Short-term bridge; refi at stabilization.
Listing history 4 events
-
2026-06-02statusdays on market $67,900 Pending 26 DOM
-
2026-06-01days on market $67,900 Active 25 DOM
-
2026-05-31days on market $67,900 Active 24 DOM
-
2026-05-07$67,900 Active 633-char remark
ⓘ Source: listings_history table (triggers on properties + properties_extension) + one-shot
backfill from property_details.listing_events for pre-trigger history.
Climate risk First Street
- Flood 1/10 Low FEMA zone X (unshaded) · 0% chance over 30 yrs
- Wildfire 1/10 Low
- Heat 3/10 Moderate 7 d/yr ≥102°F today · 19 d/yr by 30 yrs out
- Wind 2/10 Low 100% chance of damaging wind over 30 yrs
- Air quality 2/10 Low 0 unhealthy d/yr today · 1 by 30 yrs out
Nearby sold comps map
Loading sold comps map…
Walkable amenities ~0.75 mi
Loading nearby amenities…
Taxation est. · year 1
- Rental income
- $10,654
- − Mortgage interest
- −$3,803
- − Property taxes
- −$1,018
- − Insurance
- −$340
- − Repairs & maintenance
- −$852
- − Management
- −$852
- − Depreciation
- −$1,975
- Taxable income
- $1,813
- Est. tax owed @ 24.0%
- −$435
- After-tax cash flow
- $2,351/yr
For passive investors: Depreciation is non-cash, so a rental often shows a tax loss while cash-flowing — sheltering income. Rental losses are passive: they offset passive income freely, and up to $25,000/yr can offset ordinary (W-2) income if you actively participate and your MAGI is under $100k (phasing out to $0 by $150k); unused losses carry forward. On sale, claimed depreciation is recaptured at up to 25%, and gains may owe capital-gains tax (a 1031 exchange can defer both). Figures are a year-1 estimate at your 24.0% rate — not tax advice; consult a CPA.
Condition & rehab AI · 2 photos
This property requires extensive repairs and maintenance, including roof replacement, exterior updates, and landscaping. The home's poor condition and lack of curb appeal significantly reduce its value.
Repairs flagged
- Major roof — The roof appears to be old and possibly leaking.
- Major exterior siding — The exterior siding is in poor condition, with visible wear and tear.
- Major exterior paint — The exterior paint is in poor condition, with visible wear and tear.
- Major landscaping — The landscaping is overgrown and in poor condition.
- Major windows — The windows are not visible, but the condition of the exterior suggests they may also be in poor condition.
- Major HVAC/mechanicals — No systems are visible, but the condition of the exterior suggests they may also be in poor condition.
Value-add opportunities
- Both roof replacement — Replacing the roof would improve the home's appearance and functionality.
- Both exterior siding and paint — Updating the exterior siding and paint would improve the home's appearance and functionality.
- Both landscaping — Landscaping would improve the home's curb appeal and functionality.
- Both HVAC/mechanicals — Upgrading the HVAC and mechanical systems would improve the home's functionality and energy efficiency.
Renovation cost estimate screening
| Repair item | Severity | Est. cost |
|---|---|---|
| roof · The roof appears to be old and possibly leaking. | Major | $15,000–50,000 |
| exterior siding · The exterior siding is in poor condition, with visible wear and tear. | Major | $15,000–50,000 |
| exterior paint · The exterior paint is in poor condition, with visible wear and tear. | Major | $15,000–50,000 |
| landscaping · The landscaping is overgrown and in poor condition. | Major | $15,000–50,000 |
| windows · The windows are not visible, but the condition of the exterior suggests they may also be in poor condition. | Major | $15,000–50,000 |
| HVAC/mechanicals · No systems are visible, but the condition of the exterior suggests they may also be in poor condition. | Major | $15,000–50,000 |
| Total estimated repair cost · 6 items | $90,000–300,000 |
Value-add ROI direction
- Both roof replacement — Replacing the roof would improve the home's appearance and functionality. ↑
- Both exterior siding and paint — Updating the exterior siding and paint would improve the home's appearance and functionality. ↑
- Both landscaping — Landscaping would improve the home's curb appeal and functionality. ↑
- Both HVAC/mechanicals — Upgrading the HVAC and mechanical systems would improve the home's functionality and energy efficiency. ↑
ⓘ Cost ranges are severity-bucket heuristics (US national rule-of-thumb). Get contractor quotes + a written scope before underwriting a rehab budget.
Schools (NCES district)
No district data.
Livability — Lakeshore Resort
No livability data for this city. (Only ~50 U.S. cities are tracked.)
Census & demographics
- Census place
- Lakeshore Resort, IN
- Population (ZIP)
- 10,891
Population outlook (Franklin County) Hauer SSP2
- Today (2025)
- 22,796 people
- By 2030
- 22,556 · -1.1%
- By 2040
- 21,762 · -4.5%
- By 2050
- 20,575 · -9.7%
- By 2075
- 17,810 · -21.9%
- By 2100
- 13,698 · -39.9%
Race, ethnicity, and origin ACS 2023
- Neighborhood character
- Predominantly White (96%)
- Race & ethnicity
- White 96% Two or more races 2% Hispanic / Latino 2%
- Common ancestry
- Slovak 2% Italian 1% Romanian 1%
- Foreign-born
- 2% · Vietnam, Canada
- Languages at home
- 96% English-only · Korean 2% Vietnamese 1% Russian/Polish/Slavic 1%
Political lean MEDSL · Franklin
- 2024 margin
- Solid R (+64.4) · D 17.1% · R 81.5% · Other 1.3%
- 2008→2024 swing
- -30.3pp toward R · 2008: -34.1pp · 2024: -64.4pp
- All cycles
- 2024: R+64.4 2020: R+63.0 2016: R+60.9 2012: R+42.8 2008: R+34.1
Not yet ingested
- Civics
- —
Market trends
- HPI YoY
- ▼ -82.81%
- Current HPI
- 223.2183
- Rent YoY
- —
- Metro
- —
- State GDP YoY
- ▲ 2.90%
- F500 in state
- 18
Industry mix (Fortune 500 HQ in IN)
| Industry | F500 HQs | Revenue |
|---|---|---|
| Industrial Machinery | 2 | $37B |
|
||
| Healthcare | 1 | $177B |
|
||
| Pharmaceuticals | 1 | $45B |
|
||
| Metals / Steel | 1 | $18B |
|
||
| Agriculture | 1 | $17B |
|
||
| Packaging | 1 | $12B |
|
||
Price history
-1.3% since first listed3 events — show timeline
- 2026-06-04 Sold (MLS) $67,000 SEIBR
- 2026-06-02 Pending — SEIBR
- 2026-05-07 Listed $67,900 SEIBR
Cash-flow waterfall
monthlySold comps — $/sqft
last 12 mo · ≤1 miLoading sold comps…