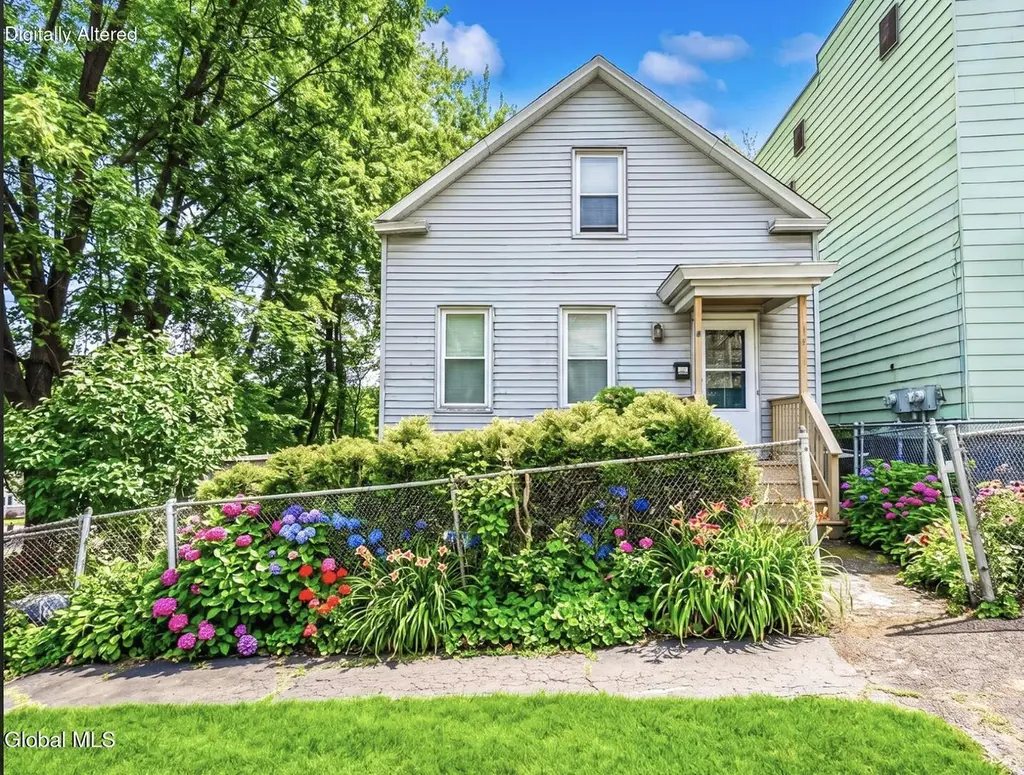
56 Partition St · Rensselaer, NY
Flood risk 1/10 · Minimal
- FEMA flood zone
- X
- Chance of flooding over 30 yrs
- 0.0%
- Est. flood insurance / yr
- $473 – $860
Fire risk 3/10 · Minor
- Est. fire insurance / yr
- $691 – $1,283
Heat risk 4/10 · Minor
- Hot days now (above 98°F)
- 7 days/yr
- Hot days in 30 yrs
- 17 days/yr
Wind risk 3/10 · Minor
- Chance of severe wind over 30 yrs
- 6.0%
Air-quality risk 2/10 · Minimal
- Unhealthy air days now
- 0 days/yr
- Unhealthy air days in 30 yrs
- 1 days/yr
Risk factors via First Street. Map © Google.
Why this score? — see what drove the B grade
The composite is a weighted blend of 9 inputs, each scored 0–100. Each bar is that input's sub-score; the figure is the points it added to the 100-point composite (weight × sub-score).
- Cash flow +29.2/30.0
- ARV discount +15.0/15.0
- DSCR +10.0/10.0
- 1% rule +8.5/10.0
- Livability +3.9/5.0
- Rent growth +2.7/5.0
- Schools +2.7/10.0
- Condition / age +2.5/5.0
- Appreciation +0.0/10.0
$149,000
🖨 Deal sheet (PDF) 📄 Offer letter ✓ Due diligence
Listing remarks MLS
***INVESTORS*** 3 Bedroom, 1 Bath, Livingroom, Formal Dining Room. Ready for a rehab. Property needs top to bottom rehab. Has mold recommend wearing a mask. CASH ONLY
Key facts
- Renovated kitchen
- Updated interior
- Motion sensor faucet
Tags
Neighborhood map
What this means for you Summary
Snapshot
- This is a 3-bed/1.0-bath single-family listed at $149k.
Deal economics
- At list price, monthly cash flow is $518 ($6k/yr) — positive.
- The deal already cash-flows at list — no discount required.
- Meets the 1% rule at list price ($2k rent vs $149k).
- Cap rate 10.5% vs local median 5.0% in Rensselaer — top-decile yield for the area; either an underpriced asset or a hidden risk that comps aren't pricing in. Stress-test before assuming the spread holds.
Location & tenants
- Location reads 77/100 on livability (#191 in NY, #2,967 nationally) — a middle-class / working-renter tenant base. Strengths: commute A+, housing A+, health & safety A+; Watch: schools C-, crime D+.
- Rensselaer City School District (suburban): math 28% / reading 34% proficiency, ranked #574 of 590 in NY (top 97%) — families likely to look elsewhere, expect single-tenant / working-renter base with shorter leases.
- Market conditions: Rents flat; 102 active listings in the ZIP; 27 comparable units currently listed for rent nearby; rentals at typical pace (median 24d on market — plan ~3-4 weeks tenant-placement turnaround); solid renter incomes; 405 units permitted in Rensselaer County in 2024 (224 in 5+ unit buildings).
Forward outlook
- Local home prices are declining (-3.0%/yr); year-one equity from $1k of loan paydown is wiped out by about $4k of value loss. Plan a longer hold.
- Rensselaer County population projected to shrink 6% by 2050 — rents likely to lag national; underwrite the cash flow, not the appreciation.
Negotiation context
- Only 7 days on market — expect competitive offers; lowballing is unlikely to land.
- 2 sale attempts with the ask held roughly flat each time — persistent listings suggest the price (not the market) is what's stuck; bring a comps-based counter.
- Current owner paid $50k; list at $149k implies a 198% gain — meaningful room to come down on a strong offer.
Risks & watch-outs
- Watch-outs: built in 1903 — expect roof / HVAC / electrical / plumbing capex.
Questions for the listing agent
- Built in 1903 — when were the roof, HVAC, electrical panel, plumbing, and water heater last replaced?
- Is there a deadline driving the sale (1031 exchange, divorce, estate, relocation)? That informs how much negotiation room exists.
- Crime grade is D in this area — have there been break-ins, vandalism, or insurance claims at this property in the last 3 years? What carrier currently insures it and at what premium?
- What's the average days-on-market for RENTAL listings here right now (not sales)? A rising rental-DOM trend means longer vacancies and softer asking-rent achievability than the comps imply.
- What's the recent tenant-quality profile in this submarket — average credit score on applications, eviction rate, late-payment / NSF rate, and stable-employment percentage? A property-management company in the area should have these aggregated.
- How much new for-sale + rental construction is in the pipeline within 1–3 miles? Heavy new supply typically softens prices + rents 12–24 months out; constrained supply supports both.
Investment metrics
- 1% rule
- 1.35% ✓
- Cap rate
- 10.47%
- Cash-on-cash
- 14.91%
- DSCR
- 1.66
- GRM
- 6.2
CMA / ARV
- ARV (on-the-fly)
- $219,648
- Comps found
- 12
Show comp detail 12 sales within ~0.75 mi
| Address | Dist | Beds/Ba | Sqft | Sold | Price | $/sf | Match |
|---|---|---|---|---|---|---|---|
| 941 6th St St | 0.18mi | 3/1.5 | 1,380 (-2%) | 4mo | $157,000 | $114 | 83 |
| 7 Wendell St | 0.23mi | 3/1.5 | 1,335 (-5%) | 5mo | $260,000 | $195 | 74 |
| 1309 2nd St | 0.42mi | 3/1.0 | 1,540 (+9%) | 5mo | $240,000 | $156 | 60 |
| 1015 1st St | 0.25mi | 3/1.5 | 1,240 (-12%) | 10mo | $175,000 | $141 | 58 |
| 1140 Broadway | 0.35mi | 3/2.5 | 1,520 (+8%) | 9mo | $160,000 | $105 | 56 |
| 831 7th St | 0.15mi | 2/2.0 (-1) | 1,200 (-15%) | 7mo | $189,000 | $158 | 54 |
| 35 Pine St | 0.34mi | 3/1.0 | 1,205 (-14%) | 9mo | $259,900 | $216 | 53 |
| 1484 3rd St | 0.63mi | 2/1.5 (-1) | 1,322 (-6%) | 2mo | $125,000 | $95 | 52 |
| 1512 Broadway | 0.71mi | 3/1.0 | 1,272 (-10%) | 1mo | $215,000 | $169 | 50 |
| 8 Plum St | 0.56mi | 3/1.0 | 1,218 (-14%) | 9mo | $205,000 | $168 | 44 |
| 26 Elm St | 0.38mi | 4/2.0 (+1) | 1,600 (+14%) | 9mo | $235,000 | $147 | 43 |
| 1517 5th St | 0.69mi | 2/1.0 (-1) | 1,299 (-8%) | 11mo | $192,000 | $148 | 41 |
Match score weights: distance 35% · size 25% · config 20% · recency 20%. Top-matched comps best support the ARV.
Projected returns pro-forma
-3.0% appreciation · 0.9% rent growth · sell at horizon
- IRR
- 3.0%
- Equity multiple
- 1.11×
- Total profit
- $4,768
- Equity at exit
- $22,216
- IRR
- 10.4%
- Equity multiple
- 1.73×
- Total profit
- $30,510
- Equity at exit
- $12,883
Cash invested: $41,720 (down + closing). Projections, not guarantees.
Landlord ↔ Tenant lean methodology
- Overall (STATE)
- 15 Strongly Tenant-Friendly
- State New York
- 15 Strongly Tenant-Friendly · D+10
- County
- — inherits STATE
- City
- — inherits STATE
ZIP-level market 12144
- Home prices YoY
- -33.4%
- Rents YoY
- 0.9%
- Active inventory
- 102
- Price-to-rent
- 6.2×
Monthly cashflow live
- Estimated rent
- $2,013 high interval (Pro) →
- Mortgage (P&I)
- −$781
- Tax from tax record
- −$229 /mo · $2,743/yr
- Insurance
- −$62
- HOA
- −$0
- Vacancy / Maint / Mgmt
- −$423
- Net cashflow
- $518
Break-even live
Sensitivity live
| Price | -10% $603 | -5% $561 | +0% $518 | +5% $476 | +10% $434 |
|---|---|---|---|---|---|
| Rent | -10% $359 | -5% $439 | +0% $518 | +5% $598 | +10% $678 |
| Rate | -1.0pp $594 | -0.5pp $556 | base $518 | +0.5pp $480 | +1.0pp $441 |
UW: 25.0% down · 7.5% · 30yr · 1.5% tax · 5.0% vac · 8.0% maint · 8.0% mgmt
Financing live
Cash to close
- Down payment
- $37,250
- Closing costs
- $4,470
- Reserves months
- —
- Total cash needed
- —
Loan-product check · same deal, 3 products live
Conventional
25% down · 7.5% · 30yr
- Down + closing
- —
- Monthly P&I
- —
- Monthly cashflow
- —
- DSCR
- —
- Eligible?
- —
Personal DTI + credit; lowest rate.
DSCR
20% down · 8.5% · 30yr
- Down + closing
- —
- Monthly P&I
- —
- Monthly cashflow
- —
- DSCR
- —
- Eligible?
- —
No personal income docs; deal must DSCR.
Hard money
10% down · 12.0% · 12mo
- Down + closing
- —
- Monthly P&I
- —
- Monthly cashflow
- —
- DSCR
- —
- Eligible?
- —
Short-term bridge; refi at stabilization.
Rent comps 27 comps
| Address | Beds | Baths | Sqft | Rent | $/sqft | DOM | Units | Dist |
|---|---|---|---|---|---|---|---|---|
| 25 Harrison Ave Rensselaer, NY | 2.0 | 1.0 | 1400 | $1,745 | $1.25 | 19d | 1 | 0.17mi |
| 945 Broadway Rensselaer, NY | 3.0 | 1.0 | 1200 | $1,650 | $1.38 | 24d | 1 | 0.27mi |
| 100 New Broadway Rensselaer, NY | 2.0 | 2.0 | 1248 | $2,212 | $1.77 | 14d | 2 | 0.30mi |
| 1047 Broadway Rensselaer, NY | 2.0 | 1.0 | 1014 | $1,650 | $1.63 | 14d | 1 | 0.31mi |
| 99 New Broadway Rensselaer, NY | 2.0 | 1.0–2.0 | 946 | $2,495 | $2.64 | 14d | 5 | 0.40mi |
| 7 Elm Ct Rensselaer, NY | 1.0–2.0 | 1.0–2.0 | 829 | $1,830 | $2.21 | 14d | 1 | 0.44mi |
| 1307 Broadway Rensselaer, NY | 2.0 | 1.0 | 1014 | $1,650 | $1.63 | 14d | 1 | 0.46mi |
| 1311 Broadway Rensselaer, NY | 2.0 | 1.0 | 1014 | $1,650 | $1.63 | 14d | 1 | 0.46mi |
| 1444 2nd St Unit 2 Rensselaer, NY | 4.0 | 1.0 | 950 | $1,900 | $2.00 | 44d | 1 | 0.59mi |
| 48 N Pearl St Albany, NY | 2.0 | 1.0–2.5 | 1251 | $3,500 | $2.80 | 14d | 17 | 0.94mi |
| 151 S Pearl St Albany, NY | 2.0 | 1.0 | 1000 | $1,600 | $1.60 | 14d | 1 | 0.98mi |
| 168 S Pearl St Albany, NY | 3.0 | 1.5 | 1044 | $1,800 | $1.72 | 24d | 1 | 0.99mi |
| 135 Madison Ave Unit 2 Albany, NY | 2.0 | 1.0 | 1000 | $1,400 | $1.40 | 44d | 1 | 1.02mi |
| 164 Madison Ave Albany, NY | 2.0 | 1.0 | 1200 | $1,500 | $1.25 | 44d | 1 | 1.10mi |
| 119 Grand St Albany, NY | 3.0 | 1.0 | 1600 | $1,300 | $0.81 | 44d | 1 | 1.11mi |
| 883 Broadway Apt 201 Albany, NY | 2.0 | 1.0 | 980 | $1,450 | $1.48 | 24d | 1 | 1.16mi |
| 883 Broadway Apt 103 Albany, NY | 2.0 | 1.0 | 1155 | $1,785 | $1.55 | 24d | 1 | 1.16mi |
| 32 1st St Albany, NY | 4.0 | 1.5 | 1773 | $1,850 | $1.04 | 44d | 1 | 1.17mi |
| 9 St Josephs Ter Albany, NY | 3.0 | 2.0 | 1000 | $1,850 | $1.85 | 44d | 1 | 1.18mi |
| 25 Bleecker Pl #1 Albany, NY | 2.0 | 1.0 | 1150 | $1,350 | $1.17 | 45d | 1 | 1.20mi |
| 475 S Pearl St #3 Albany, NY | 4.0 | 2.0 | 1200 | $1,850 | $1.54 | 14d | 1 | 1.41mi |
| 475 S Pearl St #3 Albany, NY | 4.0 | 2.0 | 1200 | $1,850 | $1.54 | 21d | 1 | 1.41mi |
| 149 Jay St Albany, NY | 2.0 | 1.0 | 1000 | $1,750 | $1.75 | 44d | 1 | 1.46mi |
| 341 Madison Ave Albany, NY | 2.0 | 1.0 | 1000 | $1,800 | $1.80 | 14d | 1 | 1.48mi |
| 154 Lancaster St Unit 1 Albany, NY | 2.0 | 1.5 | 1500 | $2,200 | $1.47 | 24d | 1 | 1.49mi |
| 346 Madison Ave Albany, NY | 3.0 | 2.0 | 1500 | $2,495 | $1.66 | 24d | 1 | 1.50mi |
| 346 Madison Ave Unit 3 Albany, NY | 3.0 | 2.0 | 1110 | $2,725 | $2.45 | 44d | 1 | 1.50mi |
Listing history 6 events
-
2026-04-28status Pending
-
2026-04-21$149,000 Active
-
2025-06-18soldstatus $50,000
-
2025-06-13soldstatus $50,000 Closed 166-char remark
Show marketing remark (166 chars)
***INVESTORS*** 3 Bedroom, 1 Bath, Livingroom, Formal Dining Room. Ready for a rehab. Property needs top to bottom rehab. Has mold recommend wearing a mask. CASH ONLY
-
2025-05-01status Pending 166-char remark
Show marketing remark (166 chars)
***INVESTORS*** 3 Bedroom, 1 Bath, Livingroom, Formal Dining Room. Ready for a rehab. Property needs top to bottom rehab. Has mold recommend wearing a mask. CASH ONLY
-
2025-04-24$59,900 Active 166-char remark
Show marketing remark (166 chars)
***INVESTORS*** 3 Bedroom, 1 Bath, Livingroom, Formal Dining Room. Ready for a rehab. Property needs top to bottom rehab. Has mold recommend wearing a mask. CASH ONLY
ⓘ Source: listings_history table (triggers on properties + properties_extension) + one-shot
backfill from property_details.listing_events for pre-trigger history.
Tax reassessment forecast NY · Partial reset (capped growth)
- Current annual tax
- $2,743 · $229/mo
- Projected year-2 tax
- $2,743 · $229/mo
- Expected delta
- $0/yr ($0/mo · 0.0%)
ⓘ Screening estimate from a state-policy table — verify with the county assessor before closing.
Climate risk First Street
- Flood 1/10 Low FEMA zone X · 0% chance over 30 yrs
- Wildfire 3/10 Moderate
- Heat 4/10 Moderate 7 d/yr ≥98°F today · 17 d/yr by 30 yrs out
- Wind 3/10 Moderate 6% chance of damaging wind over 30 yrs
- Air quality 2/10 Low 0 unhealthy d/yr today · 1 by 30 yrs out
Nearby sold comps map
Loading sold comps map…
Walkable amenities ~0.75 mi
Loading nearby amenities…
Taxation est. · year 1
- Rental income
- $24,159
- − Mortgage interest
- −$8,346
- − Property taxes
- −$2,743
- − Insurance
- −$745
- − Repairs & maintenance
- −$1,933
- − Management
- −$1,933
- − Depreciation
- −$4,335
- Taxable income
- $4,125
- Est. tax owed @ 24.0%
- −$990
- After-tax cash flow
- $5,232/yr
For passive investors: Depreciation is non-cash, so a rental often shows a tax loss while cash-flowing — sheltering income. Rental losses are passive: they offset passive income freely, and up to $25,000/yr can offset ordinary (W-2) income if you actively participate and your MAGI is under $100k (phasing out to $0 by $150k); unused losses carry forward. On sale, claimed depreciation is recaptured at up to 25%, and gains may owe capital-gains tax (a 1031 exchange can defer both). Figures are a year-1 estimate at your 24.0% rate — not tax advice; consult a CPA.
Schools (NCES district)
- District
- Rensselaer City School District
- NCES district ID
- 3624450
- Math proficiency
- 28% ▼ -2.00%
- Reading proficiency
- 34% ▼ -1.00%
- Median HH income
- $48,665
- Composite
- 26.89/100
- National rank
- #7096
- State rank
- #574 of 590 in NY
Livability — Rensselaer
- Score
- 77/100
- State rank
- #191
- US rank
- #2967
Category grades
Schools grade is shown separately in the Schools card above.
Census & demographics
- Census place
- Rensselaer, NY
- County
- Rensselaer County · 75,590 people
- City population
- 22,111
- Metro
- Albany-Schenectady-Troy, NY
- Population (ZIP)
- 22,111
- Household income
- $90,738
- Rent vs Own
- Severe rent burden
- 541.0
Population outlook (Rensselaer County) Hauer SSP2
- Today (2025)
- 162,400 people
- By 2030
- 161,746 · -0.4%
- By 2040
- 158,095 · -2.7%
- By 2050
- 152,966 · -5.8%
- By 2075
- 140,767 · -13.3%
- By 2100
- 124,727 · -23.2%
Race, ethnicity, and origin ACS 2023
- Neighborhood character
- Predominantly White (76%)
- Race & ethnicity
- White 76% Two or more races 8% Asian 7% Hispanic / Latino 6% Black 6%
- Hispanic origin (detail)
- Puerto Rican 4%
- Common ancestry
- Romanian 7% Lithuanian 6% Iranian 3%
- Foreign-born
- 7% · Philippines, Canada, China
- Languages at home
- 91% English-only · Other Asian/Pacific 3% Spanish 2% Chinese 1%
Political lean MEDSL · Rensselaer
- 2024 margin
- Toss-up / Even · D 50.7% · R 49.3%
- 2008→2024 swing
- -8.0pp toward R · 2008: 9.3pp · 2024: 1.4pp
- All cycles
- 2024: D+1.4 2020: D+5.6 2016: R+2.9 2012: D+11.8 2008: D+9.3
Not yet ingested
- Civics
- —
Market trends
- HPI YoY
- ▼ -138.26%
- Current HPI
- 276.2239
- Rent YoY
- ▲ 0.90%
- Metro
- Albany-Schenectady-Troy, NY
- State GDP YoY
- ▲ 2.60%
- F500 in state
- 92
Industry mix (Fortune 500 HQ in NY)
| Industry | F500 HQs | Revenue |
|---|---|---|
| Financial Services | 10 | $950B |
|
||
| Consumer Goods | 9 | $162B |
|
||
| Insurance | 4 | $225B |
|
||
| Telecommunications | 2 | $144B |
|
||
| Pharmaceuticals | 2 | $112B |
|
||
| Media / Entertainment | 2 | $69B |
|
||
Price history
+148.7% since first listed6 events — show timeline
- 2026-04-28 Pending — Global MLS
- 2026-04-21 Listed $149,000 Global MLS
- 2025-06-18 Sold (Public Records) $50,000 Public Records
- 2025-06-13 Sold (MLS) $50,000 Global MLS
- 2025-05-01 Pending — Global MLS
- 2025-04-24 Listed $59,900 Global MLS
Property tax history
+23.8%/yrLatest (2025): $2,743 · +6.4% YoY. Source: county tax records.
Cash-flow waterfall
monthlySold comps — $/sqft
last 12 mo · ≤1 miLoading sold comps…