11 S Chesterfield Rd · Goshen, MA
Flood risk 1/10 · Minimal
- FEMA flood zone
- X
- Chance of flooding over 30 yrs
- 0.0%
- Est. flood insurance / yr
- $473 – $860
Fire risk 3/10 · Minor
- Est. fire insurance / yr
- $915 – $1,699
Heat risk 2/10 · Minimal
- Hot days now (above 91°F)
- 7 days/yr
- Hot days in 30 yrs
- 16 days/yr
Wind risk 4/10 · Minor
- Chance of severe wind over 30 yrs
- 14.0%
Air-quality risk 2/10 · Minimal
- Unhealthy air days now
- 1 days/yr
- Unhealthy air days in 30 yrs
- 1 days/yr
Risk factors via First Street. Map © Google.
Why this score? — see what drove the C grade
The composite is a weighted blend of 9 inputs, each scored 0–100. Each bar is that input's sub-score; the figure is the points it added to the 100-point composite (weight × sub-score).
- Cash flow +20.5/30.0
- ARV discount +7.5/15.0
- Appreciation +7.4/10.0
- DSCR +6.5/10.0
- 1% rule +5.6/10.0
- Schools +4.2/10.0
- Rent growth +2.5/5.0
- Livability +2.5/5.0
- Condition / age +2.5/5.0
$159,000
🖨 Deal sheet 📄 Offer letter ✓ Due diligence
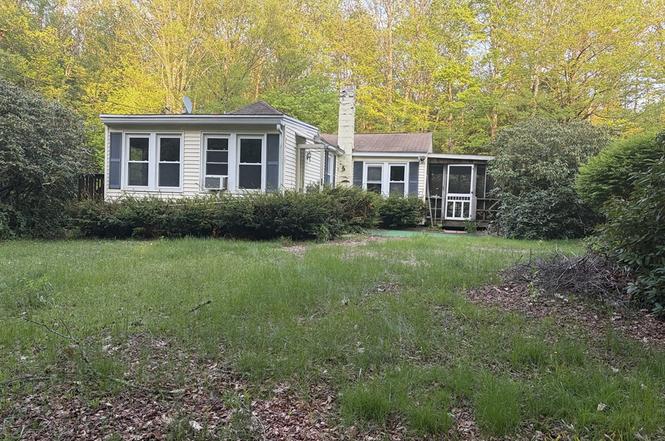
Listing remarks
Home is set on a quiet country street on an elevated one acre parcel. Beautiful yard with wild life galore. Home is vinyl sided, with newer vinyl replacement windows. Heat by propane hot air system and a pellet stove. Sliders lead out to an attached screen porch. Home is fully applianced. Buyers are welcome to do any home inspections they want, but they are informed that home being sold "as is. " Home is currently vacant and buyers agents and buyers enter at their own risk.
Key facts
- Quiet country street
- Fully applianced
- 1.03 acre lot
Tags
Property features AI
Finance
- Financial info: $2,784 tax amount (2025)
- HOA & community: Not a senior community
Exterior
- Parking: Off-street, unpaved parking; Three open parking spaces
- Utilities: Private water; Private sewer (inspection required for sale); Electric service with 100-amp, 110 volts, circuit breakers; Gas available for range and dryer
- Home design: Single-family residence; Approximately 1,03-acre lot; Frame construction; Yellow exterior
- Construction: Shingle roof; Block foundation (irregular); Frame construction; Year built approx. (public records)
- Exterior features: Screened porch; Porch - screened; Rain gutters; Garden; Wooded, gently sloping lot; Paved public road access; public maintained road
Interior
- Kitchen: Vinyl-floored kitchen with dining area; Range, Dishwasher, Refrigerator, Trash compactor, Water heater
- Bedrooms: Main-level primary bedroom with closet and wall-to-wall carpet; Second main-level bedroom with closet and wall-to-wall carpet
- Flooring: Vinyl and carpet (wall-to-wall)
- Bathrooms: One full bathroom with tub, linen closet, vinyl flooring
- Heating & cooling: Central heating and forced air; Space heater available; Propane heating plus wood/pellet stove; Window cooling units
- Interior features: Total of 5 rooms; Insulated doors and storm door(s); Insulated windows with screens; Full basement with interior entry and concrete foundation (unfinished)
- Laundry & utility: Washer and dryer included; Washer hookup and gas dryer hookup in basement with exterior access
Neighborhood map
What this means for you Summary
Snapshot
- This is a 2-bed/1.0-bath single-family listed at $159k.
Deal economics
- At list price, monthly cash flow is $210 ($3k/yr) — positive.
- The deal already cash-flows at list — no discount required.
- Meets the 1% rule at list price ($2k rent vs $159k).
- Recommended offer: $145k (9.0% below list) — sets the bar for market timing.
Location & tenants
- Location reads: area grade C — affects rentability + tenant quality, not the cash-flow math above.
- Hampshire (rural): math 39% / reading 53% proficiency, ranked #144 of 302 in MA (top 48%) — families likely to look elsewhere, expect single-tenant / working-renter base with shorter leases; only 11% free/reduced lunch — higher-income household profile.
- Market conditions: 7 active listings in the ZIP; 1 comparable units currently listed for rent nearby; 349 units permitted in Hampshire County in 2024 (185 in 5+ unit buildings).
Forward outlook
- In year one you build about $9k of equity ($1k loan paydown + $8k appreciation (4.7% local appreciation)).
- Hampshire County population projected at +5% by 2050 — modest demand growth; plan on rents tracking national, not racing it.
- At projected returns (4.7% appreciation + 3.0% rent growth), your $45k cash investment doubles in ~4 years — after that, you're playing with house money.
- By year 5, paydown + projected appreciation supports a ~$37k cash-out refi (75% LTV) — recoverable capital for the next deal without selling this one.
Negotiation context
- It's been on market 120 days — a 9% lower offer ($145k) is reasonable based on typical stale-listing flexibility.
Risks & watch-outs
- Watch-outs: built in 1920 — expect roof / HVAC / electrical / plumbing capex.
Questions for the listing agent
- It's been on market 120 days. Have you received any prior offers? Is the seller open to a 9% concession, seller financing, or rate buy-down credit?
- Built in 1920 — when were the roof, HVAC, electrical panel, plumbing, and water heater last replaced?
- Why hasn't it sold? Are there any deal-killer items the seller is aware of (foundation, flood, title, zoning, code violations)?
- Is there a deadline driving the sale (1031 exchange, divorce, estate, relocation)? That informs how much negotiation room exists.
- What's the average days-on-market for RENTAL listings here right now (not sales)? A rising rental-DOM trend means longer vacancies and softer asking-rent achievability than the comps imply.
- What's the recent tenant-quality profile in this submarket — average credit score on applications, eviction rate, late-payment / NSF rate, and stable-employment percentage? A property-management company in the area should have these aggregated.
- How much new for-sale + rental construction is in the pipeline within 1–3 miles? Heavy new supply typically softens prices + rents 12–24 months out; constrained supply supports both.
Investment metrics
- 1% rule
- 1.06% ✓
- Cap rate
- 7.88%
- Cash-on-cash
- 5.67%
- DSCR
- 1.25
- GRM
- 7.8
CMA / ARV
No comps found within radius.
Projected returns pro-forma
4.73% appreciation · 3.0% rent growth · sell at horizon
- IRR
- 17.1%
- Equity multiple
- 2.07×
- Total profit
- $47,615
- Equity at exit
- $87,467
- IRR
- 17.5%
- Equity multiple
- 4.00×
- Total profit
- $133,669
- Equity at exit
- $148,821
Cash invested: $44,520 (down + closing). Projections, not guarantees.
Landlord ↔ Tenant lean methodology
- Overall (STATE)
- 20 Strongly Tenant-Friendly
- State Massachusetts
- 20 Strongly Tenant-Friendly · D+15
- County
- — inherits STATE
- City
- — inherits STATE
ZIP-level market 01032
- Home prices YoY
- 1.7%
- Active inventory
- 7
- Price-to-rent
- 7.8×
Monthly cashflow live
- Estimated rent
- $1,690 medium interval (Pro) →
- Mortgage (P&I)
- −$834
- Tax from tax record
- −$225 /mo · $2,695/yr
- Insurance
- −$66
- HOA
- −$0
- Vacancy / Maint / Mgmt
- −$355
- Net cashflow
- $210
Break-even live
UW: 25.0% down · 7.5% · 30yr · 1.5% tax · 5.0% vac · 8.0% maint · 8.0% mgmt
Financing live
Cash to close
- Down payment
- $39,750
- Closing costs
- $4,770
- Reserves months
- —
- Total cash needed
- —
Loan-product check · same deal, 3 products live
Conventional
25% down · 7.5% · 30yr
- Down + closing
- —
- Monthly P&I
- —
- Monthly cashflow
- —
- DSCR
- —
- Eligible?
- —
Personal DTI + credit; lowest rate.
DSCR
20% down · 8.5% · 30yr
- Down + closing
- —
- Monthly P&I
- —
- Monthly cashflow
- —
- DSCR
- —
- Eligible?
- —
No personal income docs; deal must DSCR.
Hard money
10% down · 12.0% · 12mo
- Down + closing
- —
- Monthly P&I
- —
- Monthly cashflow
- —
- DSCR
- —
- Eligible?
- —
Short-term bridge; refi at stabilization.
Rent comps 1 comps
| Address | Beds | Baths | Sqft | Rent | $/sqft | DOM | Units | Dist |
|---|---|---|---|---|---|---|---|---|
| 20 W Shore Dr Unit 1 2 4 Williamsburg, MA | 2.0 | 1.0 | 1000 | $1,690 | $1.69 | 13d | 1 | 1.08mi |
Listing history 17 events
-
2026-06-18days on market $159,000 Active 120 DOM
-
2026-06-17days on market $159,000 Active 119 DOM
-
2026-06-16days on market $159,000 Active 118 DOM
-
2026-06-15days on market $159,000 Active 117 DOM
-
2026-06-13days on market $159,000 Active 115 DOM
-
2026-06-12days on market $159,000 Active 114 DOM
-
2026-06-10days on market $159,000 Active 112 DOM
-
2026-06-09days on market $159,000 Active 111 DOM
-
2026-06-08days on market $159,000 Active 110 DOM
-
2026-06-07days on market $159,000 Active 109 DOM
-
2026-06-07days on market $159,000 Active 108 DOM
-
2026-06-03days on market $159,000 Active 105 DOM
-
2026-06-02days on market $159,000 Active 104 DOM
-
2026-06-01days on market $159,000 Active 103 DOM
-
2026-05-31days on market $159,000 Active 102 DOM
-
2026-05-30days on market $159,000 Active 101 DOM
-
2026-02-18$159,000 New
ⓘ Source: listings_history table (triggers on properties + properties_extension) + one-shot
backfill from property_details.listing_events for pre-trigger history.
Tax reassessment forecast MA · Partial reset (capped growth)
- Current annual tax
- $2,695 · $225/mo
- Projected year-2 tax
- $2,695 · $225/mo
- Expected delta
- $0/yr ($0/mo · 0.0%)
ⓘ Screening estimate from a state-policy table — verify with the county assessor before closing.
Climate risk First Street
- Flood 1/10 Low FEMA zone X · 0% chance over 30 yrs
- Wildfire 3/10 Moderate
- Heat 2/10 Low 7 d/yr ≥91°F today · 16 d/yr by 30 yrs out
- Wind 4/10 Moderate 14% chance of damaging wind over 30 yrs
- Air quality 2/10 Low 1 unhealthy d/yr today · 1 by 30 yrs out
Nearby sold comps map
Loading sold comps map…
Walkable amenities ~0.75 mi
Loading nearby amenities…
Taxation est. · year 1
- Rental income
- $20,280
- − Mortgage interest
- −$8,906
- − Property taxes
- −$2,695
- − Insurance
- −$795
- − Repairs & maintenance
- −$1,622
- − Management
- −$1,622
- − Depreciation
- −$4,625
- Taxable income
- $13
- Est. tax owed @ 24.0%
- −$3
- After-tax cash flow
- $2,522/yr
For passive investors: Depreciation is non-cash, so a rental often shows a tax loss while cash-flowing — sheltering income. Rental losses are passive: they offset passive income freely, and up to $25,000/yr can offset ordinary (W-2) income if you actively participate and your MAGI is under $100k (phasing out to $0 by $150k); unused losses carry forward. On sale, claimed depreciation is recaptured at up to 25%, and gains may owe capital-gains tax (a 1031 exchange can defer both). Figures are a year-1 estimate at your 24.0% rate — not tax advice; consult a CPA.
Schools (NCES district)
- District
- Hampshire
- NCES district ID
- 2505740
- Math proficiency
- 39% ▼ -10.00%
- Reading proficiency
- 53% ▼ -1.00%
- Median HH income
- $80,274
- Composite
- 42.31/100
- National rank
- #3260
- State rank
- #144 of 302 in MA
Livability — Goshen
No livability data for this city. (Only ~50 U.S. cities are tracked.)
Census & demographics
- Population (ZIP)
- 503
Population outlook (Hampshire County) Hauer SSP2
- Today (2025)
- 166,577 people
- By 2030
- 168,928 · +1.4%
- By 2040
- 171,197 · +2.8%
- By 2050
- 175,542 · +5.4%
- By 2075
- 199,884 · +20.0%
- By 2100
- 211,819 · +27.2%
Race, ethnicity, and origin ACS 2023
- Neighborhood character
- Predominantly White (98%)
- Race & ethnicity
- White 98%
- Common ancestry
- Romanian 21% Lithuanian 7% Slovak 4%
- Foreign-born
- 2%
- Languages at home
- 95% English-only · Other Indo-European 4% Spanish 1%
Political lean MEDSL · Hampshire
- 2024 margin
- Solid D (+41.9) · D 69.5% · R 27.6% · Other 2.9%
- 2008→2024 swing
- -3.6pp toward R · 2008: 45.6pp · 2024: 41.9pp
- All cycles
- 2024: D+41.9 2020: D+46.8 2016: D+39.5 2012: D+43.8 2008: D+45.6
Not yet ingested
- Civics
- —
Market trends
- HPI YoY
- ▲ 4.73%
- Current HPI
- 282.8774
- Rent YoY
- —
- Metro
- —
- State GDP YoY
- ▲ 2.28%
- F500 in state
- 38
Industry mix (Fortune 500 HQ in MA)
| Industry | F500 HQs | Revenue |
|---|---|---|
| Technology | 3 | $17B |
|
||
| Insurance | 2 | $84B |
|
||
| Retail | 2 | $76B |
|
||
| Life Sciences | 1 | $43B |
|
||
| Energy Technology | 1 | $31B |
|
||
| Aerospace / Defense | 1 | $18B |
|
||
Price history
1 event — show timeline
- 2026-02-18 Listed $159,000 MLS PIN
Property tax history
+3.7%/yrLatest (2023): $2,695 · +8.4% YoY. Source: county tax records.
Cash-flow waterfall
monthlySold comps — $/sqft
last 12 mo · ≤1 miLoading sold comps…