 🌊 Lakefront
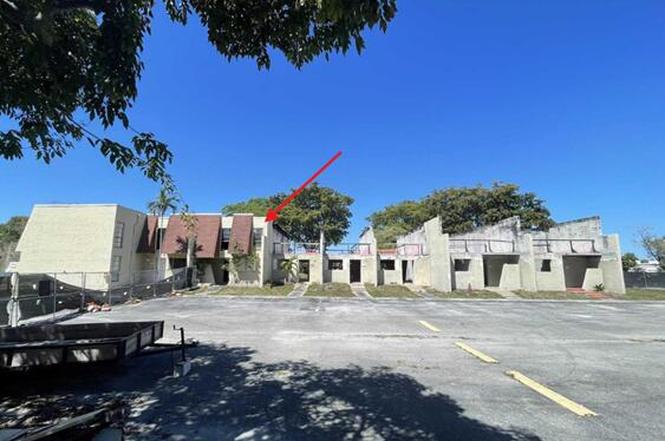
8921 Palm Tree Ln #8921 · Pembroke Pines, FL
Flood risk 1/10 · Minimal
- FEMA flood zone
- X (shaded)
- Chance of flooding over 30 yrs
- 0.0%
- Est. flood insurance / yr
- $507 – $1,088
Fire risk 1/10 · Minimal
- Est. fire insurance / yr
- $947 – $1,759
Heat risk 10/10 · Severe
- Hot days now (above 105°F)
- 7 days/yr
- Hot days in 30 yrs
- 29 days/yr
Wind risk 10/10 · Severe
- Chance of severe wind over 30 yrs
- 99.0%
Air-quality risk 2/10 · Minimal
- Unhealthy air days now
- 2 days/yr
- Unhealthy air days in 30 yrs
- 2 days/yr
Risk factors via First Street. Map © Google.
Why this score? — see what drove the B- grade
The composite is a weighted blend of 9 inputs, each scored 0–100. Each bar is that input's sub-score; the figure is the points it added to the 100-point composite (weight × sub-score).
- Cash flow +27.1/30.0
- 1% rule +10.0/10.0
- DSCR +9.4/10.0
- ARV discount +7.5/15.0
- Livability +4.2/5.0
- Schools +4.1/10.0
- Rent growth +2.8/5.0
- Condition / age +2.5/5.0
- Appreciation +0.0/10.0
$165,000
🖨 Deal sheet 📄 Offer letter ✓ Due diligence
Listing remarks
IINVESTMENT OPPORTUNITY The building and this unit have been affected by a fire that originated in another unit. The Condominium Association is responsible for rebuilding or repairing the exterior elements, including the roof. Excellent location in the heart of Pembroke Pines. The property features a patio and beautiful lake view. The community offers a clubhouse, gym, pools, and tennis courts. Buyers must conduct their own due diligence, but there is potential for a high return on investment. Property is for sale AS IS. Schedule a visit today!
Key facts
- $811 HOA
- Community pool
- Built 1975
Property features AI
Finance
- Other: Pets allowed (breed restrictions and other pet restrictions may apply)
- Financial info:
- HOA & community: Monthly HOA with pool; HOA fees include cable TV, insurance and common area maintenance
Exterior
- Parking:
- Security:
- Utilities: Public water; Public sewer; Three-phase electric; Sewer and water available
- Home design: Condominium; 2-story building; Southeast-facing
- Construction: Concrete construction
- Exterior features: Waterfront
Interior
- Kitchen:
- Bedrooms: 2 main-level bedrooms
- Flooring: Concrete flooring
- Bathrooms: 2 full bathrooms and 1 half bathroom (3 total); 1 bathroom on main level
- Heating & cooling: Central heating; Central air conditioning; Ceiling fans
- Interior features: Unfurnished
- Laundry & utility: Indoor laundry
Neighborhood map
What this means for you Summary
Snapshot
- This is a 3-bed/3.0-bath condo listed at $165k.
Deal economics
- At list price, monthly cash flow is $468 ($6k/yr) — positive.
- The deal already cash-flows at list — no discount required.
- Meets the 1% rule at list price ($3k rent vs $165k).
- Recommended offer: $145k (12.0% below list) — sets the bar for market timing.
- Cap rate 9.7% vs local median 4.0% in Pembroke Pines — top-decile yield for the area; either an underpriced asset or a hidden risk that comps aren't pricing in. Stress-test before assuming the spread holds.
Location & tenants
- Location reads 83/100 on livability (#54 in FL, #933 nationally) — a professional / high-income tenant draw. Strengths: housing A+, health & safety A+, crime A-; Watch: amenities D+, cost of living D+.
- Broward (suburban): math 42% / reading 53% proficiency, ranked #46 of 73 in FL (top 63%) — families likely to look elsewhere, expect single-tenant / working-renter base with shorter leases.
- Zoned schools: Pines Lakes Elementary School (math 32% / reading 42%, grade F, #1,609 of 2,144 statewide, top 77%, 500 students, 68% FRL); Pines Middle School (math 20% / reading 37%, grade F, #482 of 571 statewide, top 85%, 597 students, 67% FRL); Charles W Flanagan High School (math 29% / reading 50%, grade F, #304 of 667 statewide, top 47%, 2,475 students, 57% FRL).
- Zoned-school proficiency averages 35% at this address vs 48% district-wide (-12 pts) — the specific schools serving this property underperform the Broward average; the district grade overstates school quality for this exact location.
- Market conditions: Rents rising (+1.0%/yr); 326 active listings in the ZIP; 40 comparable units currently listed for rent nearby; rentals at typical pace (median 19d on market — plan ~3-4 weeks tenant-placement turnaround); solid renter incomes; 2,111 units permitted in Broward County in 2024 (1,265 in 5+ unit buildings).
Forward outlook
- Local home prices are declining (-3.0%/yr); year-one equity from $1k of loan paydown is wiped out by about $5k of value loss. Plan a longer hold.
- Broward County population projected at +34% by 2050 — long-run rental-demand tailwind backs the buy-and-hold thesis.
Negotiation context
- It's been on market 312 days — a 12% lower offer ($145k) is reasonable based on typical stale-listing flexibility.
- 2 sale attempts with the ask held roughly flat each time — persistent listings suggest the price (not the market) is what's stuck; bring a comps-based counter.
- Current owner paid $135k; 22% above their basis — modest negotiation headroom, anchor on the comps not their cost.
Risks & watch-outs
- Watch-outs: HOA is 27% of rent.
- Climate carrying-cost: severe wind risk, 99% chance of damaging wind over 30y; extreme-heat days projected 7→29/yr by 2055 (HVAC capex compounding) — expect insurance premiums to compound above CPI over the hold.
Questions for the listing agent
- It's been on market 312 days. Have you received any prior offers? Is the seller open to a 12% concession, seller financing, or rate buy-down credit?
- Built in 1975 — when were the roof, HVAC, electrical panel, plumbing, and water heater last replaced?
- What does the HOA fee cover, when was the last increase, and are there any pending special assessments or reserve-fund shortfalls?
- Any open or pending special assessments — roof, HVAC, plumbing, elevator, façade? What's the per-unit balance and payoff schedule, and is the seller paying it off at close or rolling it to the buyer?
- Why hasn't it sold? Are there any deal-killer items the seller is aware of (foundation, flood, title, zoning, code violations)?
- Is there a deadline driving the sale (1031 exchange, divorce, estate, relocation)? That informs how much negotiation room exists.
- Schools are A-rated — typically a magnet for longer-tenancy family renters. What's the average tenant stay here, and is there a school-zone premium baked into asking?
- This sits on a lake — are riparian / water-frontage rights deeded with the parcel? Any dock permits, shoreline easements, or HOA water-use restrictions?
- What's the documented flood / surge / shoreline-erosion history here (FEMA AND non-FEMA — e.g., storm surge, creek backup, septic-field saturation)?
- Any water-quality or seasonal algae-bloom issues that affect tenant satisfaction or short-term-rental demand?
- What's the average days-on-market for RENTAL listings here right now (not sales)? A rising rental-DOM trend means longer vacancies and softer asking-rent achievability than the comps imply.
- What's the recent tenant-quality profile in this submarket — average credit score on applications, eviction rate, late-payment / NSF rate, and stable-employment percentage? A property-management company in the area should have these aggregated.
- How much new apartment / multifamily construction is in the pipeline within 1–3 miles? Heavy new supply (>2% of stock underway) typically softens rents 12–24 months out; light construction supports rent growth.
Investment metrics
- 1% rule
- 1.82% ✓
- Cap rate
- 9.70%
- Cash-on-cash
- 12.16%
- DSCR
- 1.54
- GRM
- 4.6
CMA / ARV
No comps found within radius.
Projected returns pro-forma
-3.0% appreciation · 1.01% rent growth · sell at horizon
- IRR
- -1.4%
- Equity multiple
- 0.95×
- Total profit
- $-2,317
- Equity at exit
- $24,602
- IRR
- 5.1%
- Equity multiple
- 1.33×
- Total profit
- $15,180
- Equity at exit
- $14,266
Cash invested: $46,200 (down + closing). Projections, not guarantees.
Landlord ↔ Tenant lean methodology
- Overall (STATE)
- 87 Strongly Landlord-Friendly
- State Florida
- 87 Strongly Landlord-Friendly · R+3
- County
- — inherits STATE
- City
- — inherits STATE
ZIP-level market 33024
- Rents YoY
- 1.0%
- Active inventory
- 326
- Price-to-rent
- 4.6×
Monthly cashflow live
- Estimated rent
- $3,009 high interval (Pro) →
- Mortgage (P&I)
- −$865
- Tax from tax record
- −$164 /mo · $1,965/yr
- Insurance
- −$69
- HOA
- −$811
- Vacancy / Maint / Mgmt
- −$632
- Net cashflow
- $468
Break-even live
UW: 25.0% down · 7.5% · 30yr · 1.5% tax · 5.0% vac · 8.0% maint · 8.0% mgmt
Financing live
Cash to close
- Down payment
- $41,250
- Closing costs
- $4,950
- Reserves months
- —
- Total cash needed
- —
Loan-product check · same deal, 3 products live
Conventional
25% down · 7.5% · 30yr
- Down + closing
- —
- Monthly P&I
- —
- Monthly cashflow
- —
- DSCR
- —
- Eligible?
- —
Personal DTI + credit; lowest rate.
DSCR
20% down · 8.5% · 30yr
- Down + closing
- —
- Monthly P&I
- —
- Monthly cashflow
- —
- DSCR
- —
- Eligible?
- —
No personal income docs; deal must DSCR.
Hard money
10% down · 12.0% · 12mo
- Down + closing
- —
- Monthly P&I
- —
- Monthly cashflow
- —
- DSCR
- —
- Eligible?
- —
Short-term bridge; refi at stabilization.
Rent comps 40 comps
| Address | Beds | Baths | Sqft | Rent | $/sqft | DOM | Units | Dist |
|---|---|---|---|---|---|---|---|---|
| 1504 NW 89th Ter #1504 Pembroke Pines, FL | 2.0 | 2.5 | 1040 | $2,350 | $2.26 | 24d | 1 | 0.03mi |
| 9110 Orchid Tree Ln #138 Pembroke Pines, FL | 3.0 | 2.5 | 1472 | $3,300 | $2.24 | 24d | 1 | 0.11mi |
| 9110 Orchid Tree Ln #138 Pembroke Pines, FL | 3.0 | 2.5 | 1472 | $3,300 | $2.24 | 17d | 1 | 0.11mi |
| 9151 Orchid Tree Ln #131 Pembroke Pines, FL | 3.0 | 2.5 | 1472 | $3,150 | $2.14 | 24d | 1 | 0.14mi |
| 9321 NW 14th St Pembroke Pines, FL | 4.0 | 2.0 | 1355 | $3,999 | $2.95 | 24d | 1 | 0.27mi |
| 9421 NW 15th St #234 Pembroke Pines, FL | 3.0 | 2.5 | 1472 | $2,750 | $1.87 | 17d | 1 | 0.29mi |
| 9287 NW 18th St Pembroke Pines, FL | 2.0 | 1.5 | 954 | $2,200 | $2.31 | 24d | 1 | 0.30mi |
| 8761 NW 12th St Pembroke Pines, FL | 3.0 | 2.0 | 1429 | $3,300 | $2.31 | 24d | 1 | 0.31mi |
| 9511 NW 14th Ct #213 Pembroke Pines, FL | 2.0 | 2.0 | 1080 | $2,400 | $2.22 | 8d | 1 | 0.33mi |
| 1211 NW 87th Way Pembroke Pines, FL | 2.0 | 1.0 | 897 | $3,000 | $3.34 | 4d | 1 | 0.34mi |
| 920 NW 92nd Ave Pembroke Pines, FL | 3.0 | 2.0 | 1548 | $3,800 | $2.45 | 24d | 1 | 0.36mi |
| 8951 NW 21st St Pembroke Pines, FL | 3.0 | 2.0 | 1626 | $3,950 | $2.43 | 8d | 1 | 0.41mi |
| 1701 NW 96th Ter Unit 1C Pembroke Pines, FL | 3.0 | 2.0 | 1093 | $2,495 | $2.28 | 24d | 1 | 0.52mi |
| 9732 NW 15th St #306 Pembroke Pines, FL | 2.0 | 2.5 | 1214 | $2,650 | $2.18 | 21d | 1 | 0.54mi |
| 1511 NW 85th Way Pembroke Pines, FL | 2.0 | 1.0 | 1317 | $2,725 | $2.07 | 19d | 1 | 0.56mi |
| 1761 Bayberry Dr Pembroke Pines, FL | 3.0 | 2.0 | 1450 | $2,650 | $1.83 | 17d | 1 | 0.60mi |
| 1168 NW 97th Ave #232 Pembroke Pines, FL | 2.0 | 2.5 | 1214 | $2,650 | $2.18 | 14d | 1 | 0.65mi |
| 1561 NW 98th Ave #1561 Pembroke Pines, FL | 2.0 | 2.0 | 1060 | $2,500 | $2.36 | 13d | 1 | 0.67mi |
| 1950 Bayberry Dr Pembroke Pines, FL | 3.0 | 2.5 | 1813 | $3,100 | $1.71 | 24d | 1 | 0.69mi |
| 2101 Bayberry Dr Unit 2101 Pembroke Pines, FL | 2.0 | 2.5 | 1542 | $2,900 | $1.88 | 24d | 1 | 0.70mi |
| 8830 NW 3rd St Pembroke Pines, FL | 3.0 | 2.0 | 1543 | $4,000 | $2.59 | 22d | 1 | 0.73mi |
| 8830 NW 3rd St Pembroke Pines, FL | 3.0 | 2.0 | 1543 | $4,000 | $2.59 | 4d | 1 | 0.73mi |
| 2090 NW 84th Ter Pembroke Pines, FL | 3.0 | 2.0 | 1832 | $3,690 | $2.01 | 11d | 1 | 0.76mi |
| 1601 NW 98th Way Pembroke Pines, FL | 2.0 | 2.0 | 1060 | $2,700 | $2.55 | 21d | 1 | 0.77mi |
| 1601 NW 98th Way Pembroke Pines, FL | 2.0 | 2.0 | 1060 | $2,700 | $2.55 | 8d | 1 | 0.77mi |
| 8350 Taft St Pembroke Pines, FL | 2.0 | 1.0 | 897 | $2,600 | $2.90 | 24d | 1 | 0.78mi |
| 9741 NW 5th St Unit 9741 Pembroke Pines, FL | 3.0 | 2.0 | 1574 | $3,300 | $2.10 | 15d | 1 | 0.82mi |
| 9715 NW 23rd Ct Pembroke Pines, FL | 3.0 | 2.5 | 1589 | $3,800 | $2.39 | 24d | 1 | 0.82mi |
| 9610 NW 2nd St Unit 8-203 Pembroke Pines, FL | 2.0 | 2.0 | 1000 | $2,250 | $2.25 | 24d | 1 | 0.83mi |
| 150 NW 96th Ave Unit 9-203 Pembroke Pines, FL | 2.0 | 2.0 | 1000 | $2,225 | $2.23 | 24d | 1 | 0.85mi |
| 9630 NW 2nd St Unit 6-308 Pembroke Pines, FL | 3.0 | 2.0 | 1247 | $2,700 | $2.17 | 24d | 1 | 0.86mi |
| 731 NW 84th Ave Pembroke Pines, FL | 3.0 | 2.0 | 1176 | $2,850 | $2.42 | 3d | 1 | 0.86mi |
| 9615 NW 1st Ct Unit 10-202 Pembroke Pines, FL | 3.0 | 2.0 | 1247 | $2,550 | $2.04 | 15d | 1 | 0.87mi |
| 9615 NW 1st Ct Unit 10-202 Pembroke Pines, FL | 3.0 | 2.0 | 1247 | $2,550 | $2.04 | 24d | 1 | 0.87mi |
| 9640 NW 2nd St Unit 208 Pembroke Pines, FL | 3.0 | 2.0 | 1247 | $2,500 | $2.00 | 14d | 1 | 0.88mi |
| 9640 NW 2nd St Unit 208 Pembroke Pines, FL | 3.0 | 2.0 | 1247 | $2,500 | $2.00 | 15d | 1 | 0.88mi |
| 9900 Sheridan St Pembroke Pines, FL | 1.0–3.0 | 1.0–2.0 | 965 | $2,725 | $2.82 | 2d | 16 | 0.88mi |
| 9650 NW 2nd St Unit 4-304 Pembroke Pines, FL | 2.0 | 2.0 | 1000 | $2,400 | $2.40 | 8d | 1 | 0.90mi |
| 9620 NW 2nd St Unit 7-106 Pembroke Pines, FL | 3.0 | 2.0 | 1247 | $2,600 | $2.09 | 7d | 1 | 0.91mi |
| 8261 Johnson St Pembroke Pines, FL | 3.0 | 2.0 | 1093 | $3,300 | $3.02 | 17d | 1 | 0.92mi |
HOA detail condo
- Monthly dues
- $811 · $9,732/yr
- Likely covers
- poolgym
- Assessments
- None detected in remarks — confirm with the listing agent.
Listing history 18 events
-
2026-06-18days on market $165,000 Active 312 DOM
-
2026-06-17days on market $165,000 Active 311 DOM
-
2026-06-16days on market $165,000 Active 310 DOM
-
2026-06-15days on market $165,000 Active 309 DOM
-
2026-06-13days on market $165,000 Active 307 DOM
-
2026-06-09days on market $165,000 Active 303 DOM
-
2026-06-07days on market $165,000 Active 301 DOM
-
2026-06-04days on market $165,000 Active 298 DOM
-
2026-06-03days on market $165,000 Active 297 DOM
-
2026-06-02days on market $165,000 Active 296 DOM
-
2026-06-01days on market $165,000 Active 295 DOM
-
2026-05-31days on market $165,000 Active 294 DOM
-
2026-03-19status Active
-
2026-03-11status Pending
-
2026-01-12status Pending
-
2025-06-04$165,000 Active
-
2014-11-20soldstatus $135,000
-
1978-04-01soldstatus $41,000
ⓘ Source: listings_history table (triggers on properties + properties_extension) + one-shot
backfill from property_details.listing_events for pre-trigger history.
Tax reassessment forecast FL · Resets to sale price
- Current annual tax
- $1,965 · $164/mo
- Projected year-2 tax
- $1,965 · $164/mo
- Expected delta
- $0/yr ($0/mo · -0.0%)
ⓘ Screening estimate from a state-policy table — verify with the county assessor before closing.
Climate risk First Street
- Flood 1/10 Low FEMA zone X (shaded) · 0% chance over 30 yrs
- Wildfire 1/10 Low
- Heat 10/10 Extreme 7 d/yr ≥105°F today · 29 d/yr by 30 yrs out
- Wind 10/10 Extreme 99% chance of damaging wind over 30 yrs
- Air quality 2/10 Low 2 unhealthy d/yr today · 2 by 30 yrs out
Nearby sold comps map
Loading sold comps map…
Walkable amenities ~0.75 mi
Loading nearby amenities…
Taxation est. · year 1
- Rental income
- $36,104
- − Mortgage interest
- −$9,243
- − Property taxes
- −$1,965
- − Insurance
- −$825
- − Repairs & maintenance
- −$2,888
- − Management
- −$2,888
- − HOA
- −$9,732
- − Depreciation
- −$4,800
- Taxable income
- $3,762
- Est. tax owed @ 24.0%
- −$903
- After-tax cash flow
- $4,713/yr
For passive investors: Depreciation is non-cash, so a rental often shows a tax loss while cash-flowing — sheltering income. Rental losses are passive: they offset passive income freely, and up to $25,000/yr can offset ordinary (W-2) income if you actively participate and your MAGI is under $100k (phasing out to $0 by $150k); unused losses carry forward. On sale, claimed depreciation is recaptured at up to 25%, and gains may owe capital-gains tax (a 1031 exchange can defer both). Figures are a year-1 estimate at your 24.0% rate — not tax advice; consult a CPA.
Schools (NCES district)
- District
- Broward
- NCES district ID
- 1200180
- Math proficiency
- 42% ▼ -18.00%
- Reading proficiency
- 53% ▼ -5.00%
- Median HH income
- $52,139
- Composite
- 40.88/100
- National rank
- #3621
- State rank
- #46 of 73 in FL
Livability — Pembroke Pines
- Score
- 83/100
- State rank
- #54
- US rank
- #933
Category grades
Schools grade is shown separately in the Schools card above.
Census & demographics
- Census place
- Pembroke Pines, FL
- County
- Broward County · 1,963,430 people
- City population
- 180,224
- Metro
- Miami-Fort Lauderdale-Pompano Beach, FL
- Population (ZIP)
- 76,585
- Household income
- $80,061
- Rent vs Own
- Severe rent burden
- 2813.0
Population outlook (Broward County) Hauer SSP2
- Today (2025)
- 2,207,033 people
- By 2030
- 2,360,704 · +7.0%
- By 2040
- 2,661,208 · +20.6%
- By 2050
- 2,946,698 · +33.5%
- By 2075
- 3,602,273 · +63.2%
- By 2100
- 3,970,984 · +79.9%
Race, ethnicity, and origin ACS 2023
- Neighborhood character
- Diverse neighborhood (Simpson 0.65)
- Race & ethnicity
- Hispanic / Latino 52% Two or more races 23% White 22% Black 17% Asian 4%
- Hispanic origin (detail)
- Mexican 3% Puerto Rican 7% Cuban 13% Dominican 5%
- Common ancestry
- Hispanic 4% Romanian 2% Estonian 1%
- Foreign-born
- 40% · Canada, Jamaica, Dominican Republic
- Languages at home
- 44% English-only · Spanish 46% French/Haitian/Cajun 5% Other Indo-European 3%
Political lean MEDSL · Broward
- 2024 margin
- D (+17.0) · D 58.0% · R 41.0%
- 2008→2024 swing
- -17.8pp toward R · 2008: 34.7pp · 2024: 17.0pp
- All cycles
- 2024: D+17.0 2020: D+29.8 2016: D+35.0 2012: D+34.9 2008: D+34.7
Not yet ingested
- Civics
- —
Market trends
- HPI YoY
- ▼ -442.20%
- Current HPI
- 464.3405
- Rent YoY
- ▲ 1.01%
- Metro
- Miami-Fort Lauderdale-Pompano Beach, FL
- State GDP YoY
- ▲ 3.28%
- F500 in state
- 36
Industry mix (Fortune 500 HQ in FL)
| Industry | F500 HQs | Revenue |
|---|---|---|
| Industrial Technology | 2 | $29B |
|
||
| Insurance | 2 | $17B |
|
||
| Retail | 1 | $60B |
|
||
| Technology Distribution | 1 | $58B |
|
||
| Homebuilding | 1 | $35B |
|
||
| Technology Manufacturing | 1 | $35B |
|
||
Price history
+302.4% since first listed6 events — show timeline
- 2026-03-19 Relisted — Beaches MLS
- 2026-03-11 Pending — Beaches MLS
- 2026-01-12 Pending — Beaches MLS
- 2025-06-04 Listed $165,000 Beaches MLS
- 2014-11-20 Sold (Public Records) $135,000 Public Records
- 1978-04-01 Sold (Public Records) $41,000 Public Records
Property tax history
+1.4%/yrLatest (2025): $1,965 · -1.2% YoY. Source: county tax records.
Cash-flow waterfall
monthlySold comps — $/sqft
last 12 mo · ≤1 miLoading sold comps…