16018 Palos Verdes St · Alva, FL
Flood risk No data
- FEMA flood zone
- —
- Chance of flooding over 30 yrs
- —
- Est. flood insurance / yr
- —
Fire risk No data
- Est. fire insurance / yr
- —
Heat risk No data
- Hot days now (above threshold)
- —
- Hot days in 30 yrs
- —
Wind risk No data
- Chance of severe wind over 30 yrs
- —
Air-quality risk No data
- Unhealthy air days now
- —
- Unhealthy air days in 30 yrs
- —
Risk factors via First Street. Map © Google.
Why this score? — see what drove the D grade
The composite is a weighted blend of 9 inputs, each scored 0–100. Each bar is that input's sub-score; the figure is the points it added to the 100-point composite (weight × sub-score).
- Cash flow +9.6/30.0
- ARV discount +7.5/15.0
- Schools +4.6/10.0
- Condition / age +4.0/5.0
- Rent growth +3.5/5.0
- Livability +3.4/5.0
- 1% rule +2.9/10.0
- DSCR +2.7/10.0
- Appreciation +2.4/10.0
$340,748
🖨 Deal sheet 📄 Offer letter ✓ Due diligence
Listing remarks
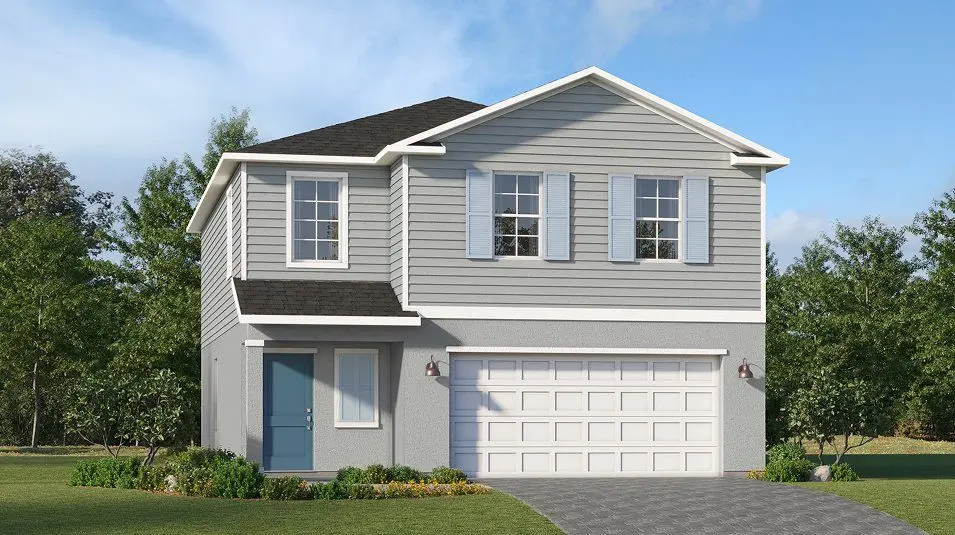
This impressive 1,874-square-foot two-story home features a spacious open-concept first floor where the kitchen, dining room and family room flow effortlessly together, highlighted by sliding glass doors that open to the backyard. The kitchen shines with shaker-style cabinetry, durable quartz countertops and stainless steel appliances including a slide-in electric range and side-by-side refrigerator. Upstairs, a roomy loft creates separation between the three secondary bedrooms and the tranquil owner's suite, complete with a quartz-topped vanity and full-width mirror. Additional conveniences include a new washer and dryer, energy-efficient systems, and a two-car garage with keyless entry an
Key facts
- Open-concept design
- Serene owner's suite
- Covered lanai
Tags
Property features AI
Finance
- Financial info: List price $343,698
Exterior
- Parking: 2 total parking spaces including a 2-car garage
- Home design: Single-family new construction (Columbus plan)
- Construction: Living area approximately 1874
- Exterior features: Residential property located at 16018 Palos Verdes St, Punta Gorda, FL 33982
Interior
- Bedrooms: 4 bedrooms
- Bathrooms: 2 full bathrooms and 1 half bathroom (2.5 total)
- Interior features: Spec home (Columbus plan); Active listing
Neighborhood map
What this means for you Summary
Snapshot
- This is a 4-bed/2.5-bath single-family listed at $341k. Condition is rated good.
Deal economics
- At list price, monthly cash flow is $-230 ($-3k/yr) — negative.
- To cash-flow at today's rent, offer at most $308k (9.8% below list).
- To meet the 1% rule (rent ≥ 1% of price), the offer needs to be $269k (21.1% below list).
- Recommended offer: $269k (21.1% below list) — sets the bar for 1% rule.
Location & tenants
- Location reads 68/100 on livability (#514 in FL) — a middle-class / working-renter tenant base. Strengths: crime A+, employment A+, housing A+; Watch: schools C-, amenities F, commute F.
- Charlotte (suburban): math 54% / reading 54% proficiency, ranked #22 of 73 in FL (top 30%) — acceptable for families but not a draw, mixed tenant base, ~2y average lease.
- Market conditions: Rents rising fast (+4.1%/yr); 1037 active listings in the ZIP; 4,585 units permitted in Charlotte County in 2024 (703 in 5+ unit buildings).
- This rent runs 45% of the median local income ($72k/yr) — at the standard rent-burdened threshold; future hikes will face affordability resistance.
Forward outlook
- Local home prices are declining (-3.0%/yr); year-one equity from $2k of loan paydown is wiped out by about $10k of value loss. Plan a longer hold.
- Charlotte County population projected at +24% by 2050 — long-run rental-demand tailwind backs the buy-and-hold thesis.
Negotiation context
- It's been on market 30 days — a 2% lower offer ($336k) is reasonable based on typical stale-listing flexibility.
Questions for the listing agent
- What do current leases actually rent for vs. the listed asking? Can we see a recent rent roll and the last 12 months of T-12 income?
- Is there a deadline driving the sale (1031 exchange, divorce, estate, relocation)? That informs how much negotiation room exists.
- The area grade is low — what's the realistic commute time and amenity access for the typical tenant pool here? Any planned neighborhood developments (good or bad) we should know about?
- What's the average days-on-market for RENTAL listings here right now (not sales)? A rising rental-DOM trend means longer vacancies and softer asking-rent achievability than the comps imply.
- What's the recent tenant-quality profile in this submarket — average credit score on applications, eviction rate, late-payment / NSF rate, and stable-employment percentage? A property-management company in the area should have these aggregated.
- How much new for-sale + rental construction is in the pipeline within 1–3 miles? Heavy new supply typically softens prices + rents 12–24 months out; constrained supply supports both.
Investment metrics
- 1% rule
- 0.79% ✗
- Cap rate
- 5.48%
- Cash-on-cash
- -2.89%
- DSCR
- 0.87
- GRM
- 10.6
CMA / ARV
No comps found within radius.
Projected returns pro-forma
-3.0% appreciation · 4.13% rent growth · sell at horizon
- IRR
- -19.8%
- Equity multiple
- 0.30×
- Total profit
- $-66,713
- Equity at exit
- $50,807
- IRR
- -10.5%
- Equity multiple
- 0.33×
- Total profit
- $-63,780
- Equity at exit
- $29,462
Cash invested: $95,409 (down + closing). Projections, not guarantees.
Landlord ↔ Tenant lean methodology
- Overall (STATE)
- 87 Strongly Landlord-Friendly
- State Florida
- 87 Strongly Landlord-Friendly · R+3
- County
- — inherits STATE
- City
- — inherits STATE
ZIP-level market 33982
- Home prices YoY
- -1.2%
- Rents YoY
- 4.1%
- Active inventory
- 1037
- Price-to-rent
- 10.6×
Monthly cashflow live
- Estimated rent
- $2,690 medium interval (Pro) →
- Mortgage (P&I)
- −$1,787
- Tax est. 1.5%
- −$426 /mo · $5,111/yr
- Insurance
- −$142
- HOA
- −$0
- Vacancy / Maint / Mgmt
- −$565
- Net cashflow
- $-230
Break-even live
UW: 25.0% down · 7.5% · 30yr · 1.5% tax · 5.0% vac · 8.0% maint · 8.0% mgmt
Financing live
Cash to close
- Down payment
- $85,187
- Closing costs
- $10,222
- Reserves months
- —
- Total cash needed
- —
Loan-product check · same deal, 3 products live
Conventional
25% down · 7.5% · 30yr
- Down + closing
- —
- Monthly P&I
- —
- Monthly cashflow
- —
- DSCR
- —
- Eligible?
- —
Personal DTI + credit; lowest rate.
DSCR
20% down · 8.5% · 30yr
- Down + closing
- —
- Monthly P&I
- —
- Monthly cashflow
- —
- DSCR
- —
- Eligible?
- —
No personal income docs; deal must DSCR.
Hard money
10% down · 12.0% · 12mo
- Down + closing
- —
- Monthly P&I
- —
- Monthly cashflow
- —
- DSCR
- —
- Eligible?
- —
Short-term bridge; refi at stabilization.
Listing history 15 events
-
2026-06-18days on market $340,748 Active 30 DOM
-
2026-06-18remarks 699-char remark
-
2026-06-17days on market $340,748 Active 29 DOM
-
2026-06-16days on market $340,748 Active 28 DOM
-
2026-06-15days on market $340,748 Active 27 DOM
-
2026-06-14days on market $340,748 Active 25 DOM
-
2026-06-13days on market $340,748 Active 24 DOM
-
2026-06-10days on market $340,748 Active 22 DOM
-
2026-06-09days on market $340,748 Active 21 DOM
-
2026-06-08pricedays on market $340,748 Active 20 DOM
-
2026-06-05days on market $343,698 Active 16 DOM
-
2026-06-02days on market $343,698 Active 14 DOM
-
2026-06-01days on market $343,698 Active 13 DOM
-
2026-05-31days on market $343,698 Active 12 DOM
-
2026-05-30days on market $343,698 Active 11 DOM
ⓘ Source: listings_history table (triggers on properties + properties_extension) + one-shot
backfill from property_details.listing_events for pre-trigger history.
Nearby sold comps map
Loading sold comps map…
Walkable amenities ~0.75 mi
Loading nearby amenities…
Taxation est. · year 1
- Rental income
- $32,280
- − Mortgage interest
- −$19,087
- − Property taxes
- −$5,111
- − Insurance
- −$1,704
- − Repairs & maintenance
- −$2,582
- − Management
- −$2,582
- − Depreciation
- −$9,913
- Taxable loss
- −$8,699
- Est. tax savings @ 24.0%
- +$2,088
- After-tax cash flow
- $-669/yr
For passive investors: Depreciation is non-cash, so a rental often shows a tax loss while cash-flowing — sheltering income. Rental losses are passive: they offset passive income freely, and up to $25,000/yr can offset ordinary (W-2) income if you actively participate and your MAGI is under $100k (phasing out to $0 by $150k); unused losses carry forward. On sale, claimed depreciation is recaptured at up to 25%, and gains may owe capital-gains tax (a 1031 exchange can defer both). Figures are a year-1 estimate at your 24.0% rate — not tax advice; consult a CPA.
Condition & rehab AI · 26 photos
This well-maintained two-story home features a modern design with good condition throughout. It offers a spacious layout and is move-in ready, making it an attractive option for both resale and rental markets.
Value-add opportunities
- Both Painting the exterior and interior walls — Fresh paint can enhance curb appeal and interior aesthetics.
- Both Updating the flooring in the bathrooms — Modern flooring can improve the look and feel of the bathrooms.
- Both Upgrading the kitchen appliances — Modern appliances can increase the home's appeal and functionality.
- Both Adding smart home features — Smart home features can enhance convenience and increase the home's value.
- Both Landscaping improvements — Enhanced landscaping can improve curb appeal and add value to the property.
Renovation cost estimate screening
Value-add ROI direction
- Both Painting the exterior and interior walls — Fresh paint can enhance curb appeal and interior aesthetics. ↑
- Both Updating the flooring in the bathrooms — Modern flooring can improve the look and feel of the bathrooms. ↑
- Both Upgrading the kitchen appliances — Modern appliances can increase the home's appeal and functionality. ↑
- Both Adding smart home features — Smart home features can enhance convenience and increase the home's value. ↑
- Both Landscaping improvements — Enhanced landscaping can improve curb appeal and add value to the property. ↑
ⓘ Cost ranges are severity-bucket heuristics (US national rule-of-thumb). Get contractor quotes + a written scope before underwriting a rehab budget.
Schools (NCES district)
- District
- Charlotte
- NCES district ID
- 1200240
- Math proficiency
- 54% ▼ -6.00%
- Reading proficiency
- 54% ▼ -1.00%
- Median HH income
- $44,864
- Composite
- 45.62/100
- National rank
- #2586
- State rank
- #22 of 73 in FL
Livability — Alva
- Score
- 68/100
- State rank
- #514
- US rank
- #9471
Category grades
Schools grade is shown separately in the Schools card above.
Census & demographics
- County
- Charlotte County · 196,994 people
- Metro
- Punta Gorda, FL
- Population (ZIP)
- 13,006
- Household income
- $72,443
- Rent vs Own
- Severe rent burden
- 43.0
Population outlook (Charlotte County) Hauer SSP2
- Today (2025)
- 198,646 people
- By 2030
- 210,507 · +6.0%
- By 2040
- 230,857 · +16.2%
- By 2050
- 247,148 · +24.4%
- By 2075
- 281,777 · +41.8%
- By 2100
- 293,609 · +47.8%
Race, ethnicity, and origin ACS 2023
- Neighborhood character
- Predominantly White (81%)
- Race & ethnicity
- White 81% Two or more races 8% Hispanic / Latino 7% Black 7%
- Hispanic origin (detail)
- Puerto Rican 2% Cuban 3%
- Common ancestry
- Lithuanian 3% Iranian 3% Slovak 3%
- Foreign-born
- 6% · Canada, Jamaica
- Languages at home
- 93% English-only · Spanish 5% German/W. Germanic 1% Arabic 1%
Political lean MEDSL · Charlotte
- 2024 margin
- Solid R (+34.0) · D 32.7% · R 66.7%
- 2008→2024 swing
- -26.7pp toward R · 2008: -7.2pp · 2024: -34.0pp
- All cycles
- 2024: R+34.0 2020: R+26.6 2016: R+27.8 2012: R+14.3 2008: R+7.2
Not yet ingested
- Civics
- —
Market trends
- HPI YoY
- ▼ -5.25%
- Current HPI
- 448.5895
- Rent YoY
- ▲ 4.13%
- Metro
- Punta Gorda, FL
- State GDP YoY
- ▲ 3.28%
- F500 in state
- 36
Industry mix (Fortune 500 HQ in FL)
| Industry | F500 HQs | Revenue |
|---|---|---|
| Industrial Technology | 2 | $29B |
|
||
| Insurance | 2 | $17B |
|
||
| Retail | 1 | $60B |
|
||
| Technology Distribution | 1 | $58B |
|
||
| Homebuilding | 1 | $35B |
|
||
| Technology Manufacturing | 1 | $35B |
|
||
Cash-flow waterfall
monthlySold comps — $/sqft
last 12 mo · ≤1 miLoading sold comps…