 Duplex
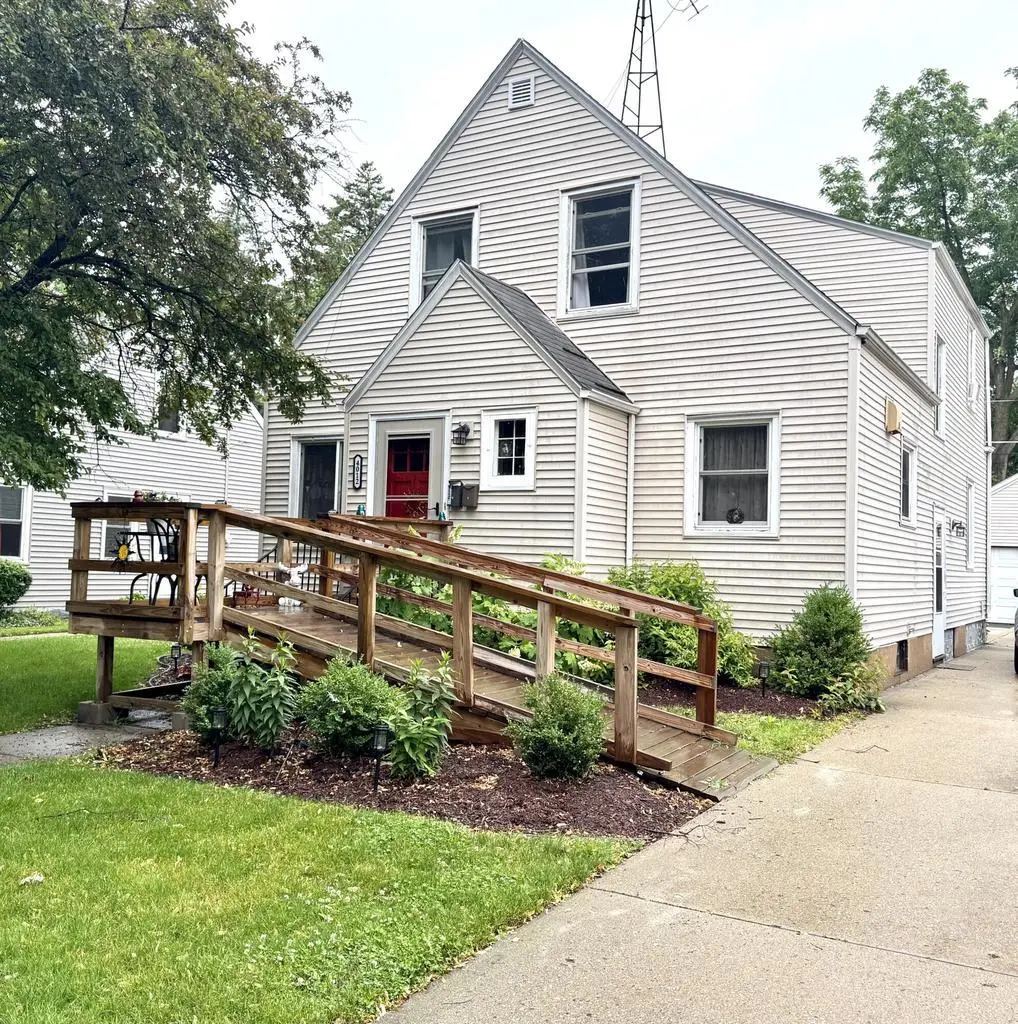
4012 Taft Rd · Kenosha, WI
Flood risk 1/10 · Minimal
- FEMA flood zone
- X (unshaded)
- Chance of flooding over 30 yrs
- 0.0%
- Est. flood insurance / yr
- $473 – $860
Fire risk 1/10 · Minimal
- Est. fire insurance / yr
- $636 – $1,182
Heat risk 2/10 · Minimal
- Hot days now (above 96°F)
- 7 days/yr
- Hot days in 30 yrs
- 14 days/yr
Wind risk 2/10 · Minimal
- Chance of severe wind over 30 yrs
- —
Air-quality risk 3/10 · Minor
- Unhealthy air days now
- 2 days/yr
- Unhealthy air days in 30 yrs
- 3 days/yr
Risk factors via First Street. Map © Google.
Why this score? — see what drove the F grade
The composite is a weighted blend of 9 inputs, each scored 0–100. Each bar is that input's sub-score; the figure is the points it added to the 100-point composite (weight × sub-score).
- Cash flow +12.7/30.0
- Livability +4.2/5.0
- DSCR +3.8/10.0
- Rent growth +3.5/5.0
- 1% rule +3.1/10.0
- Schools +2.5/10.0
- Condition / age +2.5/5.0
- ARV discount +0.0/15.0
- Appreciation +0.0/10.0
$349,900
🖨 Deal sheet 📄 Offer letter ✓ Due diligence
Multi-family units
County records classify this as Multi-Family (2-4 Unit). Listing-text estimate: 2 units. confirmed
Listing remarks MLS
You won't find a cleaner, better kept 2 family for anywhere near this price!2nd owner, many updates, was owner & family occupied for 20+ years.
Key facts
- Office den space
- Rec room
- Handicap accessible
Tags
Property features AI
Finance
- Other: Listing includes 1 refrigerator, 1 stove, 1 dishwasher, 1 microwave, 1 washer and 1 dryer; lower unit refrigerator and stove belong to tenant
Exterior
- Parking: Attached 2-car garage with opener (2 garage parking spaces total)
- Utilities: Municipal water; Municipal sewer; 1 electric meter; 1 gas meter
- Home design: 2-story duplex; Multi-family property; Zoning: RS3
- Construction: Information sourced from assessor/public record
- Exterior features: Vinyl exterior; Lot about 0.14 acres (less than 1/2 acre)
Interior
- Kitchen: Unit 2 kitchen on upper level (approx. 13 x 11); Refrigerators, stoves, dishwasher, microwave included (see exclusions for lower unit appliances)
- Bedrooms: Unit 1: 2 bedrooms; Unit 2: 1 bedroom (master on upper level, approx. 12 x 10)
- Bathrooms: Unit 1: 1 full bath and 1 half bath; Unit 2: 1 full bath; Half bath on lower level
- Interior features: Full basement
- Laundry & utility: Washer and dryer included
Neighborhood map
What this means for you Summary
Snapshot
- This is a 1×2.0bd/1.0ba + 1×1.0bd/1.0ba units multifamily listed at $350k.
Deal economics
- At list price, monthly cash flow is $-38 ($-453/yr) — negative. Per door: $-19/mo.
- To cash-flow at today's rent, offer at most $343k (1.9% below list).
- To meet the 1% rule (rent ≥ 1% of price), the offer needs to be $282k (19.4% below list).
- Recommended offer: $282k (19.4% below list) — sets the bar for 1% rule.
- Cap rate 6.2% vs local median 4.0% in Kenosha — top-decile yield for the area; either an underpriced asset or a hidden risk that comps aren't pricing in. Stress-test before assuming the spread holds.
Location & tenants
- Location reads 84/100 on livability (#31 in WI, #680 nationally) — a professional / high-income tenant draw. Strengths: commute A+, cost of living A+, housing A+; Watch: employment C-, schools D+.
- Kenosha School District (suburban): math 26% / reading 31% proficiency, ranked #287 of 342 in WI (top 84%) — low school quality limits family demand, transient renter base, plan for 1-2y turnover.
- Market conditions: Rents rising fast (+4.1%/yr); 67 active listings in the ZIP; 7 comparable units currently listed for rent nearby; rentals at typical pace (median 19d on market — plan ~3-4 weeks tenant-placement turnaround); solid renter incomes; 259 units permitted in Kenosha County in 2024 (8 in 5+ unit buildings).
- This rent runs 38% of the median local income ($89k/yr) — at the standard rent-burdened threshold; future hikes will face affordability resistance.
Forward outlook
- Local home prices are declining (-3.0%/yr); year-one equity from $2k of loan paydown is wiped out by about $10k of value loss. Plan a longer hold.
Negotiation context
- Only 1 days on market — expect competitive offers; lowballing is unlikely to land.
- 2 sale attempts since 12y ago with the ask held roughly flat each time — persistent listings suggest the price (not the market) is what's stuck; bring a comps-based counter.
- Current owner paid $150k; list at $350k implies a 133% gain — meaningful room to come down on a strong offer.
Risks & watch-outs
- Watch-outs: built in 1942 — expect roof / HVAC / electrical / plumbing capex.
Questions for the listing agent
- What do current leases actually rent for vs. the listed asking? Can we see a recent rent roll and the last 12 months of T-12 income?
- Can we see the unit-by-unit rent roll, current vacancy, and any below-market leases? What's the average tenancy length?
- What capital expenditures (roof, boiler, parking lot, exteriors) have been made in the last 5 years, and what's planned in the next 2?
- Built in 1942 — when were the roof, HVAC, electrical panel, plumbing, and water heater last replaced?
- Is there a deadline driving the sale (1031 exchange, divorce, estate, relocation)? That informs how much negotiation room exists.
- Schools are D-rated, which usually means shorter tenancies and higher turnover. Who's the typical renter profile here, and what's been the actual vacancy rate?
- The area grade is low — what's the realistic commute time and amenity access for the typical tenant pool here? Any planned neighborhood developments (good or bad) we should know about?
- What's the average days-on-market for RENTAL listings here right now (not sales)? A rising rental-DOM trend means longer vacancies and softer asking-rent achievability than the comps imply.
- What's the recent tenant-quality profile in this submarket — average credit score on applications, eviction rate, late-payment / NSF rate, and stable-employment percentage? A property-management company in the area should have these aggregated.
- How much new apartment / multifamily construction is in the pipeline within 1–3 miles? Heavy new supply (>2% of stock underway) typically softens rents 12–24 months out; light construction supports rent growth.
Investment metrics
- 1% rule
- 0.81% ✗
- Cap rate
- 6.16%
- Cash-on-cash
- -0.46%
- DSCR
- 0.98
- GRM
- 10.3
CMA / ARV
- ARV (on-the-fly)
- $235,152
- Comps found
- 6
Show comp detail 6 sales within ~0.75 mi
| Address | Dist | Beds/Ba | Sqft | Sold | Price | $/sf | Match |
|---|---|---|---|---|---|---|---|
| 6716 36th Ave | 0.44mi | 4/2.0 (+1) | 1,804 (+6%) | 7mo | $154,900 | $86 | 59 |
| 5513 37th Ave | 0.54mi | 4/2.0 (+1) | 1,731 (+2%) | 13mo | $265,333 | $153 | 57 |
| 6046 31st Ave | 0.54mi | 3/2.0 | 1,477 (-13%) | 3mo | $212,000 | $144 | 50 |
| 5402 36th Ave | 0.63mi | 4/2.0 (+1) | 1,697 (-0%) | 20mo | $216,000 | $127 | 48 |
| 6801 36th Ave | 0.49mi | 3/2.0 | 1,948 (+14%) | 11mo | $220,000 | $113 | 44 |
| 6710 29th Ave | 0.75mi | 4/2.0 (+1) | 1,558 (-9%) | 6mo | $215,000 | $138 | 41 |
Match score weights: distance 35% · size 25% · config 20% · recency 20%. Top-matched comps best support the ARV.
Projected returns pro-forma
-3.0% appreciation · 4.12% rent growth · sell at horizon
- IRR
- -15.9%
- Equity multiple
- 0.43×
- Total profit
- $-55,937
- Equity at exit
- $52,171
- IRR
- -5.8%
- Equity multiple
- 0.61×
- Total profit
- $-38,514
- Equity at exit
- $30,253
Cash invested: $97,972 (down + closing). Projections, not guarantees.
Landlord ↔ Tenant lean methodology
- Overall (STATE)
- 73 Landlord-Friendly
- State Wisconsin
- 73 Landlord-Friendly · R+2
- County
- — inherits STATE
- City
- — inherits STATE
ZIP-level market 53142
- Rents YoY
- 4.1%
- Active inventory
- 67
- Price-to-rent
- 19.6×
Monthly cashflow live
- Estimated rent
- $2,821 high interval (Pro) →
- Mortgage (P&I)
- −$1,835
- Tax from tax record
- −$286 /mo · $3,427/yr
- Insurance
- −$146
- HOA
- −$0
- Vacancy / Maint / Mgmt
- −$592
- Net cashflow
- $-38
Break-even live
2-unit breakdown (identical units grouped — click to expand)
| Units | Beds | Baths | Est. rent |
|---|---|---|---|
| 1× unit | 2.0 | 1 | $1,489 |
| 1× unit | 1.0 | 1 | $1,332 |
| Total (2 units) | $2,821 | ||
UW: 25.0% down · 7.5% · 30yr · 1.5% tax · 5.0% vac · 8.0% maint · 8.0% mgmt
Financing live
Cash to close
- Down payment
- $87,475
- Closing costs
- $10,497
- Reserves months
- —
- Total cash needed
- —
Loan-product check · same deal, 3 products live
Conventional
25% down · 7.5% · 30yr
- Down + closing
- —
- Monthly P&I
- —
- Monthly cashflow
- —
- DSCR
- —
- Eligible?
- —
Personal DTI + credit; lowest rate.
DSCR
20% down · 8.5% · 30yr
- Down + closing
- —
- Monthly P&I
- —
- Monthly cashflow
- —
- DSCR
- —
- Eligible?
- —
No personal income docs; deal must DSCR.
Hard money
10% down · 12.0% · 12mo
- Down + closing
- —
- Monthly P&I
- —
- Monthly cashflow
- —
- DSCR
- —
- Eligible?
- —
Short-term bridge; refi at stabilization.
Rent comps 7 comps
| Address | Beds | Baths | Sqft | Rent | $/sqft | DOM | Units | Dist |
|---|---|---|---|---|---|---|---|---|
| 7733 37th Ave Kenosha, WI | 2.0 | 1.0 | 1200 | $2,000 | $1.67 | 12d | 1 | 1.07mi |
| 5432 23rd Ave Kenosha, WI | 4.0 | 2.0 | 1400 | $1,695 | $1.21 | 4d | 1 | 1.12mi |
| 5807 20th Ave Unit 2 Kenosha, WI | 3.0 | 1.0 | 1064 | $2,400 | $2.26 | 19d | 1 | 1.24mi |
| 5807 20th Ave Unit 1 Kenosha, WI | 2.0 | 1.0 | 1064 | $2,000 | $1.88 | 19d | 1 | 1.24mi |
| 2708 48th St Kenosha, WI | 4.0 | 2.0 | 1200 | $2,500 | $2.08 | 22d | 1 | 1.27mi |
| 1809 60th St Kenosha, WI | 3.0 | 1.0 | 1100 | $1,500 | $1.36 | 43d | 1 | 1.31mi |
| 1510 57th St Unit 2 Kenosha, WI | 4.0 | 2.0 | 1700 | $1,800 | $1.06 | 43d | 1 | 1.49mi |
Listing history 2 events
-
2026-06-18remarks 530-char remark
-
2026-06-18$349,900 Active 1 DOM
ⓘ Source: listings_history table (triggers on properties + properties_extension) + one-shot
backfill from property_details.listing_events for pre-trigger history.
Tax reassessment forecast WI · Partial reset (capped growth)
- Current annual tax
- $3,427 · $286/mo
- Projected year-2 tax
- $4,950 · $413/mo
- Expected delta
- +$1,523/yr (+$127/mo · 44.4%)
ⓘ Screening estimate from a state-policy table — verify with the county assessor before closing.
Climate risk First Street
- Flood 1/10 Low FEMA zone X (unshaded) · 0% chance over 30 yrs
- Wildfire 1/10 Low
- Heat 2/10 Low 7 d/yr ≥96°F today · 14 d/yr by 30 yrs out
- Wind 2/10 Low
- Air quality 3/10 Moderate 2 unhealthy d/yr today · 3 by 30 yrs out
Nearby sold comps map
Loading sold comps map…
Walkable amenities ~0.75 mi
Loading nearby amenities…
Taxation est. · year 1
- Rental income
- $33,852
- − Mortgage interest
- −$19,600
- − Property taxes
- −$3,427
- − Insurance
- −$1,750
- − Repairs & maintenance
- −$2,708
- − Management
- −$2,708
- − Depreciation
- −$10,179
- Taxable loss
- −$6,520
- Est. tax savings @ 24.0%
- +$1,565
- After-tax cash flow
- $1,112/yr
For passive investors: Depreciation is non-cash, so a rental often shows a tax loss while cash-flowing — sheltering income. Rental losses are passive: they offset passive income freely, and up to $25,000/yr can offset ordinary (W-2) income if you actively participate and your MAGI is under $100k (phasing out to $0 by $150k); unused losses carry forward. On sale, claimed depreciation is recaptured at up to 25%, and gains may owe capital-gains tax (a 1031 exchange can defer both). Figures are a year-1 estimate at your 24.0% rate — not tax advice; consult a CPA.
Schools (NCES district)
- District
- Kenosha School District
- NCES district ID
- 5507320
- Math proficiency
- 26% ▼ -9.00%
- Reading proficiency
- 31% ▼ -6.00%
- Median HH income
- $52,407
- Composite
- 25.17/100
- National rank
- #7516
- State rank
- #287 of 342 in WI
Livability — Kenosha
- Score
- 84/100
- State rank
- #31
- US rank
- #680
Category grades
Schools grade is shown separately in the Schools card above.
Census & demographics
- Census place
- Kenosha, WI
- County
- Kenosha County · 130,343 people
- City population
- 85,271
- Metro
- Chicago-Naperville-Elgin, IL-IN-WI
- Population (ZIP)
- 34,144
- Household income
- $88,960
- Rent vs Own
- Severe rent burden
- 725.0
Population outlook (Kenosha County) Hauer SSP2
- Today (2025)
- 174,032 people
- By 2030
- 174,923 · +0.5%
- By 2040
- 173,895 · -0.1%
- By 2050
- 170,102 · -2.3%
- By 2075
- 162,952 · -6.4%
- By 2100
- 154,781 · -11.1%
Race, ethnicity, and origin ACS 2023
- Neighborhood character
- Predominantly White (70%)
- Race & ethnicity
- White 70% Hispanic / Latino 16% Two or more races 14% Black 6% Asian 3%
- Hispanic origin (detail)
- Mexican 12% Puerto Rican 2%
- Common ancestry
- Romanian 7% Portuguese 2% Lithuanian 2%
- Foreign-born
- 10% · Canada, China
- Languages at home
- 83% English-only · Spanish 12% Other Indo-European 1% Other Asian/Pacific 1%
Political lean MEDSL · Kenosha
- 2024 margin
- Lean R (+6.2) · D 46.2% · R 52.5% · Other 1.3%
- 2008→2024 swing
- -24.3pp toward R · 2008: 18.1pp · 2024: -6.2pp
- All cycles
- 2024: R+6.2 2020: R+3.1 2016: R+0.3 2012: D+12.3 2008: D+18.1
Not yet ingested
- Civics
- —
Market trends
- HPI YoY
- ▼ -224.61%
- Current HPI
- 238.3837
- Rent YoY
- ▲ 4.12%
- Metro
- Chicago-Naperville-Elgin, IL-IN-WI
- State GDP YoY
- ▲ 2.10%
- F500 in state
- 20
Industry mix (Fortune 500 HQ in WI)
| Industry | F500 HQs | Revenue |
|---|---|---|
| Industrial Machinery | 4 | $23B |
|
||
| Industrial Technology | 2 | $36B |
|
||
| Insurance | 1 | $36B |
|
||
| Professional Services | 1 | $19B |
|
||
| Utilities | 1 | $9B |
|
||
| Consumer Goods | 1 | $3B |
|
||
Price history
+446.7% since first listed7 events — show timeline
- 2026-06-17 Listed $349,900 METROMLS
- 2021-09-02 Sold (Public Records) $150,000 Public Records
- 2014-01-04 Listing Removed — METROMLS
- 2014-01-04 Listed $115,000 METROMLS
- 2012-03-27 Sold (Public Records) $105,000 Public Records
- 2012-03-20 Sold (MLS) $105,000 METROMLS
- 1984-05-01 Sold (Public Records) $64,000 Public Records
Property tax history
-0.1%/yrLatest (2025): $3,427 · -2.7% YoY. Source: county tax records.
Cash-flow waterfall
monthlySold comps — $/sqft
last 12 mo · ≤1 miLoading sold comps…