10767 Aqueduct Crk · San Antonio, TX
Flood risk No data
- FEMA flood zone
- —
- Chance of flooding over 30 yrs
- —
- Est. flood insurance / yr
- —
Fire risk No data
- Est. fire insurance / yr
- —
Heat risk No data
- Hot days now (above threshold)
- —
- Hot days in 30 yrs
- —
Wind risk No data
- Chance of severe wind over 30 yrs
- —
Air-quality risk No data
- Unhealthy air days now
- —
- Unhealthy air days in 30 yrs
- —
Risk factors via First Street. Map © Google.
Why this score? — see what drove the C- grade
The composite is a weighted blend of 9 inputs, each scored 0–100. Each bar is that input's sub-score; the figure is the points it added to the 100-point composite (weight × sub-score).
- Cash flow +16.5/30.0
- ARV discount +15.0/15.0
- 1% rule +5.3/10.0
- DSCR +5.1/10.0
- Livability +4.0/5.0
- Condition / age +4.0/5.0
- Rent growth +2.5/5.0
- Schools +1.8/10.0
- Appreciation +0.0/10.0
$158,499
🖨 Deal sheet (PDF) 📄 Offer letter ✓ Due diligence
Listing remarks
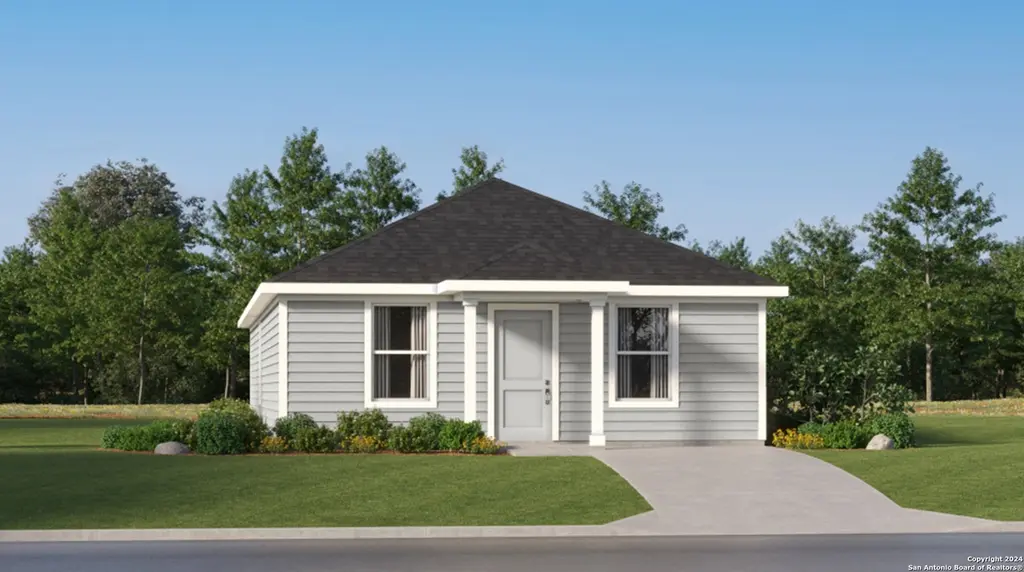
The Timms- This convenient single-story plan opens to three secondary bedrooms framing the entryway. Down the hall, an open peninsula-style kitchen overlooks an inviting dining area and a spacious family room, ideal for seamless modern living. The owner's suite is ideally situated in the back corner to provide a serene retreat, featuring a bedroom, attached bathroom and a walk-in closet. Estimated Completion July 2026. The completion date, prices and features may vary and are subject to change. Please verify with Lennar directly. Photos are for illustrative purposes only.
Key facts
- 4,791 sq ft lot
- Community pool
- Built 2026
Property features AI
Finance
- Other: Subdivision: Espada
- HOA & community: Mandatory HOA; Quarterly HOA fee of $300; Association transfer fee: $450; Community amenities include pool, tennis, clubhouse, and park/playground
Exterior
- Utilities: Water service: SAWS; Sewer: City sewer system; Gas supplier: CPS; Electric supplier: CPS; Garbage service: Frontier
- Home design: Single-family home (new construction by Lennar); Cement fiber exterior; Composition roof; Slab foundation
- Construction: Built by Lennar; New construction
- Exterior features: Privacy fence
Interior
- Kitchen: Kitchen dimensions: 9 x 9; Stove/Range; Dishwasher
- Bedrooms: Master bedroom on lower level with walk-in closet and full bath; Bedroom 2: 10 x 12; Bedroom 3: 10 x 11; Bedroom 4: 10 x 11; Master bedroom dimensions: 11 x 13
- Flooring: Carpeting; Vinyl flooring
- Bathrooms: 2 full bathrooms; Master bath with tub/shower combination (7 x 5)
- Heating & cooling: Central heating; Electric and natural gas heating; Central air conditioning
- Interior features: Open floor plan; Breakfast bar; One living area; Cable TV available; Utility room inside; Walk-in closets
- Laundry & utility: Washer connection; Dryer connection; Laundry on main level
Neighborhood map
What this means for you Summary
Snapshot
- This is a 4-bed/2.0-bath single-family listed at $158k. Condition is rated good.
Deal economics
- At list price, monthly cash flow is $92 ($1k/yr) — positive.
- The deal already cash-flows at list — no discount required.
- Meets the 1% rule at list price ($2k rent vs $158k).
- Recommended offer: $154k (3.0% below list) — sets the bar for market timing.
- Cap rate 7.0% vs local median 3.8% in San Antonio — top-decile yield for the area; either an underpriced asset or a hidden risk that comps aren't pricing in. Stress-test before assuming the spread holds.
Location & tenants
- Location reads 80/100 on livability (#31 in TX, #1,616 nationally) — a professional / high-income tenant draw. Strengths: amenities A+, commute A+, cost of living A+; Watch: crime F.
- Southside ISD (rural): math 16% / reading 25% proficiency, ranked #771 of 826 in TX (top 93%) — low school quality limits family demand, transient renter base, plan for 1-2y turnover; 76% free/reduced lunch — lower-income household profile, screen leases tightly.
- Zoned schools: Julian C Gallardo El (math 13% / reading 22%, grade F, #3,805 of 4,322 statewide, top 89%, 544 students, 87% FRL); Julius L Matthey Middle (math 17% / reading 25%, grade F, #1,387 of 1,662 statewide, top 85%, 604 students, 92% FRL); Southside H S (math 18% / reading 25%, grade F, #1,377 of 1,632 statewide, top 85%, 1,685 students, 85% FRL).
- Market conditions: 151 active listings in the ZIP; 12 comparable units currently listed for rent nearby; rentals at typical pace (median 24d on market — plan ~3-4 weeks tenant-placement turnaround); lower-income renter base — watch delinquency; 8,308 units permitted in Bexar County in 2024 (2,506 in 5+ unit buildings).
- This rent runs 44% of the median local income ($45k/yr) — at the standard rent-burdened threshold; future hikes will face affordability resistance.
Forward outlook
- Local home prices are declining (-3.0%/yr); year-one equity from $1k of loan paydown is wiped out by about $5k of value loss. Plan a longer hold.
- Bexar County population projected at +50% by 2050 — long-run rental-demand tailwind backs the buy-and-hold thesis.
Negotiation context
- It's been on market 50 days — a 3% lower offer ($154k) is reasonable based on typical stale-listing flexibility.
Questions for the listing agent
- It's been on market 50 days. Have you received any prior offers? Is the seller open to a 3% concession, seller financing, or rate buy-down credit?
- What does the HOA fee cover, when was the last increase, and are there any pending special assessments or reserve-fund shortfalls?
- Is there a deadline driving the sale (1031 exchange, divorce, estate, relocation)? That informs how much negotiation room exists.
- Crime grade is F in this area — have there been break-ins, vandalism, or insurance claims at this property in the last 3 years? What carrier currently insures it and at what premium?
- What's the average days-on-market for RENTAL listings here right now (not sales)? A rising rental-DOM trend means longer vacancies and softer asking-rent achievability than the comps imply.
- What's the recent tenant-quality profile in this submarket — average credit score on applications, eviction rate, late-payment / NSF rate, and stable-employment percentage? A property-management company in the area should have these aggregated.
- How much new for-sale + rental construction is in the pipeline within 1–3 miles? Heavy new supply typically softens prices + rents 12–24 months out; constrained supply supports both.
Investment metrics
- 1% rule
- 1.03% ✓
- Cap rate
- 6.99%
- Cash-on-cash
- 2.48%
- DSCR
- 1.11
- GRM
- 8.1
CMA / ARV
- ARV (median comp)
- $226,999
- List price
- $158,499
- Delta
- -30.18%
- Verdict
- UNDERPRICED
- Comps
- 20 within 1.0 mi
Show comp detail 12 sales within ~0.75 mi
| Address | Dist | Beds/Ba | Sqft | Sold | Price | $/sf | Match |
|---|---|---|---|---|---|---|---|
| 10713 Aqueduct Crk | 0.09mi | 4/2.0 | 1,483 (-1%) | 1mo | $202,499 | $137 | 93 |
| 10470 Pacaos Pl | 0.11mi | 4/2.0 | 1,483 (-1%) | 2mo | $205,999 | $139 | 92 |
| 10331 Bustillos Cv | 0.24mi | 4/2.0 | 1,483 (-1%) | 2mo | $191,999 | $129 | 86 |
| 10636 Ysasmendi Rdg | 0.03mi | 3/2.0 (-1) | 1,634 (+9%) | 1mo | $227,999 | $140 | 78 |
| 10717 Aqueduct Crk | 0.08mi | 4/2.5 | 1,692 (+13%) | 1mo | $223,499 | $132 | 72 |
| 10705 Aqueduct Crk | 0.11mi | 4/2.5 | 1,692 (+13%) | 0mo | $215,499 | $127 | 71 |
| 10636 Fannin Way | 0.33mi | 4/2.0 | 1,386 (-8%) | 1mo | $169,999 | $123 | 71 |
| 10628 Fannin Way | 0.33mi | 4/2.0 | 1,386 (-8%) | 1mo | $176,999 | $128 | 71 |
| 10462 Pacaos Pl | 0.11mi | 4/2.5 | 1,692 (+13%) | 1mo | $211,999 | $125 | 71 |
| 10418 Pacaos Pl | 0.22mi | 3/2.0 (-1) | 1,380 (-8%) | 2mo | $157,999 | $114 | 70 |
| 10628 Munoz Mnr | 0.19mi | 3/2.0 (-1) | 1,634 (+9%) | 2mo | $235,999 | $144 | 70 |
| 10442 Pacaos Pl | 0.17mi | 4/2.5 | 1,692 (+13%) | 1mo | $217,999 | $129 | 68 |
Match score weights: distance 35% · size 25% · config 20% · recency 20%. Top-matched comps best support the ARV.
Projected returns pro-forma
-3.0% appreciation · 3.0% rent growth · sell at horizon
- IRR
- -12.3%
- Equity multiple
- 0.55×
- Total profit
- $-19,758
- Equity at exit
- $23,633
- IRR
- -3.1%
- Equity multiple
- 0.79×
- Total profit
- $-9,336
- Equity at exit
- $13,704
Cash invested: $44,380 (down + closing). Projections, not guarantees.
Landlord ↔ Tenant lean methodology
- Overall (STATE)
- 87 Strongly Landlord-Friendly
- State Texas
- 87 Strongly Landlord-Friendly · R+5
- County
- — inherits STATE
- City
- — inherits STATE
ZIP-level market 78214
- Home prices YoY
- -4.6%
- Active inventory
- 151
- Price-to-rent
- 8.1×
Monthly cashflow live
- Estimated rent
- $1,629 high interval (Pro) →
- Mortgage (P&I)
- −$831
- Tax est. 1.5%
- −$198 /mo · $2,377/yr
- Insurance
- −$66
- HOA
- −$100
- Vacancy / Maint / Mgmt
- −$342
- Net cashflow
- $92
Break-even live
Sensitivity live
| Price | -10% $201 | -5% $146 | +0% $92 | +5% $37 | +10% $-18 |
|---|---|---|---|---|---|
| Rent | -10% $-37 | -5% $27 | +0% $92 | +5% $156 | +10% $220 |
| Rate | -1.0pp $172 | -0.5pp $132 | base $92 | +0.5pp $51 | +1.0pp $9 |
UW: 25.0% down · 7.5% · 30yr · 1.5% tax · 5.0% vac · 8.0% maint · 8.0% mgmt
Financing live
Cash to close
- Down payment
- $39,625
- Closing costs
- $4,755
- Reserves months
- —
- Total cash needed
- —
Loan-product check · same deal, 3 products live
Conventional
25% down · 7.5% · 30yr
- Down + closing
- —
- Monthly P&I
- —
- Monthly cashflow
- —
- DSCR
- —
- Eligible?
- —
Personal DTI + credit; lowest rate.
DSCR
20% down · 8.5% · 30yr
- Down + closing
- —
- Monthly P&I
- —
- Monthly cashflow
- —
- DSCR
- —
- Eligible?
- —
No personal income docs; deal must DSCR.
Hard money
10% down · 12.0% · 12mo
- Down + closing
- —
- Monthly P&I
- —
- Monthly cashflow
- —
- DSCR
- —
- Eligible?
- —
Short-term bridge; refi at stabilization.
Rent comps 12 comps
| Address | Beds | Baths | Sqft | Rent | $/sqft | DOM | Units | Dist |
|---|---|---|---|---|---|---|---|---|
| 10628 Aqueduct Crk San Antonio, TX | 4.0 | 2.0 | 1500 | $1,700 | $1.13 | 45d | 1 | 0.18mi |
| 1803 Marshall Cross San Antonio, TX | 1.0–3.0 | 1.0–2.0 | 942 | $1,425 | $1.51 | 3d | 38 | 0.72mi |
| 1622 Saenz San Antonio, TX | 3.0 | 2.0 | 1298 | $1,475 | $1.14 | 23d | 1 | 0.88mi |
| 1119 Jordan Xing San Antonio, TX | 3.0 | 2.0 | 1276 | $1,795 | $1.41 | 45d | 1 | 1.08mi |
| 12910 Clubhouse Blvd San Antonio, TX | 1.0–3.0 | 1.0–2.0 | 920 | $1,364 | $1.48 | 0d | 26 | 1.17mi |
| 1015 Catalonia Pass San Antonio, TX | 3.0 | 2.0 | 1280 | $1,600 | $1.25 | 6d | 1 | 1.37mi |
| 1011 Catalonia Pass San Antonio, TX | 3.0 | 2.5 | 1470 | $1,700 | $1.16 | 25d | 1 | 1.38mi |
| 10431 Lateleaf Oak San Antonio, TX | 4.0 | 2.5 | 2021 | $2,000 | $0.99 | 45d | 1 | 1.39mi |
| 10306 Buescher Ln San Antonio, TX | 3.0 | 2.5 | 1571 | $1,550 | $0.99 | 16d | 1 | 1.41mi |
| 10208 Lateleaf Oak San Antonio, TX | 3.0 | 2.5 | 1596 | $1,595 | $1.00 | 45d | 1 | 1.46mi |
| 10216 Lateleaf Oak San Antonio, TX | 3.0 | 2.5 | 1417 | $1,495 | $1.06 | 19d | 1 | 1.46mi |
| 12911 Lorena Ochoa San Antonio, TX | 4.0 | 2.5 | 2002 | $2,100 | $1.05 | 0d | 1 | 1.48mi |
HOA detail
- Monthly dues
- $100 · $1,200/yr
Listing history 15 events
-
2026-06-13statusdays on market $158,499 Pending 50 DOM
-
2026-06-09statusdays on market $158,499 Active 49 DOM
-
2026-06-08days on market $158,499 Price Change 48 DOM
-
2026-06-07days on market $158,499 Price Change 47 DOM
-
2026-06-04days on market $158,499 Price Change 44 DOM
-
2026-06-03days on market $158,499 Price Change 43 DOM
-
2026-06-02days on market $158,499 Price Change 42 DOM
-
2026-06-01days on market $158,499 Price Change 41 DOM
-
2026-05-31days on market $158,499 Price Change 40 DOM
-
2026-05-13price $160,499 578-char remark
-
2026-05-12price $160,499 320-char remark
-
2026-05-06price $161,499 578-char remark
-
2026-05-05price $161,499 320-char remark
-
2026-05-04$180,999 Active 320-char remark
-
2026-04-21$180,999 New 578-char remark
ⓘ Source: listings_history table (triggers on properties + properties_extension) + one-shot
backfill from property_details.listing_events for pre-trigger history.
Nearby sold comps map
Loading sold comps map…
Walkable amenities ~0.75 mi
Loading nearby amenities…
Taxation est. · year 1
- Rental income
- $19,550
- − Mortgage interest
- −$8,878
- − Property taxes
- −$2,377
- − Insurance
- −$792
- − Repairs & maintenance
- −$1,564
- − Management
- −$1,564
- − HOA
- −$1,200
- − Depreciation
- −$4,611
- Taxable loss
- −$1,437
- Est. tax savings @ 24.0%
- +$345
- After-tax cash flow
- $1,445/yr
For passive investors: Depreciation is non-cash, so a rental often shows a tax loss while cash-flowing — sheltering income. Rental losses are passive: they offset passive income freely, and up to $25,000/yr can offset ordinary (W-2) income if you actively participate and your MAGI is under $100k (phasing out to $0 by $150k); unused losses carry forward. On sale, claimed depreciation is recaptured at up to 25%, and gains may owe capital-gains tax (a 1031 exchange can defer both). Figures are a year-1 estimate at your 24.0% rate — not tax advice; consult a CPA.
Condition & rehab AI · 12 photos
This single-story home is in good condition with a modern design and well-maintained exterior. It has the potential for further value increases through cosmetic updates and smart home technology.
Value-add opportunities
- Both Paint exterior siding — Fresh paint can enhance curb appeal and property value.
- Both Replace carpet with hardwood flooring — Hardwood flooring is more durable and can increase both resale and rental value.
- Both Install smart home technology — Smart home features can increase both resale and rental value by making the home more modern and convenient.
Renovation cost estimate screening
Value-add ROI direction
- Both Paint exterior siding — Fresh paint can enhance curb appeal and property value. ↑
- Both Replace carpet with hardwood flooring — Hardwood flooring is more durable and can increase both resale and rental value. ↑
- Both Install smart home technology — Smart home features can increase both resale and rental value by making the home more modern and convenient. ↑
ⓘ Cost ranges are severity-bucket heuristics (US national rule-of-thumb). Get contractor quotes + a written scope before underwriting a rehab budget.
Schools (NCES district)
- District
- Southside ISD
- NCES district ID
- 4840920
- Math proficiency
- 16% ▼ -15.00%
- Reading proficiency
- 25% ▼ -2.00%
- Median HH income
- $43,526
- Composite
- 17.68/100
- National rank
- #9027
- State rank
- #771 of 826 in TX
Livability — San Antonio
- Score
- 80/100
- State rank
- #31
- US rank
- #1616
Category grades
Schools grade is shown separately in the Schools card above.
Census & demographics
- County
- Bexar County · 1,990,555 people
- City population
- 1,806,925
- Metro
- San Antonio-New Braunfels, TX
- Population (ZIP)
- 22,118
- Household income
- $44,902
- Rent vs Own
- Severe rent burden
- 842.0
Population outlook (Bexar County) Hauer SSP2
- Today (2025)
- 2,336,851 people
- By 2030
- 2,560,728 · +9.6%
- By 2040
- 3,020,569 · +29.3%
- By 2050
- 3,493,522 · +49.5%
- By 2075
- 4,668,459 · +99.8%
- By 2100
- 5,533,242 · +136.8%
Race, ethnicity, and origin ACS 2023
- Neighborhood character
- Predominantly Hispanic (87%)
- Race & ethnicity
- Hispanic / Latino 87% Two or more races 24% White 11%
- Hispanic origin (detail)
- Mexican 71%
- Common ancestry
- Lithuanian 1% Romanian 1%
- Foreign-born
- 13% · Canada
- Languages at home
- 46% English-only · Spanish 54%
Political lean MEDSL · Bexar
- 2024 margin
- Lean D (+9.8) · D 54.3% · R 44.6% · Other 1.1%
- 2008→2024 swing
- +4.2pp toward D · 2008: 5.6pp · 2024: 9.8pp
- All cycles
- 2024: D+9.8 2020: D+18.2 2016: D+13.5 2012: D+4.6 2008: D+5.6
Not yet ingested
- Civics
- —
Market trends
- HPI YoY
- ▼ -12.02%
- Current HPI
- 247.2716
- Rent YoY
- —
- Metro
- San Antonio-New Braunfels, TX
- State GDP YoY
- ▲ 3.95%
- F500 in state
- 110
Industry mix (Fortune 500 HQ in TX)
| Industry | F500 HQs | Revenue |
|---|---|---|
| Energy | 16 | $1,198B |
|
||
| Technology | 5 | $198B |
|
||
| Engineering / Construction | 4 | $72B |
|
||
| Energy Services | 3 | $60B |
|
||
| Utilities | 3 | $41B |
|
||
| Healthcare | 2 | $330B |
|
||
Price history
-12.4% since first listed5 events — show timeline
- 2026-06-11 Pending — LERA
- 2026-05-30 Price Changed $158,499 LERA
- 2026-05-13 Price Changed $160,499 LERA
- 2026-05-06 Price Changed $161,499 LERA
- 2026-04-21 Listed $180,999 LERA
Cash-flow waterfall
monthlySold comps — $/sqft
last 12 mo · ≤1 miLoading sold comps…