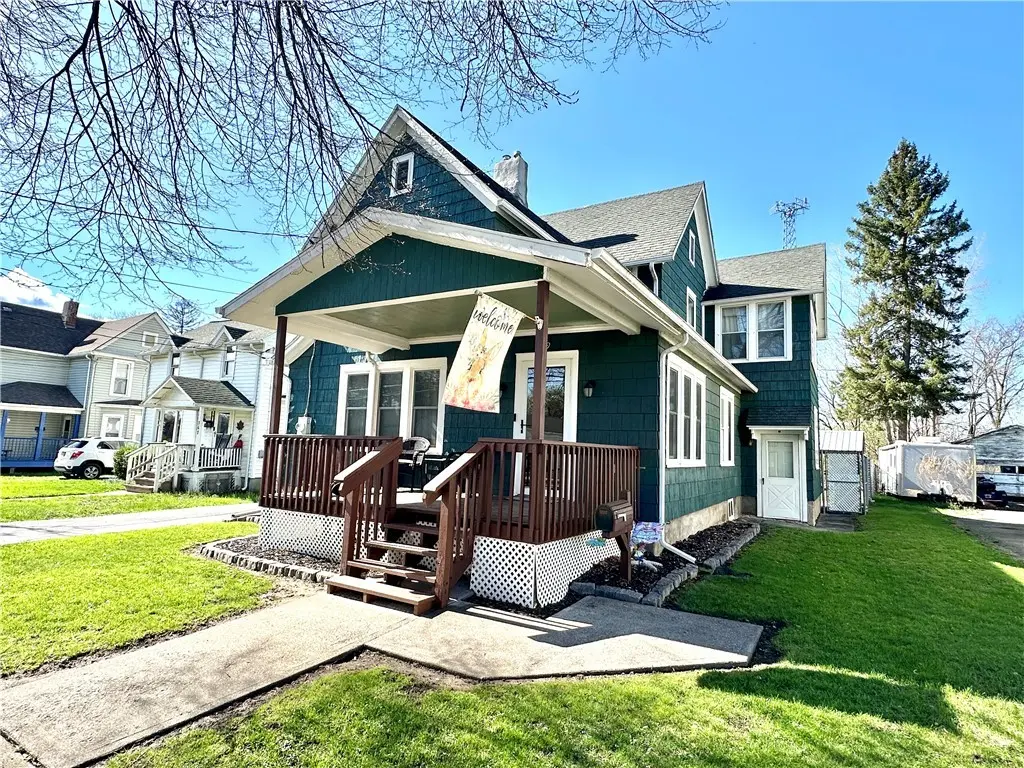
369 E Warren St · Elmira, NY
Flood risk 5/10 · Moderate
- FEMA flood zone
- X (shaded)
- Chance of flooding over 30 yrs
- 0.24%
- Est. flood insurance / yr
- $473 – $860
Fire risk 3/10 · Minor
- Est. fire insurance / yr
- $691 – $1,283
Heat risk 3/10 · Minor
- Hot days now (above 96°F)
- 7 days/yr
- Hot days in 30 yrs
- 15 days/yr
Wind risk 1/10 · Minimal
- Chance of severe wind over 30 yrs
- 0.0%
Air-quality risk 1/10 · Minimal
- Unhealthy air days now
- 0 days/yr
- Unhealthy air days in 30 yrs
- 0 days/yr
Risk factors via First Street. Map © Google.
Why this score? — see what drove the A grade
The composite is a weighted blend of 9 inputs, each scored 0–100. Each bar is that input's sub-score; the figure is the points it added to the 100-point composite (weight × sub-score).
- Cash flow +30.0/30.0
- ARV discount +15.0/15.0
- 1% rule +10.0/10.0
- DSCR +10.0/10.0
- Appreciation +10.0/10.0
- Livability +3.1/5.0
- Rent growth +2.5/5.0
- Condition / age +2.5/5.0
- Schools +2.4/10.0
$115,000
🖨 Deal sheet 📄 Offer letter ✓ Due diligence
Listing remarks MLS
This charming and inviting home has been well maintained. Two story with 4 bedrooms and 2 full baths completely remodeled within the last 10 years to include roof, windows, front and back covered porches, cement patio and pavilion, black top driveway, furnace, hot water heater, electric box and switches. List just keeps going. .. .Kitchen and both baths, new sheet rock walls and ceiling and floors throughout. New roof and doors on garage as well. This home is a must see!
Key facts
- New furnace
- New hot water tank
- First floor laundry
Tags
Neighborhood map
What this means for you Summary
Snapshot
- This is a 4-bed/2.0-bath single-family listed at $115k.
Deal economics
- At list price, monthly cash flow is $520 ($6k/yr) — positive.
- The deal already cash-flows at list — no discount required.
- Meets the 1% rule at list price ($2k rent vs $115k).
- Recommended offer: $112k (3.0% below list) — sets the bar for market timing.
Location & tenants
- Location reads 62/100 on livability (#832 in NY) — a middle-class / working-renter tenant base. Strengths: cost of living A+, housing A+, health & safety A+; Watch: schools F, crime F, amenities F.
- Elmira City School District (urban): math 23% / reading 35% proficiency, ranked #580 of 590 in NY (top 98%) — low school quality limits family demand, transient renter base, plan for 1-2y turnover.
- Market conditions: 78 active listings in the ZIP; 91 units permitted in Chemung County in 2024 (63 in 5+ unit buildings).
Forward outlook
- In year one you build about $12k of equity ($795 loan paydown + $12k appreciation (10.0% local appreciation)).
- Chemung County population projected at -17% by 2050 — secular population decline; favor cash flow + early exit over multi-decade hold.
- At projected returns (10.0% appreciation + 3.0% rent growth), your $32k cash investment doubles in ~2 years — after that, you're playing with house money.
- By year 3, paydown + projected appreciation supports a ~$31k cash-out refi (75% LTV) — recoverable capital for the next deal without selling this one.
Negotiation context
- It's been on market 51 days — a 3% lower offer ($112k) is reasonable based on typical stale-listing flexibility.
- 3 sale attempts since 23y ago with the ask held roughly flat each time — persistent listings suggest the price (not the market) is what's stuck; bring a comps-based counter.
- Current owner paid $55k; list at $115k implies a 108% gain — meaningful room to come down on a strong offer.
Risks & watch-outs
- Watch-outs: built in 1891 — expect roof / HVAC / electrical / plumbing capex.
- Climate carrying-cost: moderate flood risk — expect insurance premiums to compound above CPI over the hold.
Questions for the listing agent
- It's been on market 51 days. Have you received any prior offers? Is the seller open to a 3% concession, seller financing, or rate buy-down credit?
- Built in 1891 — when were the roof, HVAC, electrical panel, plumbing, and water heater last replaced?
- Is there a deadline driving the sale (1031 exchange, divorce, estate, relocation)? That informs how much negotiation room exists.
- Schools are F-rated, which usually means shorter tenancies and higher turnover. Who's the typical renter profile here, and what's been the actual vacancy rate?
- Crime grade is F in this area — have there been break-ins, vandalism, or insurance claims at this property in the last 3 years? What carrier currently insures it and at what premium?
- What's the average days-on-market for RENTAL listings here right now (not sales)? A rising rental-DOM trend means longer vacancies and softer asking-rent achievability than the comps imply.
- What's the recent tenant-quality profile in this submarket — average credit score on applications, eviction rate, late-payment / NSF rate, and stable-employment percentage? A property-management company in the area should have these aggregated.
- How much new for-sale + rental construction is in the pipeline within 1–3 miles? Heavy new supply typically softens prices + rents 12–24 months out; constrained supply supports both.
Investment metrics
- 1% rule
- 1.50% ✓
- Cap rate
- 11.72%
- Cash-on-cash
- 19.39%
- DSCR
- 1.86
- GRM
- 5.6
CMA / ARV
- ARV (on-the-fly)
- $141,312
- Comps found
- 6
Show comp detail 6 sales within ~0.75 mi
| Address | Dist | Beds/Ba | Sqft | Sold | Price | $/sf | Match |
|---|---|---|---|---|---|---|---|
| 1213 Magee St | 0.48mi | 3/2.0 (-1) | 1,908 (-7%) | 6mo | $189,361 | $99 | 56 |
| 384 E Warren St | 0.07mi | 4/1.0 | 1,758 (-14%) | 16mo | $122,106 | $69 | 56 |
| 1230 Lake St | 0.38mi | 4/1.5 | 1,768 (-14%) | 13mo | $124,900 | $71 | 47 |
| 312 Westside Ave | 0.73mi | 4/1.0 | 2,216 (+8%) | 6mo | $25,000 | $11 | 44 |
| 325 Norton | 0.24mi | 3/2.0 (-1) | 1,759 (-14%) | 21mo | $41,500 | $24 | 43 |
| 1218 Lackawanna Ave | 0.40mi | 3/1.0 (-1) | 1,763 (-14%) | 15mo | $57,000 | $32 | 37 |
Match score weights: distance 35% · size 25% · config 20% · recency 20%. Top-matched comps best support the ARV.
Projected returns pro-forma
10.0% appreciation · 3.0% rent growth · sell at horizon
- IRR
- 38.7%
- Equity multiple
- 3.98×
- Total profit
- $95,820
- Equity at exit
- $103,601
- IRR
- 33.4%
- Equity multiple
- 8.96×
- Total profit
- $256,222
- Equity at exit
- $223,420
Cash invested: $32,200 (down + closing). Projections, not guarantees.
Landlord ↔ Tenant lean methodology
- Overall (STATE)
- 15 Strongly Tenant-Friendly
- State New York
- 15 Strongly Tenant-Friendly · D+10
- County
- — inherits STATE
- City
- — inherits STATE
ZIP-level market 14901
- Home prices YoY
- 15.9%
- Active inventory
- 78
- Price-to-rent
- 5.6×
Monthly cashflow live
- Estimated rent
- $1,721 medium interval (Pro) →
- Mortgage (P&I)
- −$603
- Tax from tax record
- −$188 /mo · $2,259/yr
- Insurance
- −$48
- HOA
- −$0
- Vacancy / Maint / Mgmt
- −$361
- Net cashflow
- $520
Break-even live
UW: 25.0% down · 7.5% · 30yr · 1.5% tax · 5.0% vac · 8.0% maint · 8.0% mgmt
Financing live
Cash to close
- Down payment
- $28,750
- Closing costs
- $3,450
- Reserves months
- —
- Total cash needed
- —
Loan-product check · same deal, 3 products live
Conventional
25% down · 7.5% · 30yr
- Down + closing
- —
- Monthly P&I
- —
- Monthly cashflow
- —
- DSCR
- —
- Eligible?
- —
Personal DTI + credit; lowest rate.
DSCR
20% down · 8.5% · 30yr
- Down + closing
- —
- Monthly P&I
- —
- Monthly cashflow
- —
- DSCR
- —
- Eligible?
- —
No personal income docs; deal must DSCR.
Hard money
10% down · 12.0% · 12mo
- Down + closing
- —
- Monthly P&I
- —
- Monthly cashflow
- —
- DSCR
- —
- Eligible?
- —
Short-term bridge; refi at stabilization.
Listing history 18 events
-
2026-06-12statusdays on market $115,000 Pending 51 DOM
-
2026-06-09days on market $115,000 Active Under Contract 50 DOM
-
2026-06-08days on market $115,000 Active Under Contract 49 DOM
-
2026-06-07days on market $115,000 Active Under Contract 48 DOM
-
2026-06-05days on market $115,000 Active Under Contract 45 DOM
-
2026-06-03days on market $115,000 Active Under Contract 44 DOM
-
2026-06-02days on market $115,000 Active Under Contract 43 DOM
-
2026-06-01days on market $115,000 Active Under Contract 42 DOM
-
2026-05-31days on market $115,000 Active Under Contract 41 DOM
-
2026-05-30days on market $115,000 Active Under Contract 40 DOM
-
2026-04-27historical Active Under Contract
-
2026-04-20$115,000 Active
-
2015-10-19soldstatus $55,250
-
2015-10-16soldstatus $58,550 475-char remark
Show marketing remark (475 chars)
This charming and inviting home has been well maintained. Two story with 4 bedrooms and 2 full baths completely remodeled within the last 10 years to include roof, windows, front and back covered porches, cement patio and pavilion, black top driveway, furnace, hot water heater, electric box and switches. List just keeps going. .. .Kitchen and both baths, new sheet rock walls and ceiling and floors throughout. New roof and doors on garage as well. This home is a must see!
-
2015-07-29$59,900 475-char remark
Show marketing remark (475 chars)
This charming and inviting home has been well maintained. Two story with 4 bedrooms and 2 full baths completely remodeled within the last 10 years to include roof, windows, front and back covered porches, cement patio and pavilion, black top driveway, furnace, hot water heater, electric box and switches. List just keeps going. .. .Kitchen and both baths, new sheet rock walls and ceiling and floors throughout. New roof and doors on garage as well. This home is a must see!
-
2003-11-24soldstatus $7,500 123-char remark
Show marketing remark (123 chars)
MUCH SMOKE AND WATER DAMAGE. SOME VANDALISM. HUG E ROOMS. PROPERTY HAS POTENTIAL. INVESTOR'S DREA M. LOCK BOX ON BACK DOOR.
-
2003-02-03$9,950 123-char remark
Show marketing remark (123 chars)
MUCH SMOKE AND WATER DAMAGE. SOME VANDALISM. HUG E ROOMS. PROPERTY HAS POTENTIAL. INVESTOR'S DREA M. LOCK BOX ON BACK DOOR.
-
1993-07-16soldstatus $30,000
ⓘ Source: listings_history table (triggers on properties + properties_extension) + one-shot
backfill from property_details.listing_events for pre-trigger history.
Tax reassessment forecast NY · Partial reset (capped growth)
- Current annual tax
- $2,259 · $188/mo
- Projected year-2 tax
- $2,259 · $188/mo
- Expected delta
- $0/yr ($0/mo · 0.0%)
ⓘ Screening estimate from a state-policy table — verify with the county assessor before closing.
Climate risk First Street
- Flood 5/10 Major FEMA zone X (shaded) · 24% chance over 30 yrs
- Wildfire 3/10 Moderate
- Heat 3/10 Moderate 7 d/yr ≥96°F today · 15 d/yr by 30 yrs out
- Wind 1/10 Low 0% chance of damaging wind over 30 yrs
- Air quality 1/10 Low 0 unhealthy d/yr today · 0 by 30 yrs out
Nearby sold comps map
Loading sold comps map…
Walkable amenities ~0.75 mi
Loading nearby amenities…
Taxation est. · year 1
- Rental income
- $20,650
- − Mortgage interest
- −$6,442
- − Property taxes
- −$2,259
- − Insurance
- −$575
- − Repairs & maintenance
- −$1,652
- − Management
- −$1,652
- − Depreciation
- −$3,345
- Taxable income
- $4,725
- Est. tax owed @ 24.0%
- −$1,134
- After-tax cash flow
- $5,109/yr
For passive investors: Depreciation is non-cash, so a rental often shows a tax loss while cash-flowing — sheltering income. Rental losses are passive: they offset passive income freely, and up to $25,000/yr can offset ordinary (W-2) income if you actively participate and your MAGI is under $100k (phasing out to $0 by $150k); unused losses carry forward. On sale, claimed depreciation is recaptured at up to 25%, and gains may owe capital-gains tax (a 1031 exchange can defer both). Figures are a year-1 estimate at your 24.0% rate — not tax advice; consult a CPA.
Schools (NCES district)
- District
- Elmira City School District
- NCES district ID
- 3610560
- Math proficiency
- 23% ▼ -7.00%
- Reading proficiency
- 35% ▲ 7.00%
- Median HH income
- $40,180
- Composite
- 24.39/100
- National rank
- #7688
- State rank
- #580 of 590 in NY
Livability — Elmira
- Score
- 62/100
- State rank
- #832
- US rank
- #16139
Category grades
Schools grade is shown separately in the Schools card above.
Census & demographics
- Census place
- Elmira, NY
- City population
- 14,276
- Population (ZIP)
- 14,430
Population outlook (Chemung County) Hauer SSP2
- Today (2025)
- 82,931 people
- By 2030
- 80,356 · -3.1%
- By 2040
- 74,745 · -9.9%
- By 2050
- 69,012 · -16.8%
- By 2075
- 55,689 · -32.8%
- By 2100
- 41,428 · -50.0%
Race, ethnicity, and origin ACS 2023
- Neighborhood character
- Predominantly White (70%)
- Race & ethnicity
- White 70% Black 15% Two or more races 7% Hispanic / Latino 7% Asian 1%
- Hispanic origin (detail)
- Mexican 1% Puerto Rican 3%
- Common ancestry
- Romanian 4% Slovak 3% Iranian 2%
- Foreign-born
- 4% · Canada, China
- Languages at home
- 93% English-only · Spanish 3% Russian/Polish/Slavic 1% Chinese 1%
Political lean MEDSL · Chemung
- 2024 margin
- R (+16.8) · D 41.6% · R 58.4%
- 2008→2024 swing
- -15.6pp toward R · 2008: -1.2pp · 2024: -16.8pp
- All cycles
- 2024: R+16.8 2020: R+13.4 2016: R+20.0 2012: R+2.9 2008: R+1.2
Not yet ingested
- Civics
- —
Market trends
- HPI YoY
- ▲ 32.34%
- Current HPI
- 236.2674
- Rent YoY
- —
- Metro
- —
- State GDP YoY
- ▲ 2.60%
- F500 in state
- 92
Industry mix (Fortune 500 HQ in NY)
| Industry | F500 HQs | Revenue |
|---|---|---|
| Financial Services | 10 | $950B |
|
||
| Consumer Goods | 9 | $162B |
|
||
| Insurance | 4 | $225B |
|
||
| Telecommunications | 2 | $144B |
|
||
| Pharmaceuticals | 2 | $112B |
|
||
| Media / Entertainment | 2 | $69B |
|
||
Price history
+283.3% since first listed8 events — show timeline
- 2026-04-27 Contingent — UNYREIS
- 2026-04-20 Listed $115,000 UNYREIS
- 2015-10-19 Sold (Public Records) $55,250 Public Records
- 2015-10-16 Sold (MLS) $58,550 UNYREIS
- 2015-07-29 Listed $59,900 UNYREIS
- 2003-11-24 Sold (MLS) $7,500 UNYREIS
- 2003-02-03 Listed $9,950 UNYREIS
- 1993-07-16 Sold (Public Records) $30,000 Public Records
Property tax history
+17.8%/yrLatest (2025): $2,259 · -11.6% YoY. Source: county tax records.
Cash-flow waterfall
monthlySold comps — $/sqft
last 12 mo · ≤1 miLoading sold comps…