4809 S Mound Ave #105 · Tampa, FL
Flood risk 6/10 · Moderate
- FEMA flood zone
- X (unshaded)
- Chance of flooding over 30 yrs
- 0.58%
- Est. flood insurance / yr
- $507 – $1,088
Fire risk 1/10 · Minimal
- Est. fire insurance / yr
- $947 – $1,759
Heat risk 10/10 · Severe
- Hot days now (above 107°F)
- 6 days/yr
- Hot days in 30 yrs
- 24 days/yr
Wind risk 10/10 · Severe
- Chance of severe wind over 30 yrs
- 99.0%
Air-quality risk 4/10 · Minor
- Unhealthy air days now
- 4 days/yr
- Unhealthy air days in 30 yrs
- 4 days/yr
Risk factors via First Street. Map © Google.
Why this score? — see what drove the D+ grade
The composite is a weighted blend of 9 inputs, each scored 0–100. Each bar is that input's sub-score; the figure is the points it added to the 100-point composite (weight × sub-score).
- Cash flow +15.6/30.0
- 1% rule +8.2/10.0
- ARV discount +7.5/15.0
- DSCR +4.8/10.0
- Schools +4.2/10.0
- Livability +4.0/5.0
- Rent growth +2.7/5.0
- Condition / age +2.5/5.0
- Appreciation +0.0/10.0
$150,000
🖨 Deal sheet 📄 Offer letter ✓ Due diligence
Listing remarks
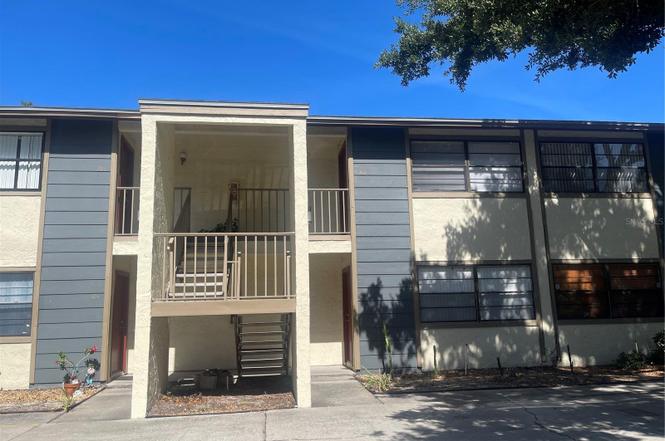
Under contract-accepting backup offers. READY TO BE UPDATED!!!! FIRST FLOOR CONDO IN SOUTH TAMPA!! This 12 unit complex with designated parking plus guest, is perfectly located on the corner of Gandy and Mound. The condominium is tucked away in Bayshore Beautiful subdivision and is surrounded by luxurious single family homes. The location is so close to shops and restaurants you can walk, Easy commute to downtown, Channelside. Hyde Park and Soho. Unit features include open floor plan, utility closet for washer/dryer. Enjoy the outside through the sliding door that leads to back porch and community fenced in area. If you are looking to purchase multiple units check out the other 2 listings.
Key facts
- First floor condo
- Back porch
- Designated parking
Tags
Property features AI
Finance
- Financial info: Total monthly fees: $400; Total annual fees: $4,800
- HOA & community: Monthly condo fee: $400; Association approval required; HOA fee includes insurance, structure and grounds maintenance, pest control, sewer, trash and water; Pets allowed: cats and dogs; Association contact/representative noted
Exterior
- Parking: Assigned parking; Guest parking
- Utilities: Public water; Public sewer; Electricity connected
- Home design: Residential condominium; Faces east; One level (unit on 1st floor); Building has 2 total stories
- Construction: Block construction; Membrane roof; Slab foundation; Building name: TWELVE PALMS CONDOMINIUMS; Built on a 0.02 acre lot
- Exterior features: Exterior lighting; Private mailbox
Interior
- Kitchen: Dishwasher; Range; Refrigerator
- Bedrooms: 2 bedrooms
- Flooring: Concrete flooring
- Bathrooms: 1 full bathroom
- Heating & cooling: Central heating; Central air conditioning
- Interior features: No interior features specified
- Laundry & utility: Laundry closet
Neighborhood map
What this means for you Summary
Snapshot
- This is a 2-bed/1.0-bath condo listed at $150k.
Deal economics
- At list price, monthly cash flow is $64 ($766/yr) — positive.
- The deal already cash-flows at list — no discount required.
- Meets the 1% rule at list price ($2k rent vs $150k).
Location & tenants
- Location reads 79/100 on livability (#142 in FL, #2,135 nationally) — a middle-class / working-renter tenant base. Strengths: commute A+, housing A+, health & safety A+; Watch: schools C-, crime D+.
- Hillsborough (suburban): math 47% / reading 50% proficiency, ranked #41 of 73 in FL (top 56%) — families likely to look elsewhere, expect single-tenant / working-renter base with shorter leases.
- Market conditions: Rents flat; 416 active listings in the ZIP; 40 comparable units currently listed for rent nearby; rentals at typical pace (median 22d on market — plan ~3-4 weeks tenant-placement turnaround); solid renter incomes; 9,053 units permitted in Hillsborough County in 2024 (4,555 in 5+ unit buildings).
Forward outlook
- Local home prices are declining (-3.0%/yr); year-one equity from $1k of loan paydown is wiped out by about $4k of value loss. Plan a longer hold.
- Hillsborough County population projected at +37% by 2050 — long-run rental-demand tailwind backs the buy-and-hold thesis.
Negotiation context
- Only 3 days on market — expect competitive offers; lowballing is unlikely to land.
- 2 sale attempts since 18y ago with the ask held roughly flat each time — persistent listings suggest the price (not the market) is what's stuck; bring a comps-based counter.
Risks & watch-outs
- Watch-outs: HOA is 20% of rent.
- Climate carrying-cost: major flood risk; severe wind risk, 99% chance of damaging wind over 30y; extreme-heat days projected 6→24/yr by 2055 (HVAC capex compounding) — expect insurance premiums to compound above CPI over the hold.
Questions for the listing agent
- What does the HOA fee cover, when was the last increase, and are there any pending special assessments or reserve-fund shortfalls?
- Any open or pending special assessments — roof, HVAC, plumbing, elevator, façade? What's the per-unit balance and payoff schedule, and is the seller paying it off at close or rolling it to the buyer?
- Is there a deadline driving the sale (1031 exchange, divorce, estate, relocation)? That informs how much negotiation room exists.
- Crime grade is D in this area — have there been break-ins, vandalism, or insurance claims at this property in the last 3 years? What carrier currently insures it and at what premium?
- The area grade is low — what's the realistic commute time and amenity access for the typical tenant pool here? Any planned neighborhood developments (good or bad) we should know about?
- What's the average days-on-market for RENTAL listings here right now (not sales)? A rising rental-DOM trend means longer vacancies and softer asking-rent achievability than the comps imply.
- What's the recent tenant-quality profile in this submarket — average credit score on applications, eviction rate, late-payment / NSF rate, and stable-employment percentage? A property-management company in the area should have these aggregated.
- How much new apartment / multifamily construction is in the pipeline within 1–3 miles? Heavy new supply (>2% of stock underway) typically softens rents 12–24 months out; light construction supports rent growth.
Investment metrics
- 1% rule
- 1.32% ✓
- Cap rate
- 6.80%
- Cash-on-cash
- 1.82%
- DSCR
- 1.08
- GRM
- 6.3
CMA / ARV
No comps found within radius.
Projected returns pro-forma
-3.0% appreciation · 0.69% rent growth · sell at horizon
- IRR
- -16.9%
- Equity multiple
- 0.42×
- Total profit
- $-24,413
- Equity at exit
- $22,365
- IRR
- -16.0%
- Equity multiple
- 0.23×
- Total profit
- $-32,326
- Equity at exit
- $12,969
Cash invested: $42,000 (down + closing). Projections, not guarantees.
Landlord ↔ Tenant lean methodology
- Overall (STATE)
- 87 Strongly Landlord-Friendly
- State Florida
- 87 Strongly Landlord-Friendly · R+3
- County
- — inherits STATE
- City
- — inherits STATE
ZIP-level market 33611
- Rents YoY
- 0.7%
- Active inventory
- 416
- Price-to-rent
- 6.3×
Monthly cashflow live
- Estimated rent
- $1,974 high interval (Pro) →
- Mortgage (P&I)
- −$787
- Tax from tax record
- −$247 /mo · $2,959/yr
- Insurance
- −$62
- HOA
- −$400
- Vacancy / Maint / Mgmt
- −$415
- Net cashflow
- $64
Break-even live
UW: 25.0% down · 7.5% · 30yr · 1.5% tax · 5.0% vac · 8.0% maint · 8.0% mgmt
Financing live
Cash to close
- Down payment
- $37,500
- Closing costs
- $4,500
- Reserves months
- —
- Total cash needed
- —
Loan-product check · same deal, 3 products live
Conventional
25% down · 7.5% · 30yr
- Down + closing
- —
- Monthly P&I
- —
- Monthly cashflow
- —
- DSCR
- —
- Eligible?
- —
Personal DTI + credit; lowest rate.
DSCR
20% down · 8.5% · 30yr
- Down + closing
- —
- Monthly P&I
- —
- Monthly cashflow
- —
- DSCR
- —
- Eligible?
- —
No personal income docs; deal must DSCR.
Hard money
10% down · 12.0% · 12mo
- Down + closing
- —
- Monthly P&I
- —
- Monthly cashflow
- —
- DSCR
- —
- Eligible?
- —
Short-term bridge; refi at stabilization.
Rent comps 40 comps
| Address | Beds | Baths | Sqft | Rent | $/sqft | DOM | Units | Dist |
|---|---|---|---|---|---|---|---|---|
| 3404 W Marlin Ave Tampa, FL | 1.0–2.0 | 1.0–2.0 | 915 | $1,900 | $2.08 | 5d | 10 | 0.26mi |
| 3414 W Oakellar Ave Tampa, FL | 2.0 | 1.0 | 1078 | $1,850 | $1.72 | 13d | 1 | 0.30mi |
| 5000 S Himes Ave Tampa, FL | 1.0–2.0 | 1.0–2.0 | 866 | $2,155 | $2.49 | 4d | 9 | 0.30mi |
| 5101 S Clarice Ct Tampa, FL | 2.0 | 1.0 | 820 | $1,300 | $1.59 | 24d | 1 | 0.55mi |
| 5107 S Clarice Ct Tampa, FL | 2.0 | 1.0 | 1000 | $1,500 | $1.50 | 1d | 1 | 0.56mi |
| 5113 S Clarice Ct Unit 5113A Tampa, FL | 2.0 | 1.0 | 1000 | $1,500 | $1.50 | 14d | 1 | 0.56mi |
| 5117 S Clarice Ct Unit 5117A Tampa, FL | 2.0 | 1.0 | 900 | $1,756 | $1.95 | 14d | 1 | 0.59mi |
| 2910 W Pearl Ave Tampa, FL | 3.0 | 1.0 | 1107 | $2,450 | $2.21 | 17d | 1 | 0.60mi |
| 2911 W Tyson Ave Tampa, FL | 2.0 | 1.0 | 650 | $1,723 | $2.65 | 21d | 1 | 0.62mi |
| 5440 S Macdill Ave Tampa, FL | 2.0 | 1.0 | 884 | $1,700 | $1.92 | 3d | 1 | 0.64mi |
| 5055 S Dale Mabry Hwy Tampa, FL | 2.0 | 1.0–2.0 | 797 | $2,000 | $2.51 | 3d | 28 | 0.74mi |
| 3394 W Wyoming Cir Tampa, FL | 2.0 | 1.5 | 930 | $2,600 | $2.80 | 24d | 1 | 0.78mi |
| 2706 W Tyson Ave Unit B Tampa, FL | 1.0 | 1.0 | 600 | $1,800 | $3.00 | 24d | 1 | 0.80mi |
| 2706 W Tyson Ave Unit C Tampa, FL | 1.0 | 1.0 | 600 | $1,650 | $2.75 | 24d | 1 | 0.80mi |
| 3701 W Wyoming Ave Tampa, FL | 2.0 | 1.0 | 900 | $1,550 | $1.72 | 23d | 1 | 0.88mi |
| 4015 Bayshore Blvd Tampa, FL | 1.0–2.0 | 1.0–2.0 | 747 | $2,500 | $3.35 | 2d | 3 | 0.88mi |
| 5411 Bayshore Blvd Tampa, FL | 1.0–2.0 | 1.0 | 608 | $2,100 | $3.45 | 24d | 3 | 0.90mi |
| 3811 N Oak Dr Unit 61 Tampa, FL | 2.0 | 2.0 | 904 | $1,880 | $2.08 | 10d | 1 | 0.90mi |
| 5145 S Dale Mabry Hwy Tampa, FL | 3.0 | 1.0–2.0 | 1057 | $3,253 | $3.08 | 3d | 20 | 0.90mi |
| 3821 N Oak Dr Unit J21 Tampa, FL | 2.0 | 2.0 | 1010 | $1,950 | $1.93 | 20d | 1 | 0.96mi |
| 4207 S Dale Mabry Hwy Tampa, FL | 1.0–3.0 | 1.0–2.0 | 1117 | $2,185 | $1.96 | 3d | 7 | 0.96mi |
| 5901 S Dale Mabry Hwy Unit B Tampa, FL | 3.0 | 1.0 | 768 | $1,500 | $1.95 | 24d | 1 | 1.03mi |
| 3809 W Iowa Ave Tampa, FL | 1.0 | 1.0 | 650 | $1,125 | $1.73 | 5d | 3 | 1.07mi |
| 3606 S MacDill Ave Unit 208 Tampa, FL | 2.0 | 1.0 | 1050 | $2,095 | $2.00 | 21d | 1 | 1.09mi |
| 6001 S Dale Mabry Hwy Unit 08 Tampa, FL | 2.0 | 1.0 | 830 | $1,195 | $1.44 | 24d | 1 | 1.10mi |
| 4233 La Sorrento Ct Tampa, FL | 2.0 | 1.5 | 1044 | $2,200 | $2.11 | 3d | 1 | 1.13mi |
| 4220 La Dega Ct Unit 1 Tampa, FL | 2.0 | 1.5 | 1044 | $1,899 | $1.82 | 24d | 1 | 1.13mi |
| 4220 La Dega Ct Tampa, FL | 2.0 | 2.0 | 1044 | $1,899 | $1.82 | 24d | 1 | 1.13mi |
| 3814 W Euclid Ave Tampa, FL | 1.0 | 1.0 | 650 | $1,500 | $2.31 | 24d | 2 | 1.16mi |
| 4304 La Riviera Ct Tampa, FL | 2.0 | 1.5 | 1044 | $3,275 | $3.14 | 24d | 1 | 1.16mi |
| 4521 W La Villa Ln Tampa, FL | 2.0 | 1.5 | 1044 | $1,875 | $1.80 | 24d | 1 | 1.18mi |
| 3730 W Bay Ave Tampa, FL | 1.0–2.0 | 1.0 | 775 | $1,199 | $1.55 | 23d | 1 | 1.18mi |
| 4315 Aegean Dr Unit 102C Tampa, FL | 2.0 | 1.0 | 1000 | $1,849 | $1.85 | 21d | 1 | 1.22mi |
| 6306 S Macdill Ave Tampa, FL | 1.0–2.0 | 1.0–2.0 | 747 | $2,171 | $2.90 | 3d | 15 | 1.24mi |
| 6244 S Martindale Ave Unit B Tampa, FL | 2.0 | 1.0 | 850 | $1,990 | $2.34 | 24d | 1 | 1.24mi |
| 3325 Bayshore Blvd Tampa, FL | 1.0–2.0 | 2.0 | 832 | $2,300 | $2.76 | 24d | 2 | 1.38mi |
| 3325 Bayshore Blvd Unit E35 Tampa, FL | 2.0 | 2.0 | 936 | $2,200 | $2.35 | 4d | 1 | 1.40mi |
| 3325 Bayshore Blvd Unit E34 Tampa, FL | 2.0 | 2.0 | 936 | $2,300 | $2.46 | 20d | 1 | 1.40mi |
| 5608 S Manhattan Ave Unit A Tampa, FL | 2.0 | 1.0 | 800 | $500 | $0.62 | 17d | 1 | 1.45mi |
| 6317 S Roberts Ave Unit A Tampa, FL | 2.0 | 1.0 | 864 | $1,600 | $1.85 | 21d | 1 | 1.49mi |
HOA detail condo
- Monthly dues
- $400 · $4,800/yr
- Assessments
- None detected in remarks — confirm with the listing agent.
Listing history 4 events
-
2026-06-15status $150,000 Pending 3 DOM
-
2026-06-13days on market $150,000 Active 3 DOM
-
2026-06-13remarks 699-char remark
-
2026-06-13$150,000 Active 2 DOM
ⓘ Source: listings_history table (triggers on properties + properties_extension) + one-shot
backfill from property_details.listing_events for pre-trigger history.
Tax reassessment forecast FL · Resets to sale price
- Current annual tax
- $2,959 · $247/mo
- Projected year-2 tax
- $2,959 · $247/mo
- Expected delta
- $0/yr ($0/mo · 0.0%)
ⓘ Screening estimate from a state-policy table — verify with the county assessor before closing.
Climate risk First Street
- Flood 6/10 Major FEMA zone X (unshaded) · 58% chance over 30 yrs
- Wildfire 1/10 Low
- Heat 10/10 Extreme 6 d/yr ≥107°F today · 24 d/yr by 30 yrs out
- Wind 10/10 Extreme 99% chance of damaging wind over 30 yrs
- Air quality 4/10 Moderate 4 unhealthy d/yr today · 4 by 30 yrs out
Nearby sold comps map
Loading sold comps map…
Walkable amenities ~0.75 mi
Loading nearby amenities…
Taxation est. · year 1
- Rental income
- $23,689
- − Mortgage interest
- −$8,402
- − Property taxes
- −$2,959
- − Insurance
- −$750
- − Repairs & maintenance
- −$1,895
- − Management
- −$1,895
- − HOA
- −$4,800
- − Depreciation
- −$4,364
- Taxable loss
- −$1,376
- Est. tax savings @ 24.0%
- +$330
- After-tax cash flow
- $1,096/yr
For passive investors: Depreciation is non-cash, so a rental often shows a tax loss while cash-flowing — sheltering income. Rental losses are passive: they offset passive income freely, and up to $25,000/yr can offset ordinary (W-2) income if you actively participate and your MAGI is under $100k (phasing out to $0 by $150k); unused losses carry forward. On sale, claimed depreciation is recaptured at up to 25%, and gains may owe capital-gains tax (a 1031 exchange can defer both). Figures are a year-1 estimate at your 24.0% rate — not tax advice; consult a CPA.
Schools (NCES district)
- District
- Hillsborough
- NCES district ID
- 1200870
- Math proficiency
- 47% ▼ -8.00%
- Reading proficiency
- 50% ▼ -4.00%
- Median HH income
- $50,622
- Composite
- 41.6/100
- National rank
- #3435
- State rank
- #41 of 73 in FL
Livability — Tampa
- Score
- 79/100
- State rank
- #142
- US rank
- #2135
Category grades
Schools grade is shown separately in the Schools card above.
Census & demographics
- Census place
- Tampa, FL
- County
- Hillsborough County · 1,540,968 people
- City population
- 523,346
- Metro
- Tampa-St. Petersburg-Clearwater, FL
- Population (ZIP)
- 36,810
- Household income
- $90,910
- Rent vs Own
- Severe rent burden
- 1761.0
Population outlook (Hillsborough County) Hauer SSP2
- Today (2025)
- 1,607,022 people
- By 2030
- 1,733,968 · +7.9%
- By 2040
- 1,979,565 · +23.2%
- By 2050
- 2,203,427 · +37.1%
- By 2075
- 2,667,893 · +66.0%
- By 2100
- 2,891,558 · +79.9%
Race, ethnicity, and origin ACS 2023
- Neighborhood character
- Predominantly White (70%)
- Race & ethnicity
- White 70% Hispanic / Latino 14% Two or more races 12% Black 5% Asian 5%
- Hispanic origin (detail)
- Mexican 2% Puerto Rican 3% Cuban 4%
- Common ancestry
- Romanian 3% Slovak 2% Lithuanian 2%
- Foreign-born
- 12% · Canada, Vietnam, Jamaica
- Languages at home
- 85% English-only · Spanish 7% Other Indo-European 2% Vietnamese 1%
Political lean MEDSL · Hillsborough
- 2024 margin
- Toss-up / Even · D 47.8% · R 50.9% · Other 1.3%
- 2008→2024 swing
- -10.2pp toward R · 2008: 7.1pp · 2024: -3.1pp
- All cycles
- 2024: R+3.1 2020: D+6.9 2016: D+6.8 2012: D+6.7 2008: D+7.1
Not yet ingested
- Civics
- —
Market trends
- HPI YoY
- ▼ -328.23%
- Current HPI
- 374.7996
- Rent YoY
- ▲ 0.69%
- Metro
- Tampa-St. Petersburg-Clearwater, FL
- State GDP YoY
- ▲ 3.28%
- F500 in state
- 36
Industry mix (Fortune 500 HQ in FL)
| Industry | F500 HQs | Revenue |
|---|---|---|
| Industrial Technology | 2 | $29B |
|
||
| Insurance | 2 | $17B |
|
||
| Retail | 1 | $60B |
|
||
| Technology Distribution | 1 | $58B |
|
||
| Homebuilding | 1 | $35B |
|
||
| Technology Manufacturing | 1 | $35B |
|
||
Price history
+275.9% since first listed7 events — show timeline
- 2026-06-10 Listed $150,000 Stellar MLS as Distributed by MLS Grid
- 2015-10-08 Sold (Public Records) $131,000 Public Records
- 2008-11-24 Listing Removed — Stellar MLS as Distributed by MLS Grid
- 2008-08-08 Listed $99,900 Stellar MLS as Distributed by MLS Grid
- 2005-10-15 Sold (Public Records) $380,000 Public Records
- 2000-11-08 Sold (Public Records) $42,000 Public Records
- 1983-07-01 Sold (Public Records) $39,900 Public Records
Property tax history
+11.8%/yrLatest (2025): $2,959 · +10.7% YoY. Source: county tax records.
Cash-flow waterfall
monthlySold comps — $/sqft
last 12 mo · ≤1 miLoading sold comps…