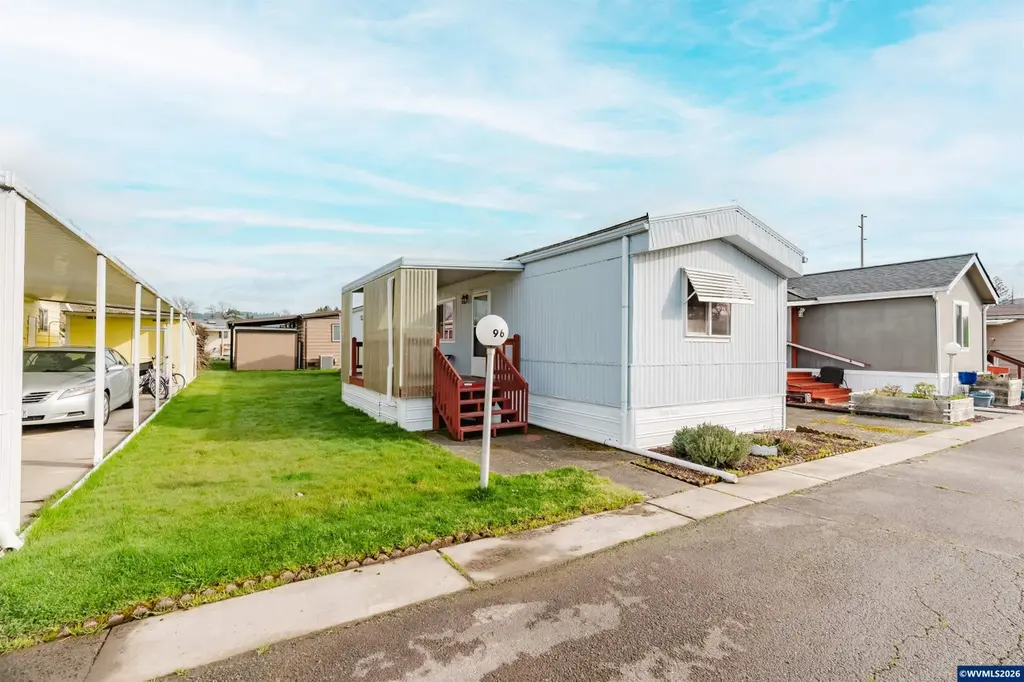
2901 E 2nd St #96 · Newberg, OR
Flood risk 1/10 · Minimal
- FEMA flood zone
- X (unshaded)
- Chance of flooding over 30 yrs
- 0.0%
- Est. flood insurance / yr
- $507 – $1,088
Fire risk 4/10 · Minor
- Est. fire insurance / yr
- $498 – $926
Heat risk 3/10 · Minor
- Hot days now (above 92°F)
- 7 days/yr
- Hot days in 30 yrs
- 14 days/yr
Wind risk 1/10 · Minimal
- Chance of severe wind over 30 yrs
- —
Air-quality risk 9/10 · Severe
- Unhealthy air days now
- 11 days/yr
- Unhealthy air days in 30 yrs
- 12 days/yr
Risk factors via First Street. Map © Google.
Why this score? — see what drove the B+ grade
The composite is a weighted blend of 9 inputs, each scored 0–100. Each bar is that input's sub-score; the figure is the points it added to the 100-point composite (weight × sub-score).
- Cash flow +30.0/30.0
- ARV discount +13.2/15.0
- 1% rule +10.0/10.0
- DSCR +10.0/10.0
- Livability +3.8/5.0
- Schools +3.4/10.0
- Rent growth +2.6/5.0
- Condition / age +2.5/5.0
- Appreciation +0.0/10.0
$84,500
🖨 Deal sheet 📄 Offer letter ✓ Due diligence
Listing remarks MLS
Charming single-wide manufactured home located in a quiet 55+ community. This 2 bedroom, 2 full bathroom home features a newer heat pump for year-round comfort, a storage shed, carport, skylights, partially enclosed front porch, washer & dryer in home and affordable park rent.
Key facts
- Carport
- Storage shed
- Newer heat pump
Tags
Neighborhood map
What this means for you Summary
Snapshot
- This is a 2-bed/1.0-bath manufactured listed at $84k.
Deal economics
- At list price, monthly cash flow is $845 ($10k/yr) — positive.
- The deal already cash-flows at list — no discount required.
- Meets the 1% rule at list price ($2k rent vs $84k).
- Recommended offer: $77k (9.0% below list) — sets the bar for market timing.
- Cap rate 18.3% vs local median 2.4% in Newberg — top-decile yield for the area; either an underpriced asset or a hidden risk that comps aren't pricing in. Stress-test before assuming the spread holds.
Location & tenants
- Location reads 76/100 on livability (#77 in OR, #3,395 nationally) — a middle-class / working-renter tenant base. Strengths: amenities A+, employment A+, housing A+; Watch: cost of living D, commute F.
- Newberg SD 29J (town): math 30% / reading 45% proficiency, ranked #17 of 58 in OR (top 29%) — families likely to look elsewhere, expect single-tenant / working-renter base with shorter leases.
- Market conditions: Rents flat; 230 active listings in the ZIP; 28 comparable units currently listed for rent nearby; rentals at typical pace (median 16d on market — plan ~3-4 weeks tenant-placement turnaround); solid renter incomes; 282 units permitted in Yamhill County in 2024 (0 in 5+ unit buildings).
Forward outlook
- Local home prices are declining (-3.0%/yr); year-one equity from $584 of loan paydown is wiped out by about $3k of value loss. Plan a longer hold.
- Yamhill County population projected at +8% by 2050 — modest demand growth; plan on rents tracking national, not racing it.
- At projected returns (-3.0% appreciation + 0.6% rent growth), your $24k cash investment doubles in ~3 years — after that, you're playing with house money.
Negotiation context
- It's been on market 105 days — a 9% lower offer ($77k) is reasonable based on typical stale-listing flexibility.
Questions for the listing agent
- It's been on market 105 days. Have you received any prior offers? Is the seller open to a 9% concession, seller financing, or rate buy-down credit?
- Why hasn't it sold? Are there any deal-killer items the seller is aware of (foundation, flood, title, zoning, code violations)?
- Is there a deadline driving the sale (1031 exchange, divorce, estate, relocation)? That informs how much negotiation room exists.
- Schools are B-rated — typically a magnet for longer-tenancy family renters. What's the average tenant stay here, and is there a school-zone premium baked into asking?
- What's the average days-on-market for RENTAL listings here right now (not sales)? A rising rental-DOM trend means longer vacancies and softer asking-rent achievability than the comps imply.
- What's the recent tenant-quality profile in this submarket — average credit score on applications, eviction rate, late-payment / NSF rate, and stable-employment percentage? A property-management company in the area should have these aggregated.
- How much new for-sale + rental construction is in the pipeline within 1–3 miles? Heavy new supply typically softens prices + rents 12–24 months out; constrained supply supports both.
Investment metrics
- 1% rule
- 2.04% ✓
- Cap rate
- 18.29%
- Cash-on-cash
- 42.84%
- DSCR
- 2.91
- GRM
- 4.1
CMA / ARV
- ARV (median comp)
- $96,800
- List price
- $84,500
- Delta
- -12.71%
- Verdict
- UNDERPRICED
- Comps
- 14 within 1.0 mi
Show comp detail 8 sales within ~0.75 mi
| Address | Dist | Beds/Ba | Sqft | Sold | Price | $/sf | Match |
|---|---|---|---|---|---|---|---|
| 2902 E 2nd St #12 | 0.14mi | 2/1.0 | 924 (0%) | 1mo | $98,000 | $106 | 92 |
| 2902 E 2nd St #54 | 0.09mi | 2/2.0 | 924 (0%) | 3mo | $95,600 | $103 | 90 |
| 2902 E 2nd St #108 | 0.02mi | 3/2.0 (+1) | 924 (0%) | 6mo | $115,500 | $125 | 86 |
| 2902 E 2nd St #106 | 0.02mi | 2/1.0 | 840 (-9%) | 3mo | $94,000 | $112 | 82 |
| 2901 E 2nd St #126 | 0.00mi | 2/2.0 | 1,008 (+9%) | 4mo | $37,000 | $37 | 78 |
| 2902 E 2nd St #18 | 0.13mi | 2/1.0 | 1,008 (+9%) | 6mo | $82,000 | $81 | 74 |
| 2901 E 2nd St #110 | 0.00mi | 2/1.0 | 992 (+7%) | 20mo | $89,000 | $90 | 71 |
| 1103 N Springbrook Rd #6 | 0.74mi | 2/2.0 | 924 (0%) | 2mo | $110,000 | $119 | 60 |
Match score weights: distance 35% · size 25% · config 20% · recency 20%. Top-matched comps best support the ARV.
Projected returns pro-forma
-3.0% appreciation · 0.55% rent growth · sell at horizon
- IRR
- 36.9%
- Equity multiple
- 2.52×
- Total profit
- $35,950
- Equity at exit
- $12,599
- IRR
- 42.4%
- Equity multiple
- 4.56×
- Total profit
- $84,333
- Equity at exit
- $7,306
Cash invested: $23,660 (down + closing). Projections, not guarantees.
Landlord ↔ Tenant lean methodology
- Overall (STATE)
- 28 Tenant-Leaning
- State Oregon
- 28 Tenant-Leaning · D+6
- County
- — inherits STATE
- City
- — inherits STATE
ZIP-level market 97132
- Rents YoY
- 0.6%
- Active inventory
- 230
- Price-to-rent
- 4.1×
Monthly cashflow live
- Estimated rent
- $1,721 high interval (Pro) →
- Mortgage (P&I)
- −$443
- Tax from tax record
- −$37 /mo · $441/yr
- Insurance
- −$35
- HOA
- −$0
- Vacancy / Maint / Mgmt
- −$361
- Net cashflow
- $845
Break-even live
UW: 25.0% down · 7.5% · 30yr · 1.5% tax · 5.0% vac · 8.0% maint · 8.0% mgmt
Financing live
Cash to close
- Down payment
- $21,125
- Closing costs
- $2,535
- Reserves months
- —
- Total cash needed
- —
Loan-product check · same deal, 3 products live
Conventional
25% down · 7.5% · 30yr
- Down + closing
- —
- Monthly P&I
- —
- Monthly cashflow
- —
- DSCR
- —
- Eligible?
- —
Personal DTI + credit; lowest rate.
DSCR
20% down · 8.5% · 30yr
- Down + closing
- —
- Monthly P&I
- —
- Monthly cashflow
- —
- DSCR
- —
- Eligible?
- —
No personal income docs; deal must DSCR.
Hard money
10% down · 12.0% · 12mo
- Down + closing
- —
- Monthly P&I
- —
- Monthly cashflow
- —
- DSCR
- —
- Eligible?
- —
Short-term bridge; refi at stabilization.
Rent comps 28 comps
| Address | Beds | Baths | Sqft | Rent | $/sqft | DOM | Units | Dist |
|---|---|---|---|---|---|---|---|---|
| 2501 E 2nd St #12 Newberg, OR | 2.0 | 2.0 | 910 | $1,500 | $1.65 | 23d | 1 | 0.36mi |
| 704 N Elliott Rd Newberg, OR | 2.0 | 1.5 | 850 | $1,700 | $2.00 | 16d | 1 | 0.53mi |
| 901 N Pecan Ct Newberg, OR | 2.0 | 1.0 | 827 | $1,550 | $1.87 | 1d | 2 | 0.63mi |
| 401 S Everest St Newberg, OR | 2.0 | 1.0 | 950 | $1,625 | $1.71 | 1d | 1 | 0.69mi |
| 611 Sitka Ave Unit 03 Newberg, OR | 2.0 | 1.5 | 900 | $1,550 | $1.72 | 43d | 1 | 0.72mi |
| 1536 E 3rd St Unit 20 Newberg, OR | 3.0 | 1.0 | 1000 | $1,725 | $1.73 | 43d | 1 | 0.73mi |
| 2400 E Haworth Ave Newberg, OR | 1.0–3.0 | 1.0–1.5 | 1025 | $1,638 | $1.60 | 1d | 2 | 0.76mi |
| 1005 Wynooski St Unit 7 Newberg, OR | 2.0 | 1.0 | 825 | $1,675 | $2.03 | 43d | 1 | 0.80mi |
| 601 Wynooski St Unit 201 Newberg, OR | 2.0 | 2.0 | 1122 | $1,850 | $1.65 | 43d | 1 | 0.82mi |
| 1418 E 2nd St Unit 10 Newberg, OR | 2.0 | 1.0 | 850 | $1,550 | $1.82 | 43d | 1 | 0.82mi |
| 601 Wynooski St Unit 100 Newberg, OR | 2.0 | 2.0 | 1064 | $1,745 | $1.64 | 14d | 1 | 0.82mi |
| 1401 N Springbrook Rd Newberg, OR | 2.0 | 1.0 | 960 | $1,550 | $1.61 | 16d | 4 | 0.88mi |
| 1401 N Springbrook Rd Apt 128 Newberg, OR | 2.0 | 1.0 | 960 | $1,500 | $1.56 | 2d | 1 | 0.88mi |
| 2507 Hawthorne Dr Newberg, OR | 2.0 | 1.0 | 950 | $1,700 | $1.79 | 1d | 1 | 0.89mi |
| 1401 N Springbrook Rd Unit 220 Newberg, OR | 2.0 | 1.0 | 960 | $1,600 | $1.67 | 23d | 1 | 0.90mi |
| 1200 E 4th St Apt 1 Newberg, OR | 1.0 | 1.0 | 600 | $1,425 | $2.38 | 17d | 1 | 0.94mi |
| 500 S River St #20 Newberg, OR | 2.0 | 1.0 | 800 | $1,425 | $1.78 | 2d | 1 | 0.99mi |
| 4001 E Jory St Newberg, OR | 1.0–3.0 | 1.0–2.0 | 941 | $1,950 | $2.07 | 1d | 1 | 1.07mi |
| 1404 E Park Ln Newberg, OR | 1.0–2.0 | 1.0 | 783 | $1,670 | $2.13 | 1d | 4 | 1.17mi |
| 507 N Meridian St Apt 1 Newberg, OR | 2.0 | 1.0 | 700 | $1,375 | $1.96 | 2d | 1 | 1.19mi |
| 1109 S River St Newberg, OR | 2.0 | 2.0 | 969 | $1,812 | $1.87 | 1d | 3 | 1.19mi |
| 4460 E Jory St Unit 114 Newberg, OR | 2.0 | 2.0 | 909 | $1,899 | $2.09 | 10d | 1 | 1.21mi |
| 1210 S College St Unit 335-218 Newberg, OR | 1.0 | 1.0 | 640 | $1,400 | $2.19 | 10d | 1 | 1.30mi |
| 606 E Ninth St Apt 34 Newberg, OR | 2.0 | 1.0 | 920 | $1,550 | $1.68 | 4d | 1 | 1.30mi |
| 606 E 9th St Newberg, OR | 2.0 | 1.0–1.5 | 920 | $1,550 | $1.68 | 20d | 2 | 1.30mi |
| 1200 N Meridian St Newberg, OR | 2.0 | 1.5 | 950 | $1,595 | $1.68 | 43d | 1 | 1.32mi |
| 611 S Blaine St Newberg, OR | 1.0–2.0 | 1.0–2.0 | 860 | $1,645 | $1.91 | 43d | 2 | 1.46mi |
| 912 Charles St Apt B Newberg, OR | 2.0 | 1.0 | 1087 | $1,750 | $1.61 | 43d | 1 | 1.48mi |
Listing history 15 events
-
2026-06-18days on market $84,500 Active 105 DOM
-
2026-06-17days on market $84,500 Active 104 DOM
-
2026-06-16days on market $84,500 Active 103 DOM
-
2026-06-15days on market $84,500 Active 102 DOM
-
2026-06-13days on market $84,500 Active 100 DOM
-
2026-06-09days on market $84,500 Active 96 DOM
-
2026-06-08days on market $84,500 Active 95 DOM
-
2026-06-07days on market $84,500 Active 94 DOM
-
2026-06-05days on market $84,500 Active 91 DOM
-
2026-06-03days on market $84,500 Active 90 DOM
-
2026-06-02days on market $84,500 Active 89 DOM
-
2026-06-01days on market $84,500 Active 88 DOM
-
2026-05-31days on market $84,500 Active 87 DOM
-
2026-04-22price $84,500 281-char remark
Show marketing remark (281 chars)
Charming single-wide manufactured home located in a quiet 55+ community. This 2 bedroom, 2 full bathroom home features a newer heat pump for year-round comfort, a storage shed, carport, skylights, partially enclosed front porch, washer & dryer in home and affordable park rent.
-
2026-03-05$89,500 Active 281-char remark
Show marketing remark (281 chars)
Charming single-wide manufactured home located in a quiet 55+ community. This 2 bedroom, 2 full bathroom home features a newer heat pump for year-round comfort, a storage shed, carport, skylights, partially enclosed front porch, washer & dryer in home and affordable park rent.
ⓘ Source: listings_history table (triggers on properties + properties_extension) + one-shot
backfill from property_details.listing_events for pre-trigger history.
Tax reassessment forecast OR · Resets to sale price
- Current annual tax
- $441 · $37/mo
- Projected year-2 tax
- $820 · $68/mo
- Expected delta
- +$379/yr (+$32/mo · 86.1%)
ⓘ Screening estimate from a state-policy table — verify with the county assessor before closing.
Climate risk First Street
- Flood 1/10 Low FEMA zone X (unshaded) · 0% chance over 30 yrs
- Wildfire 4/10 Moderate
- Heat 3/10 Moderate 7 d/yr ≥92°F today · 14 d/yr by 30 yrs out
- Wind 1/10 Low
- Air quality 9/10 Extreme 11 unhealthy d/yr today · 12 by 30 yrs out
Nearby sold comps map
Loading sold comps map…
Walkable amenities ~0.75 mi
Loading nearby amenities…
Taxation est. · year 1
- Rental income
- $20,655
- − Mortgage interest
- −$4,733
- − Property taxes
- −$441
- − Insurance
- −$422
- − Repairs & maintenance
- −$1,652
- − Management
- −$1,652
- − Depreciation
- −$2,458
- Taxable income
- $9,295
- Est. tax owed @ 24.0%
- −$2,231
- After-tax cash flow
- $7,906/yr
For passive investors: Depreciation is non-cash, so a rental often shows a tax loss while cash-flowing — sheltering income. Rental losses are passive: they offset passive income freely, and up to $25,000/yr can offset ordinary (W-2) income if you actively participate and your MAGI is under $100k (phasing out to $0 by $150k); unused losses carry forward. On sale, claimed depreciation is recaptured at up to 25%, and gains may owe capital-gains tax (a 1031 exchange can defer both). Figures are a year-1 estimate at your 24.0% rate — not tax advice; consult a CPA.
Schools (NCES district)
- District
- Newberg SD 29J
- NCES district ID
- 4108720
- Math proficiency
- 30% ▼ -13.00%
- Reading proficiency
- 45% ▼ -12.00%
- Median HH income
- $62,898
- Composite
- 33.6/100
- National rank
- #5414
- State rank
- #17 of 58 in OR
Livability — Newberg
- Score
- 76/100
- State rank
- #77
- US rank
- #3395
Category grades
Schools grade is shown separately in the Schools card above.
Census & demographics
- Census place
- Newberg, OR
- County
- Yamhill County · 71,150 people
- City population
- 32,486
- Metro
- Portland-Vancouver-Hillsboro, OR-WA
- Population (ZIP)
- 32,486
- Household income
- $96,493
- Rent vs Own
- Severe rent burden
- 1311.0
Population outlook (Yamhill County) Hauer SSP2
- Today (2025)
- 109,295 people
- By 2030
- 112,060 · +2.5%
- By 2040
- 115,975 · +6.1%
- By 2050
- 118,155 · +8.1%
- By 2075
- 120,968 · +10.7%
- By 2100
- 116,163 · +6.3%
Race, ethnicity, and origin ACS 2023
- Neighborhood character
- Predominantly White (76%)
- Race & ethnicity
- White 76% Hispanic / Latino 14% Two or more races 12% Asian 3%
- Hispanic origin (detail)
- Mexican 11%
- Common ancestry
- Italian 5% Portuguese 3% Slovak 3%
- Foreign-born
- 7% · Canada, China
- Languages at home
- 89% English-only · Spanish 8% Other Indo-European 1% Other Asian/Pacific 1%
Political lean MEDSL · Yamhill
- 2024 margin
- Lean R (+6.1) · D 45.3% · R 51.4% · Other 3.3%
- 2008→2024 swing
- -4.8pp toward R · 2008: -1.4pp · 2024: -6.1pp
- All cycles
- 2024: R+6.1 2020: R+4.0 2016: R+8.8 2012: R+6.7 2008: R+1.4
Not yet ingested
- Civics
- —
Market trends
- HPI YoY
- ▼ -265.11%
- Current HPI
- 320.8972
- Rent YoY
- ▲ 0.55%
- Metro
- Portland-Vancouver-Hillsboro, OR-WA
- State GDP YoY
- ▲ 2.05%
- F500 in state
- 2
Industry mix (Fortune 500 HQ in OR)
| Industry | F500 HQs | Revenue |
|---|---|---|
| Consumer Goods | 1 | $51B |
|
||
Price history
-5.6% since first listed2 events — show timeline
- 2026-04-22 Price Changed $84,500 WVMLS
- 2026-03-05 Listed $89,500 WVMLS
Property tax history
+1.8%/yrLatest (2025): $441 · +4.0% YoY. Source: county tax records.
Cash-flow waterfall
monthlySold comps — $/sqft
last 12 mo · ≤1 miLoading sold comps…