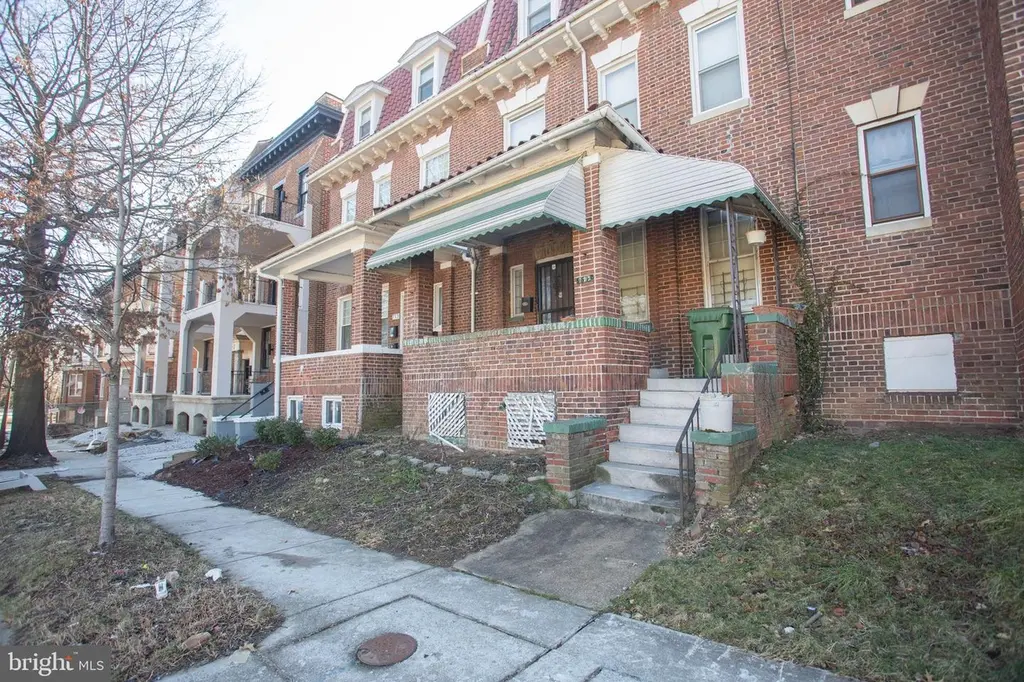
715 Druid Park Lake Dr · Baltimore, MD
Flood risk 3/10 · Minor
- FEMA flood zone
- X (unshaded)
- Chance of flooding over 30 yrs
- 0.1%
- Est. flood insurance / yr
- $507 – $1,088
Fire risk 1/10 · Minimal
- Est. fire insurance / yr
- $755 – $1,403
Heat risk 7/10 · Major
- Hot days now (above 103°F)
- 7 days/yr
- Hot days in 30 yrs
- 14 days/yr
Wind risk 6/10 · Moderate
- Chance of severe wind over 30 yrs
- 27.0%
Air-quality risk 4/10 · Minor
- Unhealthy air days now
- 6 days/yr
- Unhealthy air days in 30 yrs
- 7 days/yr
Risk factors via First Street. Map © Google.
Why this score? — see what drove the B- grade
The composite is a weighted blend of 9 inputs, each scored 0–100. Each bar is that input's sub-score; the figure is the points it added to the 100-point composite (weight × sub-score).
- Cash flow +28.6/30.0
- DSCR +10.0/10.0
- 1% rule +9.5/10.0
- ARV discount +7.5/15.0
- Rent growth +4.2/5.0
- Livability +3.8/5.0
- Condition / age +2.5/5.0
- Schools +1.0/10.0
- Appreciation +0.0/10.0
$199,999
🖨 Deal sheet 📄 Offer letter ✓ Due diligence
Listing remarks MLS
Coming Soon! Opportunity awaits at 715 Druid Park Lake! Estate sale being sold as-is, where-is, with all current contents included. Priced to sell and perfect for investors or buyers looking to renovate and build equity. Highlights include parquet flooring and solid bones. Sale requires 9 signatories.
Key facts
- Built 1920
- Listed 55 days
Neighborhood map
What this means for you Summary
Snapshot
- This is a 6-bed/2.0-bath townhouse listed at $200k.
Deal economics
- At list price, monthly cash flow is $661 ($8k/yr) — positive.
- The deal already cash-flows at list — no discount required.
- Meets the 1% rule at list price ($3k rent vs $200k).
- Recommended offer: $194k (3.0% below list) — sets the bar for market timing.
- Cap rate 10.3% vs local median 6.0% in Baltimore — top-decile yield for the area; either an underpriced asset or a hidden risk that comps aren't pricing in. Stress-test before assuming the spread holds.
Location & tenants
- Location reads 76/100 on livability (#90 in MD, #3,396 nationally) — a middle-class / working-renter tenant base. Strengths: amenities A+, commute A+, housing A+; Watch: schools D, crime F.
- Baltimore City Public Schools (urban): math 7% / reading 16% proficiency, ranked #24 of 24 in MD (top 100%) — low school quality limits family demand, transient renter base, plan for 1-2y turnover; 79% free/reduced lunch — lower-income household profile, screen leases tightly.
- Market conditions: Rents rising fast (+6.6%/yr); 331 active listings in the ZIP; 8 comparable units currently listed for rent nearby; rentals at typical pace (median 24d on market — plan ~3-4 weeks tenant-placement turnaround); lower-income renter base — watch delinquency; 1,273 units permitted in Baltimore city in 2024 (1,104 in 5+ unit buildings).
- At $2,902/mo this rent would consume 91% of the median local household income ($38k/yr) (locally 2921% of renters already pay >50% of income on rent) — very limited rent-growth headroom before tenants either downsize or default.
Forward outlook
- Local home prices are declining (-3.0%/yr); year-one equity from $1k of loan paydown is wiped out by about $6k of value loss. Plan a longer hold.
- Baltimore County population projected to shrink 4% by 2050 — rents likely to lag national; underwrite the cash flow, not the appreciation.
- At projected returns (-3.0% appreciation + 6.6% rent growth), your $56k cash investment doubles in ~7 years — after that, you're playing with house money.
Negotiation context
- It's been on market 55 days — a 3% lower offer ($194k) is reasonable based on typical stale-listing flexibility.
Risks & watch-outs
- Watch-outs: property tax is 3.0% of price; built in 1920 — expect roof / HVAC / electrical / plumbing capex.
- Climate carrying-cost: major wind risk, 27% chance of damaging wind over 30y; extreme-heat days projected 7→14/yr by 2055 (HVAC capex compounding) — expect insurance premiums to compound above CPI over the hold.
Questions for the listing agent
- It's been on market 55 days. Have you received any prior offers? Is the seller open to a 3% concession, seller financing, or rate buy-down credit?
- Built in 1920 — when were the roof, HVAC, electrical panel, plumbing, and water heater last replaced?
- Property tax is high relative to price — has the assessment been appealed recently, and will the sale trigger a re-assessment?
- Is there a deadline driving the sale (1031 exchange, divorce, estate, relocation)? That informs how much negotiation room exists.
- Schools are D-rated, which usually means shorter tenancies and higher turnover. Who's the typical renter profile here, and what's been the actual vacancy rate?
- Crime grade is F in this area — have there been break-ins, vandalism, or insurance claims at this property in the last 3 years? What carrier currently insures it and at what premium?
- What's the average days-on-market for RENTAL listings here right now (not sales)? A rising rental-DOM trend means longer vacancies and softer asking-rent achievability than the comps imply.
- What's the recent tenant-quality profile in this submarket — average credit score on applications, eviction rate, late-payment / NSF rate, and stable-employment percentage? A property-management company in the area should have these aggregated.
- How much new for-sale + rental construction is in the pipeline within 1–3 miles? Heavy new supply typically softens prices + rents 12–24 months out; constrained supply supports both.
Investment metrics
- 1% rule
- 1.45% ✓
- Cap rate
- 10.26%
- Cash-on-cash
- 14.16%
- DSCR
- 1.63
- GRM
- 5.7
CMA / ARV
- ARV (median comp)
- $429,561
- List price
- $199,999
- Delta
- -53.44%
- Verdict
- UNDERPRICED
- Comps
- 20 within 1.0 mi
Show comp detail 9 sales within ~0.75 mi
| Address | Dist | Beds/Ba | Sqft | Sold | Price | $/sf | Match |
|---|---|---|---|---|---|---|---|
| 823 Newington Ave | 0.23mi | 6/3.0 | 2,600 (+9%) | 1mo | $449,000 | $173 | 70 |
| 722 Reservoir St | 0.27mi | 6/2.0 | 2,560 (+7%) | 12mo | $265,000 | $104 | 66 |
| 724 Reservoir St | 0.26mi | 5/3.5 (-1) | 2,692 (+12%) | 3mo | $332,500 | $124 | 53 |
| 2125 Mcculloh St | 0.55mi | 6/3.0 | 2,220 (-7%) | 16mo | $600,000 | $270 | 45 |
| 1727 Mcculloh St | 0.71mi | 5/2.0 (-1) | 2,432 (+2%) | 19mo | $89,500 | $37 | 43 |
| 2015 Druid Hill Ave | 0.64mi | 5/4.5 (-1) | 2,430 (+2%) | 22mo | $390,000 | $160 | 34 |
| 2704 Maryland Ave | 0.73mi | 6/3.5 | 2,738 (+14%) | 7mo | $345,000 | $126 | 30 |
| 3306 Elm Ave | 0.73mi | 5/3.0 (-1) | 2,150 (-10%) | 23mo | $432,000 | $201 | 21 |
| 2802 Auchentoroly Ter | 0.74mi | 5/3.5 (-1) | 2,613 (+9%) | 22mo | $325,000 | $124 | 20 |
Match score weights: distance 35% · size 25% · config 20% · recency 20%. Top-matched comps best support the ARV.
Projected returns pro-forma
-3.0% appreciation · 6.63% rent growth · sell at horizon
- IRR
- 9.0%
- Equity multiple
- 1.37×
- Total profit
- $20,859
- Equity at exit
- $29,821
- IRR
- 21.4%
- Equity multiple
- 3.17×
- Total profit
- $121,729
- Equity at exit
- $17,292
Cash invested: $56,000 (down + closing). Projections, not guarantees.
Landlord ↔ Tenant lean methodology
- Overall (CITY)
- 12 Strongly Tenant-Friendly
- State Maryland
- 27 Tenant-Leaning · D+14
- County
- — inherits STATE
- City Baltimore
- 12 Strongly Tenant-Friendly · D+58
ZIP-level market 21217
- Rents YoY
- 6.6%
- Active inventory
- 331
- Price-to-rent
- 5.7×
Monthly cashflow live
- Estimated rent
- $2,902 high interval (Pro) →
- Mortgage (P&I)
- −$1,049
- Tax from tax record
- −$499 /mo · $5,992/yr
- Insurance
- −$83
- HOA
- −$0
- Vacancy / Maint / Mgmt
- −$609
- Net cashflow
- $661
Break-even live
UW: 25.0% down · 7.5% · 30yr · 1.5% tax · 5.0% vac · 8.0% maint · 8.0% mgmt
Financing live
Cash to close
- Down payment
- $50,000
- Closing costs
- $6,000
- Reserves months
- —
- Total cash needed
- —
Loan-product check · same deal, 3 products live
Conventional
25% down · 7.5% · 30yr
- Down + closing
- —
- Monthly P&I
- —
- Monthly cashflow
- —
- DSCR
- —
- Eligible?
- —
Personal DTI + credit; lowest rate.
DSCR
20% down · 8.5% · 30yr
- Down + closing
- —
- Monthly P&I
- —
- Monthly cashflow
- —
- DSCR
- —
- Eligible?
- —
No personal income docs; deal must DSCR.
Hard money
10% down · 12.0% · 12mo
- Down + closing
- —
- Monthly P&I
- —
- Monthly cashflow
- —
- DSCR
- —
- Eligible?
- —
Short-term bridge; refi at stabilization.
Rent comps 8 comps
| Address | Beds | Baths | Sqft | Rent | $/sqft | DOM | Units | Dist |
|---|---|---|---|---|---|---|---|---|
| 313 E 25th St Baltimore, MD | 5.0 | 2.5 | 2350 | $2,550 | $1.09 | 24d | 1 | 1.00mi |
| 3010 Guilford Ave Baltimore, MD | 5.0 | 2.5 | 2174 | $3,980 | $1.83 | 11d | 1 | 1.08mi |
| 445 E 22nd St Baltimore, MD | 6.0 | 4.5 | 3100 | $3,900 | $1.26 | 43d | 1 | 1.15mi |
| 420 E 28th St Unit 1 Baltimore, MD | 5.0 | 2.5 | 1600 | $2,600 | $1.62 | 4d | 1 | 1.16mi |
| 719 E 20th St Baltimore, MD | 5.0 | 3.0 | 2060 | $2,400 | $1.17 | 2d | 1 | 1.28mi |
| 719 E 20th St Baltimore, MD | 5.0 | 3.5 | 2060 | $3,000 | $1.46 | 24d | 1 | 1.28mi |
| 3421 University Pl Baltimore, MD | 5.0 | 2.0 | 1960 | $3,500 | $1.79 | 24d | 1 | 1.38mi |
| 2401 W North Ave Baltimore, MD | 5.0 | 2.0 | 2037 | $1,800 | $0.88 | 4d | 1 | 1.45mi |
Listing history 15 events
-
2026-06-18days on market $199,999 Active 55 DOM
-
2026-06-17days on market $199,999 Active 54 DOM
-
2026-06-16days on market $199,999 Active 53 DOM
-
2026-06-15days on market $199,999 Active 52 DOM
-
2026-06-13days on market $199,999 Active 50 DOM
-
2026-06-09days on market $199,999 Active 46 DOM
-
2026-06-08days on market $199,999 Active 45 DOM
-
2026-06-07days on market $199,999 Active 44 DOM
-
2026-06-04days on market $199,999 Active 41 DOM
-
2026-06-03days on market $199,999 Active 40 DOM
-
2026-06-02days on market $199,999 Active 39 DOM
-
2026-06-01days on market $199,999 Active 38 DOM
-
2026-05-31days on market $199,999 Active 37 DOM
-
2026-04-25$199,999 Active 302-char remark
Show marketing remark (302 chars)
Coming Soon! Opportunity awaits at 715 Druid Park Lake! Estate sale being sold as-is, where-is, with all current contents included. Priced to sell and perfect for investors or buyers looking to renovate and build equity. Highlights include parquet flooring and solid bones. Sale requires 9 signatories.
-
2026-04-16historical $199,999 302-char remark
Show marketing remark (302 chars)
Coming Soon! Opportunity awaits at 715 Druid Park Lake! Estate sale being sold as-is, where-is, with all current contents included. Priced to sell and perfect for investors or buyers looking to renovate and build equity. Highlights include parquet flooring and solid bones. Sale requires 9 signatories.
ⓘ Source: listings_history table (triggers on properties + properties_extension) + one-shot
backfill from property_details.listing_events for pre-trigger history.
Tax reassessment forecast MD · Partial reset (capped growth)
- Current annual tax
- $5,992 · $499/mo
- Projected year-2 tax
- $5,992 · $499/mo
- Expected delta
- $0/yr ($0/mo · 0.0%)
ⓘ Screening estimate from a state-policy table — verify with the county assessor before closing.
Climate risk First Street
- Flood 3/10 Moderate FEMA zone X (unshaded) · 10% chance over 30 yrs
- Wildfire 1/10 Low
- Heat 7/10 Severe 7 d/yr ≥103°F today · 14 d/yr by 30 yrs out
- Wind 6/10 Major 27% chance of damaging wind over 30 yrs
- Air quality 4/10 Moderate 6 unhealthy d/yr today · 7 by 30 yrs out
Nearby sold comps map
Loading sold comps map…
Walkable amenities ~0.75 mi
Loading nearby amenities…
Taxation est. · year 1
- Rental income
- $34,819
- − Mortgage interest
- −$11,203
- − Property taxes
- −$5,992
- − Insurance
- −$1,000
- − Repairs & maintenance
- −$2,786
- − Management
- −$2,786
- − Depreciation
- −$5,818
- Taxable income
- $5,235
- Est. tax owed @ 24.0%
- −$1,256
- After-tax cash flow
- $6,673/yr
For passive investors: Depreciation is non-cash, so a rental often shows a tax loss while cash-flowing — sheltering income. Rental losses are passive: they offset passive income freely, and up to $25,000/yr can offset ordinary (W-2) income if you actively participate and your MAGI is under $100k (phasing out to $0 by $150k); unused losses carry forward. On sale, claimed depreciation is recaptured at up to 25%, and gains may owe capital-gains tax (a 1031 exchange can defer both). Figures are a year-1 estimate at your 24.0% rate — not tax advice; consult a CPA.
Schools (NCES district)
- District
- Baltimore City Public Schools
- NCES district ID
- 2400090
- Math proficiency
- 7% ▼ -9.00%
- Reading proficiency
- 16% ▼ -5.00%
- Median HH income
- $42,108
- Composite
- 10.08/100
- National rank
- #9805
- State rank
- #24 of 24 in MD
Livability — Baltimore
- Score
- 76/100
- State rank
- #90
- US rank
- #3396
Category grades
Schools grade is shown separately in the Schools card above.
Census & demographics
- Census place
- Baltimore, MD
- County
- Baltimore City · 558,601 people
- City population
- 588,727
- Metro
- Baltimore-Columbia-Towson, MD
- Population (ZIP)
- 30,792
- Household income
- $38,409
- Rent vs Own
- Severe rent burden
- 2921.0
Population outlook (Baltimore County) Hauer SSP2
- Today (2025)
- 624,249 people
- By 2030
- 621,541 · -0.4%
- By 2040
- 609,756 · -2.3%
- By 2050
- 597,249 · -4.3%
- By 2075
- 552,236 · -11.5%
- By 2100
- 513,934 · -17.7%
Race, ethnicity, and origin ACS 2023
- Neighborhood character
- Predominantly Black (81%)
- Race & ethnicity
- Black 81% White 12% Two or more races 4% Hispanic / Latino 2% Asian 2%
- Common ancestry
- Romanian 1% Hispanic 1% Italian 1%
- Foreign-born
- 5% · Canada, China, South Korea
- Languages at home
- 94% English-only · Spanish 2% French/Haitian/Cajun 1% Chinese 1%
Political lean MEDSL · Baltimore
- 2024 margin
- Solid D (+73.0) · D 85.2% · R 12.2% · Other 2.6%
- 2008→2024 swing
- -2.5pp toward R · 2008: 75.5pp · 2024: 73.0pp
- All cycles
- 2024: D+73.0 2020: D+76.6 2016: D+74.6 2012: D+76.4 2008: D+75.5
Not yet ingested
- Civics
- —
Market trends
- HPI YoY
- ▼ -187.20%
- Current HPI
- 104.2102
- Rent YoY
- ▲ 6.63%
- Metro
- Baltimore-Columbia-Towson, MD
- State GDP YoY
- ▲ 2.97%
- F500 in state
- 12
Industry mix (Fortune 500 HQ in MD)
| Industry | F500 HQs | Revenue |
|---|---|---|
| Aerospace / Defense | 1 | $71B |
|
||
| Utilities | 1 | $25B |
|
||
| Hotels | 1 | $24B |
|
||
| Consumer Goods | 1 | $7B |
|
||
| Real Estate | 1 | $6B |
|
||
| Chemicals | 1 | $2B |
|
||
Price history
+0.0% since first listed2 events — show timeline
- 2026-04-25 Listed $199,999 BRIGHT MLS
- 2026-04-16 Coming Soon $199,999 BRIGHT MLS
Property tax history
+1.4%/yrLatest (2025): $5,992 · +5.8% YoY. Source: county tax records.
Cash-flow waterfall
monthlySold comps — $/sqft
last 12 mo · ≤1 miLoading sold comps…