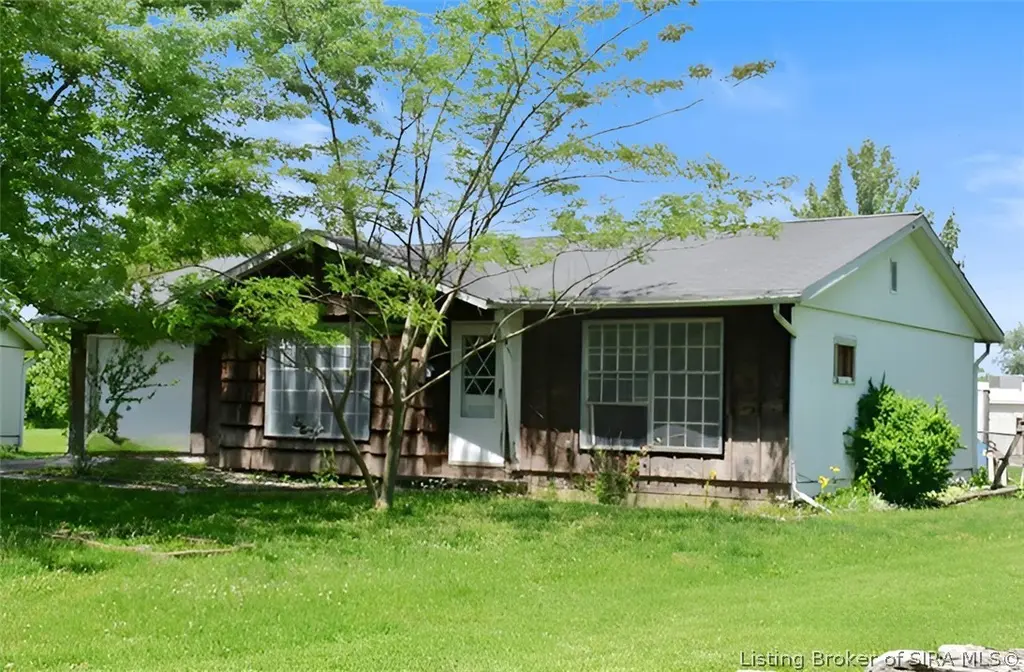
145 Odea Ct · Mitchell, IN
Flood risk 1/10 · Minimal
- FEMA flood zone
- X (unshaded)
- Chance of flooding over 30 yrs
- 0.0%
- Est. flood insurance / yr
- $507 – $1,088
Fire risk 2/10 · Minimal
- Est. fire insurance / yr
- $717 – $1,331
Heat risk 4/10 · Minor
- Hot days now (above 105°F)
- 7 days/yr
- Hot days in 30 yrs
- 19 days/yr
Wind risk 2/10 · Minimal
- Chance of severe wind over 30 yrs
- 1.0%
Air-quality risk 2/10 · Minimal
- Unhealthy air days now
- 1 days/yr
- Unhealthy air days in 30 yrs
- 2 days/yr
Risk factors via First Street. Map © Google.
Why this score? — see what drove the B grade
The composite is a weighted blend of 9 inputs, each scored 0–100. Each bar is that input's sub-score; the figure is the points it added to the 100-point composite (weight × sub-score).
- Cash flow +30.0/30.0
- 1% rule +10.0/10.0
- DSCR +10.0/10.0
- ARV discount +7.5/15.0
- Appreciation +5.3/10.0
- Livability +3.5/5.0
- Schools +2.7/10.0
- Rent growth +2.5/5.0
- Condition / age +2.5/5.0
$39,900
🖨 Deal sheet 📄 Offer letter ✓ Due diligence
Listing remarks
ATTENTION INVESTORS! CONVENIENT LOCATION ON CUL DE SAC! This sweet little home is in need of renovation and love. ALL MUST BE SUBMITTED ON PropOffers.com BY BUYERS AGENT.
Key facts
- 7,405 sq ft lot
- Garage
- Built 1971
Property features AI
Finance
- Financial info: Annual tax: $413
Exterior
- Parking: Attached 1-car garage
- Utilities: Public water connected; Public sewer
- Home design: Single-story residence; Resale property
- Construction: Metal siding; Wood siding; Shingle roof
- Exterior features: Fenced yard; Covered porch; Porch; Shed(s)
Interior
- Kitchen: Kitchen on the first floor
- Bedrooms: Three bedrooms on the first floor
- Bathrooms: One full bathroom on the first floor
- Heating & cooling: Forced air heating; Central air conditioning
- Interior features: Attic; Utility room
- Laundry & utility: Main-level laundry closet
Neighborhood map
What this means for you Summary
Snapshot
- This is a 1-bed/1.0-bath single-family listed at $40k.
Deal economics
- At list price, monthly cash flow is $760 ($9k/yr) — positive.
- The deal already cash-flows at list — no discount required.
- Meets the 1% rule at list price ($1k rent vs $40k).
- Recommended offer: $39k (3.0% below list) — sets the bar for market timing.
- Cap rate 29.1% vs local median 5.6% in Mitchell — top-decile yield for the area; either an underpriced asset or a hidden risk that comps aren't pricing in. Stress-test before assuming the spread holds.
Location & tenants
- Location reads 69/100 on livability (#187 in IN) — a middle-class / working-renter tenant base. Strengths: cost of living A+, housing A+, crime B; Watch: schools D, employment D, amenities F.
- Mitchell Community Schools (town): math 26% / reading 37% proficiency, ranked #230 of 301 in IN (top 76%) — families likely to look elsewhere, expect single-tenant / working-renter base with shorter leases.
- Market conditions: 61 active listings in the ZIP; 8 units permitted in Lawrence County in 2024 (0 in 5+ unit buildings).
Forward outlook
- In year one you build about $522 of equity ($276 loan paydown + $246 appreciation (0.6% local appreciation)).
- Lawrence County population projected at -14% by 2050 — secular population decline; favor cash flow + early exit over multi-decade hold.
- At projected returns (0.6% appreciation + 3.0% rent growth), your $11k cash investment doubles in ~2 years — after that, you're playing with house money.
Negotiation context
- It's been on market 36 days — a 3% lower offer ($39k) is reasonable based on typical stale-listing flexibility.
Questions for the listing agent
- It's been on market 36 days. Have you received any prior offers? Is the seller open to a 3% concession, seller financing, or rate buy-down credit?
- Built in 1971 — when were the roof, HVAC, electrical panel, plumbing, and water heater last replaced?
- Is there a deadline driving the sale (1031 exchange, divorce, estate, relocation)? That informs how much negotiation room exists.
- Schools are D-rated, which usually means shorter tenancies and higher turnover. Who's the typical renter profile here, and what's been the actual vacancy rate?
- What's the average days-on-market for RENTAL listings here right now (not sales)? A rising rental-DOM trend means longer vacancies and softer asking-rent achievability than the comps imply.
- What's the recent tenant-quality profile in this submarket — average credit score on applications, eviction rate, late-payment / NSF rate, and stable-employment percentage? A property-management company in the area should have these aggregated.
- How much new for-sale + rental construction is in the pipeline within 1–3 miles? Heavy new supply typically softens prices + rents 12–24 months out; constrained supply supports both.
Investment metrics
- 1% rule
- 3.27% ✓
- Cap rate
- 29.15%
- Cash-on-cash
- 81.63%
- DSCR
- 4.63
- GRM
- 2.5
CMA / ARV
- ARV (median comp)
- $150,219
- List price
- $39,900
- Delta
- -73.44%
- Verdict
- UNDERPRICED
- Comps
- 20 within 1.0 mi
Show comp detail 12 sales within ~0.75 mi
| Address | Dist | Beds/Ba | Sqft | Sold | Price | $/sf | Match |
|---|---|---|---|---|---|---|---|
| 1211 & 1209 W Main St | 0.09mi | 2/1.0 (+1) | 867 (-3%) | 1mo | $145,000 | $167 | 85 |
| 1215 W Warren St | 0.15mi | 2/1.0 (+1) | 858 (-4%) | 1mo | $150,000 | $175 | 80 |
| 844 W Frank St | 0.34mi | 2/1.0 (+1) | 908 (+2%) | 0mo | $150,000 | $165 | 76 |
| 455 S 9th St | 0.46mi | 2/1.0 (+1) | 900 (+1%) | 11mo | $167,500 | $186 | 63 |
| 512 W Mississippi Ave | 0.60mi | 2/1.0 (+1) | 852 (-4%) | 1mo | $122,000 | $143 | 58 |
| 625 S 8th St | 0.62mi | 2/1.0 (+1) | 912 (+2%) | 6mo | $145,000 | $159 | 57 |
| 507 W Oak St | 0.63mi | 2/1.0 (+1) | 912 (+2%) | 6mo | $121,000 | $133 | 57 |
| 604 Crawford St | 0.67mi | 2/1.0 (+1) | 856 (-4%) | 1mo | $164,900 | $193 | 56 |
| 609 W Grissom Ave | 0.56mi | 2/1.5 (+1) | 902 (+1%) | 15mo | $24,000 | $27 | 53 |
| 910 W Oak St | 0.38mi | 2/1.0 (+1) | 1,024 (+15%) | 1mo | $149,000 | $146 | 52 |
| 1330 W Crandall St | 0.70mi | 2/1.0 (+1) | 840 (-6%) | 4mo | $135,000 | $161 | 49 |
| 421 W Warren St | 0.66mi | 2/1.0 (+1) | 956 (+7%) | 12mo | $140,000 | $146 | 42 |
Match score weights: distance 35% · size 25% · config 20% · recency 20%. Top-matched comps best support the ARV.
Projected returns pro-forma
0.62% appreciation · 3.0% rent growth · sell at horizon
- IRR
- 84.4%
- Equity multiple
- 5.33×
- Total profit
- $48,422
- Equity at exit
- $12,829
- IRR
- 85.4%
- Equity multiple
- 10.95×
- Total profit
- $111,151
- Equity at exit
- $16,452
Cash invested: $11,172 (down + closing). Projections, not guarantees.
Landlord ↔ Tenant lean methodology
- Overall (STATE)
- 90 Strongly Landlord-Friendly
- State Indiana
- 90 Strongly Landlord-Friendly · R+11
- County
- — inherits STATE
- City
- — inherits STATE
ZIP-level market 47446
- Home prices YoY
- 0.2%
- Active inventory
- 61
- Price-to-rent
- 2.5×
Monthly cashflow live
- Estimated rent
- $1,305 medium interval (Pro) →
- Mortgage (P&I)
- −$209
- Tax from tax record
- −$45 /mo · $541/yr
- Insurance
- −$17
- HOA
- −$0
- Vacancy / Maint / Mgmt
- −$274
- Net cashflow
- $760
Break-even live
UW: 25.0% down · 7.5% · 30yr · 1.5% tax · 5.0% vac · 8.0% maint · 8.0% mgmt
Financing live
Cash to close
- Down payment
- $9,975
- Closing costs
- $1,197
- Reserves months
- —
- Total cash needed
- —
Loan-product check · same deal, 3 products live
Conventional
25% down · 7.5% · 30yr
- Down + closing
- —
- Monthly P&I
- —
- Monthly cashflow
- —
- DSCR
- —
- Eligible?
- —
Personal DTI + credit; lowest rate.
DSCR
20% down · 8.5% · 30yr
- Down + closing
- —
- Monthly P&I
- —
- Monthly cashflow
- —
- DSCR
- —
- Eligible?
- —
No personal income docs; deal must DSCR.
Hard money
10% down · 12.0% · 12mo
- Down + closing
- —
- Monthly P&I
- —
- Monthly cashflow
- —
- DSCR
- —
- Eligible?
- —
Short-term bridge; refi at stabilization.
Listing history 19 events
-
2026-06-19days on market $39,900 Active 36 DOM
-
2026-06-18days on market $39,900 Active 35 DOM
-
2026-06-17days on market $39,900 Active 34 DOM
-
2026-06-16days on market $39,900 Active 33 DOM
-
2026-06-16price $39,900 Active 32 DOM
-
2026-06-15days on market $49,900 Active 32 DOM
-
2026-06-14days on market $49,900 Active 30 DOM
-
2026-06-12days on market $49,900 Active 29 DOM
-
2026-06-09days on market $49,900 Active 26 DOM
-
2026-06-08days on market $49,900 Active 25 DOM
-
2026-06-07days on market $49,900 Active 24 DOM
-
2026-06-05days on market $49,900 Active 22 DOM
-
2026-06-03days on market $49,900 Active 20 DOM
-
2026-06-02days on market $49,900 Active 19 DOM
-
2026-06-01days on market $49,900 Active 18 DOM
-
2026-05-31days on market $49,900 Active 17 DOM
-
2026-05-30days on market $49,900 Active 16 DOM
-
2026-05-13$49,900 Active 170-char remark
-
2009-04-22soldstatus $58,000
ⓘ Source: listings_history table (triggers on properties + properties_extension) + one-shot
backfill from property_details.listing_events for pre-trigger history.
Tax reassessment forecast IN · Partial reset (capped growth)
- Current annual tax
- $541 · $45/mo
- Projected year-2 tax
- $541 · $45/mo
- Expected delta
- $0/yr ($0/mo · 0.0%)
ⓘ Screening estimate from a state-policy table — verify with the county assessor before closing.
Climate risk First Street
- Flood 1/10 Low FEMA zone X (unshaded) · 0% chance over 30 yrs
- Wildfire 2/10 Low
- Heat 4/10 Moderate 7 d/yr ≥105°F today · 19 d/yr by 30 yrs out
- Wind 2/10 Low 100% chance of damaging wind over 30 yrs
- Air quality 2/10 Low 1 unhealthy d/yr today · 2 by 30 yrs out
Nearby sold comps map
Loading sold comps map…
Walkable amenities ~0.75 mi
Loading nearby amenities…
Taxation est. · year 1
- Rental income
- $15,660
- − Mortgage interest
- −$2,235
- − Property taxes
- −$541
- − Insurance
- −$200
- − Repairs & maintenance
- −$1,253
- − Management
- −$1,253
- − Depreciation
- −$1,161
- Taxable income
- $9,018
- Est. tax owed @ 24.0%
- −$2,164
- After-tax cash flow
- $6,955/yr
For passive investors: Depreciation is non-cash, so a rental often shows a tax loss while cash-flowing — sheltering income. Rental losses are passive: they offset passive income freely, and up to $25,000/yr can offset ordinary (W-2) income if you actively participate and your MAGI is under $100k (phasing out to $0 by $150k); unused losses carry forward. On sale, claimed depreciation is recaptured at up to 25%, and gains may owe capital-gains tax (a 1031 exchange can defer both). Figures are a year-1 estimate at your 24.0% rate — not tax advice; consult a CPA.
Schools (NCES district)
- District
- Mitchell Community Schools
- NCES district ID
- 1806900
- Math proficiency
- 26% ▼ -16.00%
- Reading proficiency
- 37% ▼ -10.00%
- Median HH income
- $43,994
- Composite
- 26.83/100
- National rank
- #7113
- State rank
- #230 of 301 in IN
Livability — Mitchell
- Score
- 69/100
- State rank
- #187
- US rank
- #8606
Category grades
Schools grade is shown separately in the Schools card above.
Census & demographics
- Census place
- Mitchell, IN
- Population (ZIP)
- 9,259
Population outlook (Lawrence County) Hauer SSP2
- Today (2025)
- 44,347 people
- By 2030
- 43,331 · -2.3%
- By 2040
- 40,887 · -7.8%
- By 2050
- 38,297 · -13.6%
- By 2075
- 32,479 · -26.8%
- By 2100
- 26,051 · -41.3%
Race, ethnicity, and origin ACS 2023
- Neighborhood character
- Predominantly White (93%)
- Race & ethnicity
- White 93% Two or more races 4% Asian 2% Hispanic / Latino 1%
- Common ancestry
- Italian 3% Slovak 2% Serbian 1%
- Foreign-born
- 3% · Canada
- Languages at home
- 96% English-only · Other Indo-European 2% Spanish 1%
Political lean MEDSL · Lawrence
- 2024 margin
- Solid R (+51.0) · D 23.6% · R 74.6% · Other 1.7%
- 2008→2024 swing
- -30.5pp toward R · 2008: -20.6pp · 2024: -51.0pp
- All cycles
- 2024: R+51.0 2020: R+50.6 2016: R+51.5 2012: R+32.8 2008: R+20.6
Not yet ingested
- Civics
- —
Market trends
- HPI YoY
- ▲ 0.62%
- Current HPI
- 248.9604
- Rent YoY
- —
- Metro
- —
- State GDP YoY
- ▲ 2.90%
- F500 in state
- 18
Industry mix (Fortune 500 HQ in IN)
| Industry | F500 HQs | Revenue |
|---|---|---|
| Industrial Machinery | 2 | $37B |
|
||
| Healthcare | 1 | $177B |
|
||
| Pharmaceuticals | 1 | $45B |
|
||
| Metals / Steel | 1 | $18B |
|
||
| Agriculture | 1 | $17B |
|
||
| Packaging | 1 | $12B |
|
||
Price history
-31.2% since first listed3 events — show timeline
- 2026-06-15 Price Changed $39,900 SIRA
- 2026-05-13 Listed $49,900 SIRA
- 2009-04-22 Sold (Public Records) $58,000 Public Records
Property tax history
+1.3%/yrLatest (2025): $541 · -11.1% YoY. Source: county tax records.
Cash-flow waterfall
monthlySold comps — $/sqft
last 12 mo · ≤1 miLoading sold comps…