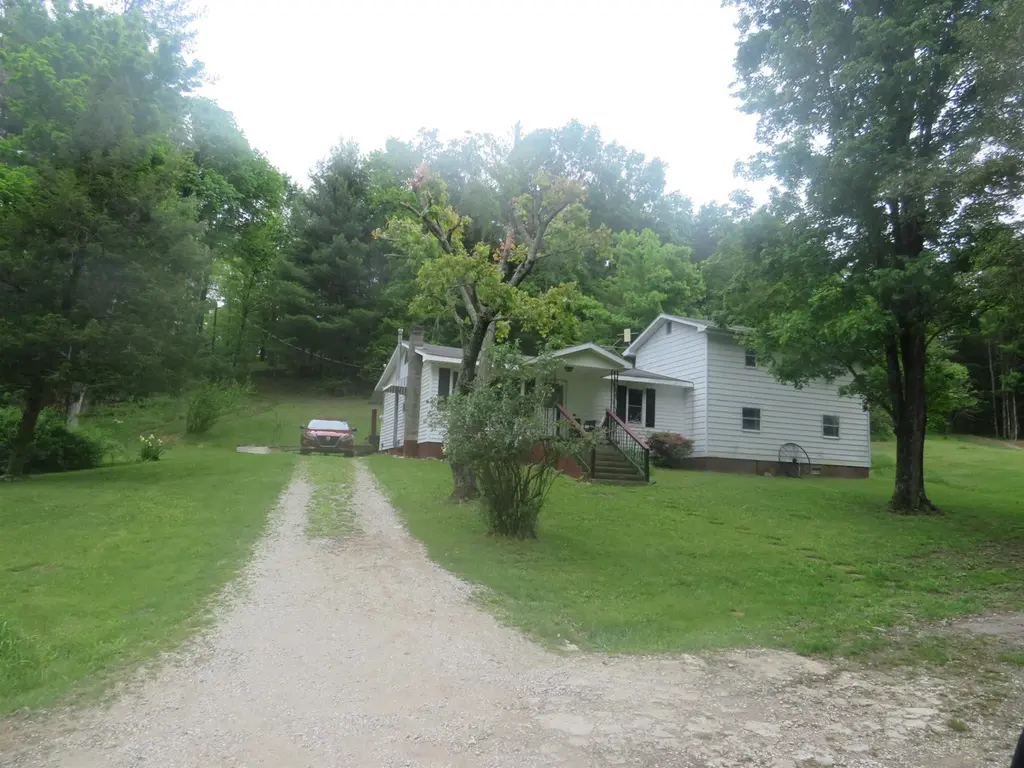
1270 Menix Rd Rd · Olive Hill, KY
Flood risk 1/10 · Minimal
- FEMA flood zone
- X (unshaded)
- Chance of flooding over 30 yrs
- 0.0%
- Est. flood insurance / yr
- $507 – $1,088
Fire risk 8/10 · Major
- Est. fire insurance / yr
- $839 – $1,559
Heat risk 3/10 · Minor
- Hot days now (above 101°F)
- 7 days/yr
- Hot days in 30 yrs
- 19 days/yr
Wind risk 2/10 · Minimal
- Chance of severe wind over 30 yrs
- 2.0%
Air-quality risk 1/10 · Minimal
- Unhealthy air days now
- 0 days/yr
- Unhealthy air days in 30 yrs
- 0 days/yr
Risk factors via First Street. Map © Google.
Why this score? — see what drove the D grade
The composite is a weighted blend of 9 inputs, each scored 0–100. Each bar is that input's sub-score; the figure is the points it added to the 100-point composite (weight × sub-score).
- ARV discount +15.0/15.0
- Cash flow +8.2/30.0
- Appreciation +5.5/10.0
- Livability +3.5/5.0
- Schools +2.9/10.0
- 1% rule +2.6/10.0
- Rent growth +2.5/5.0
- Condition / age +2.5/5.0
- DSCR +2.2/10.0
$149,000
🖨 Deal sheet (PDF) 📄 Offer letter ✓ Due diligence
Listing remarks
country living at it best house need some tlc great location just mins. from carter caves state park. just mins fromi-64 can be in ashland within 30 mins and lextington within 1 hr.
Key facts
- Country living
- Great location
- 0.7 acre lot
Tags
Property features AI
Exterior
- Parking: No dedicated parking
- Utilities: Public water; Septic tank sewer
- Home design: Single-family residence; One story
- Construction: Aluminum siding; Block foundation; Composition roof; Built above grade (finished area approximately 1,600)
- Exterior features: Porch; Cleared, rolling lot; Rolling, clear topography; Near Carter Caves, Cave Run, Grayson Lake, and Greenbo Lake
Interior
- Kitchen: Electric range; Refrigerator
- Bathrooms: 1 full bathroom
- Heating & cooling: Floor furnace heating
- Interior features: Electric range and refrigerator included; Partial, unfinished basement
Neighborhood map
What this means for you Summary
Snapshot
- This is a 3-bed/1.0-bath single-family listed at $149k.
Deal economics
- At list price, monthly cash flow is $-139 ($-2k/yr) — negative.
- To cash-flow at today's rent, offer at most $129k (13.5% below list).
- To meet the 1% rule (rent ≥ 1% of price), the offer needs to be $113k (24.4% below list).
- Recommended offer: $113k (24.4% below list) — sets the bar for 1% rule.
Location & tenants
- Location reads 70/100 on livability (#160 in KY) — a middle-class / working-renter tenant base. Strengths: crime A+, cost of living A+, housing A+; Watch: employment C-, health & safety C-, amenities F.
- Carter County (rural): math 27% / reading 43% proficiency, ranked #70 of 165 in KY (top 42%) — families likely to look elsewhere, expect single-tenant / working-renter base with shorter leases.
- Zoned schools: Carter City Elementary School (math 74% / reading 84%, grade A, #2 of 676 statewide, top 0%, 144 students, 65% FRL); East Carter Middle School (math 21% / reading 41%, grade F, #138 of 217 statewide, top 65%, 505 students, 62% FRL); West Carter County High School (math 27% / reading 37%, grade F, #97 of 254 statewide, top 46%, 522 students, 59% FRL).
- Zoned-school proficiency averages 48% at this address vs 35% district-wide (+12 pts) — the actual schools serving this property are materially stronger than the Carter County average implies; a family-tenant draw the district grade alone would hide.
- Market conditions: 49 active listings in the ZIP; 1 units permitted in Carter County in 2024 (0 in 5+ unit buildings).
Forward outlook
- In year one you build about $2k of equity ($1k loan paydown + $1k appreciation (1.0% local appreciation)).
- Carter County population projected at -21% by 2050 — secular population decline; favor cash flow + early exit over multi-decade hold.
Negotiation context
- It's been on market 44 days — a 3% lower offer ($145k) is reasonable based on typical stale-listing flexibility.
Risks & watch-outs
- Climate carrying-cost: severe wildfire risk — expect insurance premiums to compound above CPI over the hold.
Questions for the listing agent
- What do current leases actually rent for vs. the listed asking? Can we see a recent rent roll and the last 12 months of T-12 income?
- It's been on market 44 days. Have you received any prior offers? Is the seller open to a 24% concession, seller financing, or rate buy-down credit?
- Built in 1960 — when were the roof, HVAC, electrical panel, plumbing, and water heater last replaced?
- Is there a deadline driving the sale (1031 exchange, divorce, estate, relocation)? That informs how much negotiation room exists.
- Schools are D-rated, which usually means shorter tenancies and higher turnover. Who's the typical renter profile here, and what's been the actual vacancy rate?
- The area grade is low — what's the realistic commute time and amenity access for the typical tenant pool here? Any planned neighborhood developments (good or bad) we should know about?
- What's the average days-on-market for RENTAL listings here right now (not sales)? A rising rental-DOM trend means longer vacancies and softer asking-rent achievability than the comps imply.
- What's the recent tenant-quality profile in this submarket — average credit score on applications, eviction rate, late-payment / NSF rate, and stable-employment percentage? A property-management company in the area should have these aggregated.
- How much new for-sale + rental construction is in the pipeline within 1–3 miles? Heavy new supply typically softens prices + rents 12–24 months out; constrained supply supports both.
Investment metrics
- 1% rule
- 0.76% ✗
- Cap rate
- 5.17%
- Cash-on-cash
- -4.01%
- DSCR
- 0.82
- GRM
- 11.0
CMA / ARV
- ARV (median comp)
- $201,379
- List price
- $149,000
- Delta
- -26.01%
- Verdict
- UNDERPRICED
- Comps
- 3 within 2.0 mi
Projected returns pro-forma
0.98% appreciation · 3.0% rent growth · sell at horizon
- IRR
- -3.0%
- Equity multiple
- 0.85×
- Total profit
- $-6,239
- Equity at exit
- $50,697
- IRR
- 2.2%
- Equity multiple
- 1.26×
- Total profit
- $10,982
- Equity at exit
- $67,240
Cash invested: $41,720 (down + closing). Projections, not guarantees.
Landlord ↔ Tenant lean methodology
- Overall (STATE)
- 83 Strongly Landlord-Friendly
- State Kentucky
- 83 Strongly Landlord-Friendly · R+16
- County
- — inherits STATE
- City
- — inherits STATE
ZIP-level market 41164
- Home prices YoY
- 0.3%
- Active inventory
- 49
- Price-to-rent
- 11.0×
Monthly cashflow live
- Estimated rent
- $1,127 medium interval (Pro) →
- Mortgage (P&I)
- −$781
- Tax est. 1.5%
- −$186 /mo · $2,235/yr
- Insurance
- −$62
- HOA
- −$0
- Vacancy / Maint / Mgmt
- −$237
- Net cashflow
- $-139
Break-even live
Sensitivity live
| Price | -10% $-36 | -5% $-88 | +0% $-139 | +5% $-191 | +10% $-242 |
|---|---|---|---|---|---|
| Rent | -10% $-228 | -5% $-184 | +0% $-139 | +5% $-95 | +10% $-50 |
| Rate | -1.0pp $-64 | -0.5pp $-102 | base $-139 | +0.5pp $-178 | +1.0pp $-217 |
UW: 25.0% down · 7.5% · 30yr · 1.5% tax · 5.0% vac · 8.0% maint · 8.0% mgmt
Financing live
Cash to close
- Down payment
- $37,250
- Closing costs
- $4,470
- Reserves months
- —
- Total cash needed
- —
Loan-product check · same deal, 3 products live
Conventional
25% down · 7.5% · 30yr
- Down + closing
- —
- Monthly P&I
- —
- Monthly cashflow
- —
- DSCR
- —
- Eligible?
- —
Personal DTI + credit; lowest rate.
DSCR
20% down · 8.5% · 30yr
- Down + closing
- —
- Monthly P&I
- —
- Monthly cashflow
- —
- DSCR
- —
- Eligible?
- —
No personal income docs; deal must DSCR.
Hard money
10% down · 12.0% · 12mo
- Down + closing
- —
- Monthly P&I
- —
- Monthly cashflow
- —
- DSCR
- —
- Eligible?
- —
Short-term bridge; refi at stabilization.
Listing history 18 events
-
2026-06-22days on market $149,000 Active 44 DOM
-
2026-06-18days on market $149,000 Active 41 DOM
-
2026-06-17days on market $149,000 Active 40 DOM
-
2026-06-16days on market $149,000 Active 39 DOM
-
2026-06-15days on market $149,000 Active 38 DOM
-
2026-06-14days on market $149,000 Active 36 DOM
-
2026-06-13days on market $149,000 Active 35 DOM
-
2026-06-10days on market $149,000 Active 33 DOM
-
2026-06-09days on market $149,000 Active 32 DOM
-
2026-06-08days on market $149,000 Active 31 DOM
-
2026-06-07days on market $149,000 Active 30 DOM
-
2026-06-05days on market $149,000 Active 27 DOM
-
2026-06-03days on market $149,000 Active 26 DOM
-
2026-06-02days on market $149,000 Active 25 DOM
-
2026-06-01days on market $149,000 Active 24 DOM
-
2026-05-31days on market $149,000 Active 23 DOM
-
2026-05-31days on market $149,000 Active 22 DOM
-
2026-05-06$149,000 Active 182-char remark
ⓘ Source: listings_history table (triggers on properties + properties_extension) + one-shot
backfill from property_details.listing_events for pre-trigger history.
Climate risk First Street
- Flood 1/10 Low FEMA zone X (unshaded) · 0% chance over 30 yrs
- Wildfire 8/10 Severe
- Heat 3/10 Moderate 7 d/yr ≥101°F today · 19 d/yr by 30 yrs out
- Wind 2/10 Low 2% chance of damaging wind over 30 yrs
- Air quality 1/10 Low 0 unhealthy d/yr today · 0 by 30 yrs out
Nearby sold comps map
Loading sold comps map…
Walkable amenities ~0.75 mi
Loading nearby amenities…
Taxation est. · year 1
- Rental income
- $13,523
- − Mortgage interest
- −$8,346
- − Property taxes
- −$2,235
- − Insurance
- −$745
- − Repairs & maintenance
- −$1,082
- − Management
- −$1,082
- − Depreciation
- −$4,335
- Taxable loss
- −$4,302
- Est. tax savings @ 24.0%
- +$1,032
- After-tax cash flow
- $-641/yr
For passive investors: Depreciation is non-cash, so a rental often shows a tax loss while cash-flowing — sheltering income. Rental losses are passive: they offset passive income freely, and up to $25,000/yr can offset ordinary (W-2) income if you actively participate and your MAGI is under $100k (phasing out to $0 by $150k); unused losses carry forward. On sale, claimed depreciation is recaptured at up to 25%, and gains may owe capital-gains tax (a 1031 exchange can defer both). Figures are a year-1 estimate at your 24.0% rate — not tax advice; consult a CPA.
Schools (NCES district)
- District
- Carter County
- NCES district ID
- 2101020
- Math proficiency
- 27% ▼ -29.00%
- Reading proficiency
- 43% ▼ -16.00%
- Median HH income
- $34,662
- Composite
- 28.82/100
- National rank
- #6656
- State rank
- #70 of 165 in KY
Livability — Olive Hill
- Score
- 70/100
- State rank
- #160
- US rank
- #8044
Category grades
Schools grade is shown separately in the Schools card above.
Census & demographics
- Population (ZIP)
- 12,372
Population outlook (Carter County) Hauer SSP2
- Today (2025)
- 25,627 people
- By 2030
- 24,598 · -4.0%
- By 2040
- 22,429 · -12.5%
- By 2050
- 20,217 · -21.1%
- By 2075
- 15,274 · -40.4%
- By 2100
- 10,545 · -58.9%
Race, ethnicity, and origin ACS 2023
- Neighborhood character
- Predominantly White (96%)
- Race & ethnicity
- White 96% Two or more races 3% Hispanic / Latino 2%
- Common ancestry
- Slovak 2% Serbian 1% Iranian 1%
- Foreign-born
- 0%
Political lean MEDSL · Carter
- 2024 margin
- Solid R (+58.5) · D 20.2% · R 78.6% · Other 1.2%
- 2008→2024 swing
- -48.9pp toward R · 2008: -9.5pp · 2024: -58.5pp
- All cycles
- 2024: R+58.5 2020: R+52.9 2016: R+51.7 2012: R+21.3 2008: R+9.5
Not yet ingested
- Civics
- —
Market trends
- HPI YoY
- ▲ 0.98%
- Current HPI
- 288.8744
- Rent YoY
- —
- Metro
- —
- State GDP YoY
- ▲ 1.81%
- F500 in state
- 4
Industry mix (Fortune 500 HQ in KY)
| Industry | F500 HQs | Revenue |
|---|---|---|
| Healthcare | 1 | $118B |
|
||
| Food / Beverage | 1 | $7B |
|
||
Price history
1 event — show timeline
- 2026-05-06 Listed $149,000 AABOR
Property tax history
+17.1%/yrLatest (2024): $257 · -0.5% YoY. Source: county tax records.
Cash-flow waterfall
monthlySold comps — $/sqft
last 12 mo · ≤1 miLoading sold comps…