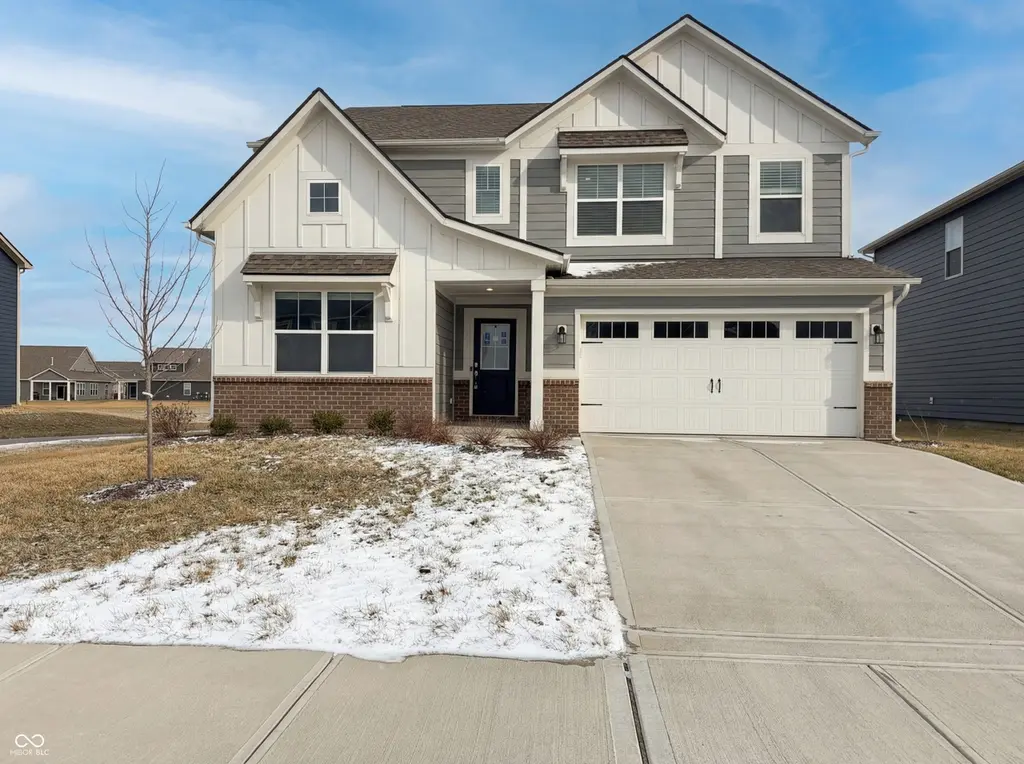
8691 Laurelton Pl · Brownsburg, IN
Flood risk No data
- FEMA flood zone
- —
- Chance of flooding over 30 yrs
- —
- Est. flood insurance / yr
- —
Fire risk No data
- Est. fire insurance / yr
- —
Heat risk No data
- Hot days now (above threshold)
- —
- Hot days in 30 yrs
- —
Wind risk No data
- Chance of severe wind over 30 yrs
- —
Air-quality risk No data
- Unhealthy air days now
- —
- Unhealthy air days in 30 yrs
- —
Risk factors via First Street. Map © Google.
Why this score? — see what drove the D- grade
The composite is a weighted blend of 9 inputs, each scored 0–100. Each bar is that input's sub-score; the figure is the points it added to the 100-point composite (weight × sub-score).
- ARV discount +10.5/15.0
- Cash flow +7.6/30.0
- Schools +6.3/10.0
- Rent growth +4.1/5.0
- Livability +3.8/5.0
- Condition / age +2.5/5.0
- 1% rule +1.9/10.0
- DSCR +1.7/10.0
- Appreciation +0.0/10.0
$420,000
🖨 Deal sheet 📄 Offer letter ✓ Due diligence
Listing remarks MLS
Welcome to 8691 Laurelton Pl, a home that exudes warmth and elegance. The living room is graced with a cozy fireplace, perfect for those chilly evenings. The kitchen is a chef's dream, boasting a convenient kitchen island and all stainless steel appliances for a sleek, modern look. The primary bathroom is a sanctuary with double sinks, providing plenty of space for your morning routine. The primary bedroom features a spacious walk-in closet, providing ample room for your wardrobe. Outside, a charming patio awaits, ideal for enjoying a cup of coffee or entertaining. Included 100-Day Home Warranty with buyer activation
Key facts
- Double sinks
- Walk-in closet
- Cozy fireplace
Tags
Neighborhood map
What this means for you Summary
Snapshot
- This is a 5-bed/3.5-bath single-family listed at $420k.
Deal economics
- At list price, monthly cash flow is $-512 ($-6k/yr) — negative.
- To cash-flow at today's rent, offer at most $330k (21.5% below list).
- To meet the 1% rule (rent ≥ 1% of price), the offer needs to be $289k (31.2% below list).
- Recommended offer: $289k (31.2% below list) — sets the bar for 1% rule.
- Cap rate 4.8% vs local median 3.8% in Brownsburg — meaningfully above typical; check what's discounted (condition, days-on-market, listing class) to confirm the premium yield is real.
Location & tenants
- Location reads 75/100 on livability (#61 in IN, #4,105 nationally) — a middle-class / working-renter tenant base. Strengths: schools A+, crime A+, employment A+; Watch: amenities F, commute F, health & safety F.
- Brownsburg Community School Corporation (suburban): math 72% / reading 72% proficiency, ranked #2 of 301 in IN (top 1%) — strong family-tenant draw, lease renewals of 3-5y typical; only 17% free/reduced lunch — higher-income household profile.
- Market conditions: Rents rising fast (+6.3%/yr); 328 active listings in the ZIP; 4 comparable units currently listed for rent nearby; rentals lingering (median 44d on market — plan ~5-8 weeks vacancy on turnover, expect pricing pressure); 50% of comp listings sitting > 30 days — soft ceiling on asking rent; high-income renter base; 1,294 units permitted in Hendricks County in 2024 (18 in 5+ unit buildings).
- This rent runs 31% of the median local income ($113k/yr) — at the standard rent-burdened threshold; future hikes will face affordability resistance.
Forward outlook
- Local home prices are declining (-3.0%/yr); year-one equity from $3k of loan paydown is wiped out by about $13k of value loss. Plan a longer hold.
- Hendricks County population projected at +35% by 2050 — long-run rental-demand tailwind backs the buy-and-hold thesis.
Negotiation context
- It's been on market 114 days — a 9% lower offer ($382k) is reasonable based on typical stale-listing flexibility.
- 2 sale attempts since 4y ago with the ask held roughly flat each time — persistent listings suggest the price (not the market) is what's stuck; bring a comps-based counter.
Questions for the listing agent
- What do current leases actually rent for vs. the listed asking? Can we see a recent rent roll and the last 12 months of T-12 income?
- It's been on market 114 days. Have you received any prior offers? Is the seller open to a 31% concession, seller financing, or rate buy-down credit?
- What does the HOA fee cover, when was the last increase, and are there any pending special assessments or reserve-fund shortfalls?
- Why hasn't it sold? Are there any deal-killer items the seller is aware of (foundation, flood, title, zoning, code violations)?
- Is there a deadline driving the sale (1031 exchange, divorce, estate, relocation)? That informs how much negotiation room exists.
- Schools are A-rated — typically a magnet for longer-tenancy family renters. What's the average tenant stay here, and is there a school-zone premium baked into asking?
- The area grade is low — what's the realistic commute time and amenity access for the typical tenant pool here? Any planned neighborhood developments (good or bad) we should know about?
- What's the average days-on-market for RENTAL listings here right now (not sales)? A rising rental-DOM trend means longer vacancies and softer asking-rent achievability than the comps imply.
- What's the recent tenant-quality profile in this submarket — average credit score on applications, eviction rate, late-payment / NSF rate, and stable-employment percentage? A property-management company in the area should have these aggregated.
- How much new for-sale + rental construction is in the pipeline within 1–3 miles? Heavy new supply typically softens prices + rents 12–24 months out; constrained supply supports both.
Investment metrics
- 1% rule
- 0.69% ✗
- Cap rate
- 4.83%
- Cash-on-cash
- -5.23%
- DSCR
- 0.77
- GRM
- 12.1
CMA / ARV
- ARV (median comp)
- $450,326
- List price
- $420,000
- Delta
- -6.73%
- Verdict
- FAIR
- Comps
- 20 within 1.0 mi
Show comp detail 12 sales within ~0.75 mi
| Address | Dist | Beds/Ba | Sqft | Sold | Price | $/sf | Match |
|---|---|---|---|---|---|---|---|
| 3267 Emmaline Dr | 0.16mi | 5/3.5 | 3,100 (0%) | 2mo | $435,000 | $140 | 91 |
| 3301 Jasper Ln | 0.07mi | 5/3.0 | 3,054 (-2%) | 3mo | $439,999 | $144 | 90 |
| 3212 Emmaline Dr | 0.16mi | 4/2.5 (-1) | 3,015 (-3%) | 4mo | $444,000 | $147 | 76 |
| 3418 Hadley Dr | 0.27mi | 5/3.0 | 3,551 (+14%) | 1mo | $505,000 | $142 | 61 |
| 3436 Hadley Dr | 0.27mi | 5/4.5 | 3,512 (+13%) | 1mo | $491,000 | $140 | 60 |
| 3924 Castle Hill Dr | 0.67mi | 5/4.0 | 3,271 (+6%) | 0mo | $450,000 | $138 | 57 |
| 3205 Fawn Cir | 0.23mi | 4/2.5 (-1) | 3,459 (+12%) | 5mo | $509,900 | $147 | 57 |
| 2870 Avebury Way | 0.44mi | 4/3.0 (-1) | 2,842 (-8%) | 3mo | $382,000 | $134 | 56 |
| 1722 Cape Hatteras Ct | 0.47mi | 4/2.5 (-1) | 2,866 (-8%) | 1mo | $380,000 | $133 | 56 |
| 1619 Beacon Pointe Blvd | 0.66mi | 5/3.0 | 3,416 (+10%) | 0mo | $463,000 | $136 | 50 |
| 2904 Arklow Way | 0.59mi | 4/2.5 (-1) | 2,732 (-12%) | 2mo | $386,500 | $141 | 42 |
| 1127 Statesman Dr | 0.75mi | 5/2.5 | 2,704 (-13%) | 6mo | $365,000 | $135 | 35 |
Match score weights: distance 35% · size 25% · config 20% · recency 20%. Top-matched comps best support the ARV.
Projected returns pro-forma
-3.0% appreciation · 6.31% rent growth · sell at horizon
- IRR
- -21.8%
- Equity multiple
- 0.23×
- Total profit
- $-90,756
- Equity at exit
- $62,623
- IRR
- -9.4%
- Equity multiple
- 0.34×
- Total profit
- $-77,458
- Equity at exit
- $36,314
Cash invested: $117,600 (down + closing). Projections, not guarantees.
Landlord ↔ Tenant lean methodology
- Overall (STATE)
- 90 Strongly Landlord-Friendly
- State Indiana
- 90 Strongly Landlord-Friendly · R+11
- County
- — inherits STATE
- City
- — inherits STATE
ZIP-level market 46112
- Rents YoY
- 6.3%
- Active inventory
- 328
- Price-to-rent
- 12.1×
Monthly cashflow live
- Estimated rent
- $2,889 medium interval (Pro) →
- Mortgage (P&I)
- −$2,203
- Tax from tax record
- −$352 /mo · $4,219/yr
- Insurance
- −$175
- HOA
- −$65
- Vacancy / Maint / Mgmt
- −$607
- Net cashflow
- $-512
Break-even live
UW: 25.0% down · 7.5% · 30yr · 1.5% tax · 5.0% vac · 8.0% maint · 8.0% mgmt
Financing live
Cash to close
- Down payment
- $105,000
- Closing costs
- $12,600
- Reserves months
- —
- Total cash needed
- —
Loan-product check · same deal, 3 products live
Conventional
25% down · 7.5% · 30yr
- Down + closing
- —
- Monthly P&I
- —
- Monthly cashflow
- —
- DSCR
- —
- Eligible?
- —
Personal DTI + credit; lowest rate.
DSCR
20% down · 8.5% · 30yr
- Down + closing
- —
- Monthly P&I
- —
- Monthly cashflow
- —
- DSCR
- —
- Eligible?
- —
No personal income docs; deal must DSCR.
Hard money
10% down · 12.0% · 12mo
- Down + closing
- —
- Monthly P&I
- —
- Monthly cashflow
- —
- DSCR
- —
- Eligible?
- —
Short-term bridge; refi at stabilization.
Rent comps 4 comps
| Address | Beds | Baths | Sqft | Rent | $/sqft | DOM | Units | Dist |
|---|---|---|---|---|---|---|---|---|
| 3245 Emmaline Dr Brownsburg, IN | 5.0 | 3.5 | 3100 | $2,800 | $0.90 | 44d | 1 | 0.15mi |
| 460 Brookview Dr Brownsburg, IN | 4.0 | 2.5 | 2240 | $2,600 | $1.16 | 44d | 1 | 0.99mi |
| 673 Hanover Rd Brownsburg, IN | 4.0 | 2.5 | 2444 | $2,300 | $0.94 | 23d | 1 | 1.06mi |
| 8802 Benjamin Ln Avon, IN | 4.0 | 3.0 | 2229 | $2,395 | $1.07 | 3d | 1 | 1.40mi |
HOA detail
- Monthly dues
- $65 · $780/yr
Listing history 18 events
-
2026-06-18days on market $420,000 Active 114 DOM
-
2026-06-17days on market $420,000 Active 113 DOM
-
2026-06-16days on market $420,000 Active 112 DOM
-
2026-06-15days on market $420,000 Active 111 DOM
-
2026-06-13days on market $420,000 Active 109 DOM
-
2026-06-09days on market $420,000 Active 105 DOM
-
2026-06-08days on market $420,000 Active 104 DOM
-
2026-06-07days on market $420,000 Active 103 DOM
-
2026-06-03days on market $420,000 Active 99 DOM
-
2026-06-02days on market $420,000 Active 98 DOM
-
2026-06-01days on market $420,000 Active 97 DOM
-
2026-05-31days on market $420,000 Active 96 DOM
-
2026-05-07price $420,000 624-char remark
Show marketing remark (624 chars)
Welcome to 8691 Laurelton Pl, a home that exudes warmth and elegance. The living room is graced with a cozy fireplace, perfect for those chilly evenings. The kitchen is a chef's dream, boasting a convenient kitchen island and all stainless steel appliances for a sleek, modern look. The primary bathroom is a sanctuary with double sinks, providing plenty of space for your morning routine. The primary bedroom features a spacious walk-in closet, providing ample room for your wardrobe. Outside, a charming patio awaits, ideal for enjoying a cup of coffee or entertaining. Included 100-Day Home Warranty with buyer activation
-
2026-03-19price $424,000 624-char remark
Show marketing remark (624 chars)
Welcome to 8691 Laurelton Pl, a home that exudes warmth and elegance. The living room is graced with a cozy fireplace, perfect for those chilly evenings. The kitchen is a chef's dream, boasting a convenient kitchen island and all stainless steel appliances for a sleek, modern look. The primary bathroom is a sanctuary with double sinks, providing plenty of space for your morning routine. The primary bedroom features a spacious walk-in closet, providing ample room for your wardrobe. Outside, a charming patio awaits, ideal for enjoying a cup of coffee or entertaining. Included 100-Day Home Warranty with buyer activation
-
2026-02-24$428,000 Active 624-char remark
Show marketing remark (624 chars)
Welcome to 8691 Laurelton Pl, a home that exudes warmth and elegance. The living room is graced with a cozy fireplace, perfect for those chilly evenings. The kitchen is a chef's dream, boasting a convenient kitchen island and all stainless steel appliances for a sleek, modern look. The primary bathroom is a sanctuary with double sinks, providing plenty of space for your morning routine. The primary bedroom features a spacious walk-in closet, providing ample room for your wardrobe. Outside, a charming patio awaits, ideal for enjoying a cup of coffee or entertaining. Included 100-Day Home Warranty with buyer activation
-
2026-02-10soldstatus $413,100
-
2022-11-30historical
-
2022-09-22$441,000 Active
ⓘ Source: listings_history table (triggers on properties + properties_extension) + one-shot
backfill from property_details.listing_events for pre-trigger history.
Tax reassessment forecast IN · Partial reset (capped growth)
- Current annual tax
- $4,219 · $352/mo
- Projected year-2 tax
- $4,219 · $352/mo
- Expected delta
- $0/yr ($0/mo · 0.0%)
ⓘ Screening estimate from a state-policy table — verify with the county assessor before closing.
Nearby sold comps map
Loading sold comps map…
Walkable amenities ~0.75 mi
Loading nearby amenities…
Taxation est. · year 1
- Rental income
- $34,664
- − Mortgage interest
- −$23,527
- − Property taxes
- −$4,219
- − Insurance
- −$2,100
- − Repairs & maintenance
- −$2,773
- − Management
- −$2,773
- − HOA
- −$780
- − Depreciation
- −$12,218
- Taxable loss
- −$13,726
- Est. tax savings @ 24.0%
- +$3,294
- After-tax cash flow
- $-2,851/yr
For passive investors: Depreciation is non-cash, so a rental often shows a tax loss while cash-flowing — sheltering income. Rental losses are passive: they offset passive income freely, and up to $25,000/yr can offset ordinary (W-2) income if you actively participate and your MAGI is under $100k (phasing out to $0 by $150k); unused losses carry forward. On sale, claimed depreciation is recaptured at up to 25%, and gains may owe capital-gains tax (a 1031 exchange can defer both). Figures are a year-1 estimate at your 24.0% rate — not tax advice; consult a CPA.
Schools (NCES district)
- District
- Brownsburg Community School Corporation
- NCES district ID
- 1801020
- Math proficiency
- 72% ▼ -5.00%
- Reading proficiency
- 72% ▼ -4.00%
- Median HH income
- $75,304
- Composite
- 63.45/100
- National rank
- #616
- State rank
- #2 of 301 in IN
Livability — Brownsburg
- Score
- 75/100
- State rank
- #61
- US rank
- #4105
Category grades
Schools grade is shown separately in the Schools card above.
Census & demographics
- Census place
- Brownsburg, IN
- County
- Hendricks County · 143,373 people
- City population
- 44,220
- Metro
- Indianapolis-Carmel-Anderson, IN
- Population (ZIP)
- 44,220
- Household income
- $112,565
- Rent vs Own
- Severe rent burden
- 614.0
Population outlook (Hendricks County) Hauer SSP2
- Today (2025)
- 187,418 people
- By 2030
- 201,494 · +7.5%
- By 2040
- 228,487 · +21.9%
- By 2050
- 253,068 · +35.0%
- By 2075
- 308,920 · +64.8%
- By 2100
- 336,510 · +79.6%
Race, ethnicity, and origin ACS 2023
- Neighborhood character
- Predominantly White (83%)
- Race & ethnicity
- White 83% Black 10% Two or more races 4% Hispanic / Latino 4%
- Common ancestry
- Slovak 3% Iranian 2% Romanian 2%
- Foreign-born
- 6% · Canada, China
- Languages at home
- 93% English-only · Spanish 2% French/Haitian/Cajun 1%
Political lean MEDSL · Hendricks
- 2024 margin
- Strong R (+21.5) · D 38.4% · R 59.9% · Other 1.7%
- 2008→2024 swing
- +1.9pp toward D · 2008: -23.4pp · 2024: -21.5pp
- All cycles
- 2024: R+21.5 2020: R+23.9 2016: R+34.2 2012: R+34.9 2008: R+23.4
Not yet ingested
- Civics
- —
Market trends
- HPI YoY
- ▼ -135.99%
- Current HPI
- 217.3787
- Rent YoY
- ▲ 6.31%
- Metro
- Indianapolis-Carmel-Anderson, IN
- State GDP YoY
- ▲ 2.90%
- F500 in state
- 18
Industry mix (Fortune 500 HQ in IN)
| Industry | F500 HQs | Revenue |
|---|---|---|
| Industrial Machinery | 2 | $37B |
|
||
| Healthcare | 1 | $177B |
|
||
| Pharmaceuticals | 1 | $45B |
|
||
| Metals / Steel | 1 | $18B |
|
||
| Agriculture | 1 | $17B |
|
||
| Packaging | 1 | $12B |
|
||
Price history
-4.8% since first listed6 events — show timeline
- 2026-05-07 Price Changed $420,000 MIBOR as Distributed by MLS Grid
- 2026-03-19 Price Changed $424,000 MIBOR as Distributed by MLS Grid
- 2026-02-24 Listed $428,000 MIBOR as Distributed by MLS Grid
- 2026-02-10 Sold (Public Records) $413,100 Public Records
- 2022-11-30 Listing Removed — MIBOR as Distributed by MLS Grid
- 2022-09-22 Listed $441,000 MIBOR as Distributed by MLS Grid
Property tax history
+2915.4%/yrLatest (2025): $4,219 · +5.3% YoY. Source: county tax records.
Cash-flow waterfall
monthlySold comps — $/sqft
last 12 mo · ≤1 miLoading sold comps…