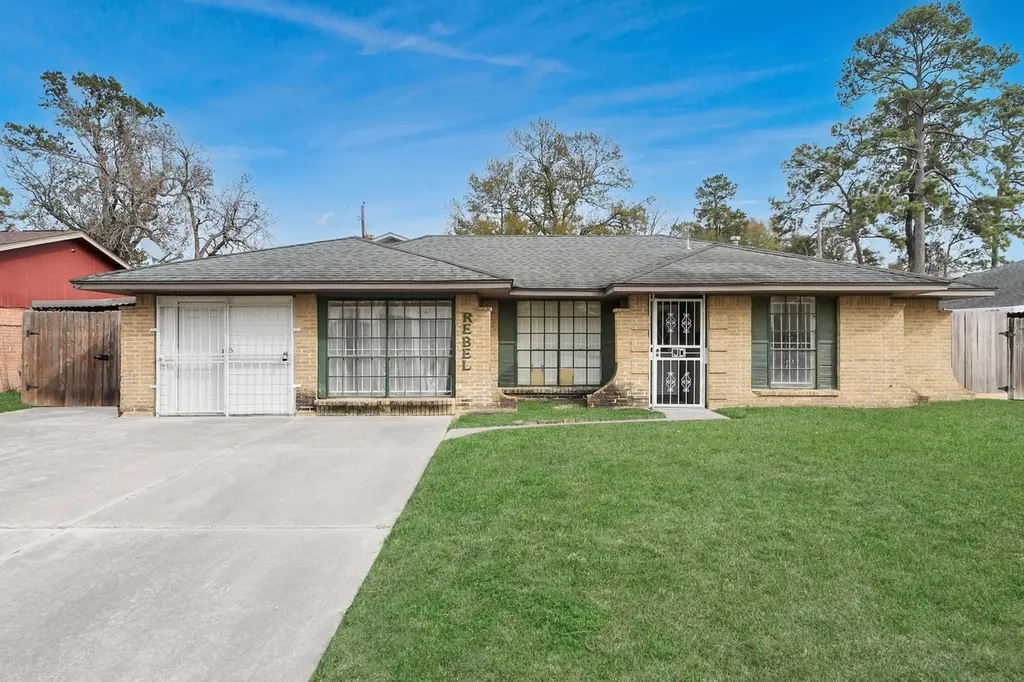
10340 Rebel Rd · Houston, TX
Flood risk 1/10 · Minimal
- FEMA flood zone
- X (unshaded)
- Chance of flooding over 30 yrs
- 0.0%
- Est. flood insurance / yr
- $507 – $1,088
Fire risk 3/10 · Minor
- Est. fire insurance / yr
- $1,222 – $2,270
Heat risk 9/10 · Severe
- Hot days now (above 110°F)
- 7 days/yr
- Hot days in 30 yrs
- 25 days/yr
Wind risk 9/10 · Severe
- Chance of severe wind over 30 yrs
- 99.0%
Air-quality risk 3/10 · Minor
- Unhealthy air days now
- 3 days/yr
- Unhealthy air days in 30 yrs
- 3 days/yr
Risk factors via First Street. Map © Google.
Why this score? — see what drove the C grade
The composite is a weighted blend of 9 inputs, each scored 0–100. Each bar is that input's sub-score; the figure is the points it added to the 100-point composite (weight × sub-score).
- ARV discount +15.0/15.0
- Cash flow +12.1/30.0
- Appreciation +9.3/10.0
- 1% rule +5.0/10.0
- Livability +3.7/5.0
- DSCR +3.6/10.0
- Schools +2.7/10.0
- Rent growth +2.6/5.0
- Condition / age +2.5/5.0
$189,900
🖨 Deal sheet (PDF) 📄 Offer letter ✓ Due diligence
Listing remarks MLS
Diamond in the rough! Excellent investment opportunity featuring a main house, cabana, and pool—perfect for buyers with vision. The main home offers two bedrooms, including a large primary suite, and a layout ideal for entertaining. The property requires updates and is priced accordingly. Back unit roof replaced in 2019; front roof age unknown. Pool and outdoor space offer strong potential. Sold AS-IS. Great value-add opportunity for investors or renovation buyers.
Key facts
- Cabana
- Pool
- Outdoor space
Tags
Neighborhood map
What this means for you Summary
Snapshot
- This is a 3-bed/1.5-bath single-family listed at $190k.
Deal economics
- At list price, monthly cash flow is $-41 ($-489/yr) — negative.
- To cash-flow at today's rent, offer at most $183k (3.8% below list).
- To meet the 1% rule (rent ≥ 1% of price), the offer needs to be $190k (0.1% below list).
- Recommended offer: $167k (12.0% below list) — sets the bar for market timing.
Location & tenants
- Location reads 74/100 on livability (#184 in TX, #4,771 nationally) — a middle-class / working-renter tenant base. Strengths: amenities A+, cost of living A+, housing A+; Watch: crime F.
- Houston ISD (urban): math 27% / reading 35% proficiency, ranked #593 of 826 in TX (top 72%) — families likely to look elsewhere, expect single-tenant / working-renter base with shorter leases; 71% free/reduced lunch — lower-income household profile, screen leases tightly.
- Zoned schools: Shadydale El (math 11% / reading 20%, grade F, #3,990 of 4,322 statewide, top 93%, 631 students, 95% FRL); Forest Brook Middle (math 12% / reading 14%, grade F, #1,609 of 1,662 statewide, top 97%, 613 students, 98% FRL); North Forest H S (math 13% / reading 18%, grade F, #1,505 of 1,632 statewide, top 92%, 974 students, 97% FRL) — zoned schools average 97% FRL vs 71% district-wide (26 pts higher); higher-poverty schools than district average — tighter screening recommended.
- Zoned-school proficiency averages 15% at this address vs 31% district-wide (-16 pts) — the specific schools serving this property underperform the Houston ISD average; the district grade overstates school quality for this exact location.
- Market conditions: Rents flat; 376 active listings in the ZIP; 28 comparable units currently listed for rent nearby; rentals at typical pace (median 23d on market — plan ~3-4 weeks tenant-placement turnaround); 29,883 units permitted in Harris County in 2024 (8,621 in 5+ unit buildings).
Forward outlook
- In year one you build about $18k of equity ($1k loan paydown + $16k appreciation (8.7% local appreciation)).
- Harris County population projected at +47% by 2050 — long-run rental-demand tailwind backs the buy-and-hold thesis.
- At projected returns (8.7% appreciation + 0.4% rent growth), your $53k cash investment doubles in ~3 years — after that, you're playing with house money.
- By year 3, paydown + projected appreciation supports a ~$44k cash-out refi (75% LTV) — recoverable capital for the next deal without selling this one.
Negotiation context
- It's been on market 121 days — a 12% lower offer ($167k) is reasonable based on typical stale-listing flexibility.
- 2 sale attempts since 9y ago; this cycle's ask has dropped $90k (32%) from the opening price — seller is motivated, your offer sets the floor, not the list.
Risks & watch-outs
- Watch-outs: property tax is 2.9% of price.
- Climate carrying-cost: severe wind risk, 99% chance of damaging wind over 30y; extreme-heat days projected 7→25/yr by 2055 (HVAC capex compounding) — expect insurance premiums to compound above CPI over the hold.
Questions for the listing agent
- What do current leases actually rent for vs. the listed asking? Can we see a recent rent roll and the last 12 months of T-12 income?
- It's been on market 121 days. Have you received any prior offers? Is the seller open to a 12% concession, seller financing, or rate buy-down credit?
- Built in 1968 — when were the roof, HVAC, electrical panel, plumbing, and water heater last replaced?
- Property tax is high relative to price — has the assessment been appealed recently, and will the sale trigger a re-assessment?
- Why hasn't it sold? Are there any deal-killer items the seller is aware of (foundation, flood, title, zoning, code violations)?
- Is there a deadline driving the sale (1031 exchange, divorce, estate, relocation)? That informs how much negotiation room exists.
- Schools are D-rated, which usually means shorter tenancies and higher turnover. Who's the typical renter profile here, and what's been the actual vacancy rate?
- Crime grade is F in this area — have there been break-ins, vandalism, or insurance claims at this property in the last 3 years? What carrier currently insures it and at what premium?
- What's the average days-on-market for RENTAL listings here right now (not sales)? A rising rental-DOM trend means longer vacancies and softer asking-rent achievability than the comps imply.
- What's the recent tenant-quality profile in this submarket — average credit score on applications, eviction rate, late-payment / NSF rate, and stable-employment percentage? A property-management company in the area should have these aggregated.
- How much new for-sale + rental construction is in the pipeline within 1–3 miles? Heavy new supply typically softens prices + rents 12–24 months out; constrained supply supports both.
Investment metrics
- 1% rule
- 1.00% ✗
- Cap rate
- 6.04%
- Cash-on-cash
- -0.92%
- DSCR
- 0.96
- GRM
- 8.3
CMA / ARV
- ARV (median comp)
- $250,000
- List price
- $189,900
- Delta
- -24.04%
- Verdict
- UNDERPRICED
- Comps
- 13 within 1.0 mi
Show comp detail 12 sales within ~0.75 mi
| Address | Dist | Beds/Ba | Sqft | Sold | Price | $/sf | Match |
|---|---|---|---|---|---|---|---|
| 7816 Laurel Gem Dr | 0.33mi | 3/2.5 | 1,826 (+3%) | 2mo | $288,740 | $158 | 75 |
| 10318 Red Orchid Dr | 0.41mi | 3/2.5 | 1,826 (+3%) | 3mo | $226,990 | $124 | 70 |
| 10306 Red Orchid Dr | 0.41mi | 3/2.5 | 1,826 (+3%) | 4mo | $296,040 | $162 | 70 |
| 10319 Vinca Minor Ln | 0.47mi | 3/2.5 | 1,826 (+3%) | 0mo | $296,290 | $162 | 69 |
| 7302 Marilyn Ln | 0.45mi | 4/2.0 (+1) | 1,811 (+2%) | 0mo | $220,000 | $121 | 69 |
| 10331 Vinca Minor Ln | 0.48mi | 3/2.5 | 1,826 (+3%) | 1mo | $296,040 | $162 | 68 |
| 7706 Tully Ave | 0.25mi | 3/2.0 | 1,600 (-10%) | 2mo | $300,000 | $188 | 68 |
| 10731 Prillerman Trails Dr | 0.53mi | 3/2.5 | 1,766 (-1%) | 3mo | $240,000 | $136 | 68 |
| 7907 Elowen Grove Dr | 0.51mi | 3/2.5 | 1,826 (+3%) | 1mo | $295,540 | $162 | 67 |
| 7450 Ida Wells Forest Dr | 0.53mi | 3/2.0 | 1,645 (-8%) | 2mo | $220,000 | $134 | 59 |
| 7203 Gore Dr | 0.48mi | 3/1.0 | 1,609 (-10%) | 2mo | $159,000 | $99 | 58 |
| 7706 Langley Rd | 0.30mi | 4/2.0 (+1) | 2,006 (+13%) | 2mo | $150,000 | $75 | 56 |
Match score weights: distance 35% · size 25% · config 20% · recency 20%. Top-matched comps best support the ARV.
Projected returns pro-forma
8.65% appreciation · 0.44% rent growth · sell at horizon
- IRR
- 19.7%
- Equity multiple
- 2.49×
- Total profit
- $78,985
- Equity at exit
- $152,732
- IRR
- 17.5%
- Equity multiple
- 5.20×
- Total profit
- $223,186
- Equity at exit
- $311,616
Cash invested: $53,172 (down + closing). Projections, not guarantees.
Landlord ↔ Tenant lean methodology
- Overall (STATE)
- 87 Strongly Landlord-Friendly
- State Texas
- 87 Strongly Landlord-Friendly · R+5
- County
- — inherits STATE
- City
- — inherits STATE
ZIP-level market 77016
- Home prices YoY
- 2.8%
- Rents YoY
- 0.4%
- Active inventory
- 376
- Price-to-rent
- 8.3×
Monthly cashflow live
- Estimated rent
- $1,897 high interval (Pro) →
- Mortgage (P&I)
- −$996
- Tax from tax record
- −$465 /mo · $5,577/yr
- Insurance
- −$79
- HOA
- −$0
- Vacancy / Maint / Mgmt
- −$398
- Net cashflow
- $-41
Break-even live
Sensitivity live
| Price | -10% $67 | -5% $13 | +0% $-41 | +5% $-95 | +10% $-148 |
|---|---|---|---|---|---|
| Rent | -10% $-191 | -5% $-116 | +0% $-41 | +5% $34 | +10% $109 |
| Rate | -1.0pp $55 | -0.5pp $8 | base $-41 | +0.5pp $-90 | +1.0pp $-140 |
UW: 25.0% down · 7.5% · 30yr · 1.5% tax · 5.0% vac · 8.0% maint · 8.0% mgmt
Financing live
Cash to close
- Down payment
- $47,475
- Closing costs
- $5,697
- Reserves months
- —
- Total cash needed
- —
Loan-product check · same deal, 3 products live
Conventional
25% down · 7.5% · 30yr
- Down + closing
- —
- Monthly P&I
- —
- Monthly cashflow
- —
- DSCR
- —
- Eligible?
- —
Personal DTI + credit; lowest rate.
DSCR
20% down · 8.5% · 30yr
- Down + closing
- —
- Monthly P&I
- —
- Monthly cashflow
- —
- DSCR
- —
- Eligible?
- —
No personal income docs; deal must DSCR.
Hard money
10% down · 12.0% · 12mo
- Down + closing
- —
- Monthly P&I
- —
- Monthly cashflow
- —
- DSCR
- —
- Eligible?
- —
Short-term bridge; refi at stabilization.
Rent comps 28 comps
| Address | Beds | Baths | Sqft | Rent | $/sqft | DOM | Units | Dist |
|---|---|---|---|---|---|---|---|---|
| 10314 Woodwick St Unit 1283919P Houston, TX | 3.0 | 2.5 | 1496 | $3,865 | $2.58 | 0d | 1 | 0.22mi |
| 7726 Spinet St Houston, TX | 4.0 | 2.0 | 1456 | $2,375 | $1.63 | 9d | 1 | 0.24mi |
| 7325 Boggess Rd Houston, TX | 3.0 | 2.0 | 1568 | $1,850 | $1.18 | 18d | 1 | 0.29mi |
| 7325 Boggess Rd Houston, TX | 3.0 | 2.0 | 1568 | $1,850 | $1.18 | 45d | 1 | 0.29mi |
| 10474 Red Orchid Dr Houston, TX | 3.0 | 2.5 | 1553 | $1,875 | $1.21 | 26d | 1 | 0.39mi |
| 7314 Saunders Rd Houston, TX | 4.0 | 2.0 | 1339 | $1,723 | $1.29 | 15d | 1 | 0.40mi |
| 7426 Bigwood St Houston, TX | 4.0 | 2.0 | 1997 | $1,850 | $0.93 | 15d | 1 | 0.50mi |
| 10750 Nyla Spring St Houston, TX | 3.0 | 2.0 | 1500 | $1,975 | $1.32 | 20d | 1 | 0.52mi |
| 10708 Lavender Cotton Ln Houston, TX | 3.0 | 2.0 | 1406 | $2,150 | $1.53 | 45d | 1 | 0.61mi |
| 8003 Alpine Bearberry Dr Houston, TX | 3.0–4.0 | 2.0–2.5 | 1696 | $2,000 | $1.18 | 9d | 1 | 0.68mi |
| 10221 Bretton Dr Houston, TX | 3.0 | 1.0 | 1350 | $1,700 | $1.26 | 26d | 1 | 0.82mi |
| 8102 Rhobell St Unit A Houston, TX | 4.0 | 3.5 | 1567 | $1,750 | $1.12 | 45d | 1 | 0.87mi |
| 8214 Parker Rd Unit B Houston, TX | 3.0 | 2.0 | 1608 | $1,560 | $0.97 | 9d | 1 | 0.96mi |
| 6823 Hanley Ln Houston, TX | 3.0 | 2.0 | 1303 | $1,610 | $1.24 | 7d | 1 | 0.99mi |
| 9410 Firnat St Unit B Houston, TX | 3.0 | 2.5 | 1500 | $1,900 | $1.27 | 45d | 1 | 1.11mi |
| 9410 Firnat St Unit A Houston, TX | 3.0 | 2.5 | 1500 | $1,900 | $1.27 | 0d | 1 | 1.11mi |
| 10329 Wicklowe St Houston, TX | 3.0 | 2.0 | 1266 | $1,400 | $1.11 | 22d | 1 | 1.14mi |
| 8314 Madera Rd Unit B Houston, TX | 3.0 | 2.5 | 1608 | $1,495 | $0.93 | 26d | 1 | 1.14mi |
| 9326 Firnat St Unit B Houston, TX | 3.0 | 2.5 | 1902 | $1,900 | $1.00 | 45d | 1 | 1.16mi |
| 9328 Firnat St Unit B Houston, TX | 3.0 | 2.5 | 1902 | $1,900 | $1.00 | 45d | 1 | 1.16mi |
| 9324 Firnat St Unit B Houston, TX | 3.0 | 2.5 | 1600 | $1,900 | $1.19 | 23d | 1 | 1.16mi |
| 9320 Firnat St Unit A Houston, TX | 3.0 | 2.5 | 1900 | $1,850 | $0.97 | 9d | 1 | 1.17mi |
| 8235 Locksley Rd Unit A Houston, TX | 3.0 | 2.5 | 1608 | $1,525 | $0.95 | 9d | 1 | 1.20mi |
| 7223 Valmont Dr Houston, TX | 4.0 | 2.0 | 1546 | $1,595 | $1.03 | 45d | 1 | 1.21mi |
| 9314 Sundown Dr Unit A Houston, TX | 3.0 | 2.5 | 1608 | $1,675 | $1.04 | 1d | 1 | 1.24mi |
| 11235 Lemond Dr Houston, TX | 3.0 | 1.0 | 1368 | $1,450 | $1.06 | 23d | 1 | 1.36mi |
| 8006 Lynette St Houston, TX | 3.0 | 1.0 | 1400 | $1,475 | $1.05 | 26d | 1 | 1.37mi |
| 7805 Woodlyn Rd Houston, TX | 4.0 | 2.0 | 1946 | $1,800 | $0.92 | 0d | 1 | 1.49mi |
Listing history 11 events
-
2026-06-01days on market $189,900 Pending 121 DOM
-
2026-05-31days on market $189,900 Pending 120 DOM
-
2026-05-18price $189,900 475-char remark
Show marketing remark (475 chars)
Diamond in the rough! Excellent investment opportunity featuring a main house, cabana, and pool—perfect for buyers with vision. The main home offers two bedrooms, including a large primary suite, and a layout ideal for entertaining. The property requires updates and is priced accordingly. Back unit roof replaced in 2019; front roof age unknown. Pool and outdoor space offer strong potential. Sold AS-IS. Great value-add opportunity for investors or renovation buyers.
-
2026-03-04price $200,000 475-char remark
Show marketing remark (475 chars)
Diamond in the rough! Excellent investment opportunity featuring a main house, cabana, and pool—perfect for buyers with vision. The main home offers two bedrooms, including a large primary suite, and a layout ideal for entertaining. The property requires updates and is priced accordingly. Back unit roof replaced in 2019; front roof age unknown. Pool and outdoor space offer strong potential. Sold AS-IS. Great value-add opportunity for investors or renovation buyers.
-
2026-02-21price $255,000 475-char remark
Show marketing remark (475 chars)
Diamond in the rough! Excellent investment opportunity featuring a main house, cabana, and pool—perfect for buyers with vision. The main home offers two bedrooms, including a large primary suite, and a layout ideal for entertaining. The property requires updates and is priced accordingly. Back unit roof replaced in 2019; front roof age unknown. Pool and outdoor space offer strong potential. Sold AS-IS. Great value-add opportunity for investors or renovation buyers.
-
2026-01-31$280,000 Active 475-char remark
Show marketing remark (475 chars)
Diamond in the rough! Excellent investment opportunity featuring a main house, cabana, and pool—perfect for buyers with vision. The main home offers two bedrooms, including a large primary suite, and a layout ideal for entertaining. The property requires updates and is priced accordingly. Back unit roof replaced in 2019; front roof age unknown. Pool and outdoor space offer strong potential. Sold AS-IS. Great value-add opportunity for investors or renovation buyers.
-
2017-05-30soldstatus Sold 367-char remark
Show marketing remark (367 chars)
Diamond in the rough! Great investment home with house, cabana and pool. The home needs work but could be the perfect home for anyone who loves to entertain. The main house has two bedrooms including the master which is huge. The cabana has an awesome party room downstairs with bar and Jacuzzi and upstairs has 3 bedrooms and 3 baths. The home also has a newer roof.
-
2017-05-30soldstatus
Show marketing remark (367 chars)
Diamond in the rough! Great investment home with house, cabana and pool. The home needs work but could be the perfect home for anyone who loves to entertain. The main house has two bedrooms including the master which is huge. The cabana has an awesome party room downstairs with bar and Jacuzzi and upstairs has 3 bedrooms and 3 baths. The home also has a newer roof.
-
2017-04-10status Pending 367-char remark
Show marketing remark (367 chars)
Diamond in the rough! Great investment home with house, cabana and pool. The home needs work but could be the perfect home for anyone who loves to entertain. The main house has two bedrooms including the master which is huge. The cabana has an awesome party room downstairs with bar and Jacuzzi and upstairs has 3 bedrooms and 3 baths. The home also has a newer roof.
-
2017-04-10$55,000 Active 367-char remark
Show marketing remark (367 chars)
Diamond in the rough! Great investment home with house, cabana and pool. The home needs work but could be the perfect home for anyone who loves to entertain. The main house has two bedrooms including the master which is huge. The cabana has an awesome party room downstairs with bar and Jacuzzi and upstairs has 3 bedrooms and 3 baths. The home also has a newer roof.
-
1988-01-02soldstatus
ⓘ Source: listings_history table (triggers on properties + properties_extension) + one-shot
backfill from property_details.listing_events for pre-trigger history.
Tax reassessment forecast TX · Resets to sale price
- Current annual tax
- $5,577 · $465/mo
- Projected year-2 tax
- $5,577 · $465/mo
- Expected delta
- $0/yr ($0/mo · 0.0%)
ⓘ Screening estimate from a state-policy table — verify with the county assessor before closing.
Climate risk First Street
- Flood 1/10 Low FEMA zone X (unshaded) · 0% chance over 30 yrs
- Wildfire 3/10 Moderate
- Heat 9/10 Extreme 7 d/yr ≥110°F today · 25 d/yr by 30 yrs out
- Wind 9/10 Extreme 99% chance of damaging wind over 30 yrs
- Air quality 3/10 Moderate 3 unhealthy d/yr today · 3 by 30 yrs out
Nearby sold comps map
Loading sold comps map…
Walkable amenities ~0.75 mi
Loading nearby amenities…
Taxation est. · year 1
- Rental income
- $22,769
- − Mortgage interest
- −$10,637
- − Property taxes
- −$5,577
- − Insurance
- −$950
- − Repairs & maintenance
- −$1,822
- − Management
- −$1,822
- − Depreciation
- −$5,524
- Taxable loss
- −$3,562
- Est. tax savings @ 24.0%
- +$855
- After-tax cash flow
- $366/yr
For passive investors: Depreciation is non-cash, so a rental often shows a tax loss while cash-flowing — sheltering income. Rental losses are passive: they offset passive income freely, and up to $25,000/yr can offset ordinary (W-2) income if you actively participate and your MAGI is under $100k (phasing out to $0 by $150k); unused losses carry forward. On sale, claimed depreciation is recaptured at up to 25%, and gains may owe capital-gains tax (a 1031 exchange can defer both). Figures are a year-1 estimate at your 24.0% rate — not tax advice; consult a CPA.
Schools (NCES district)
- District
- Houston ISD
- NCES district ID
- 4823640
- Math proficiency
- 27% ▼ -18.00%
- Reading proficiency
- 35% ▼ -6.00%
- Median HH income
- $46,054
- Composite
- 26.63/100
- National rank
- #7173
- State rank
- #593 of 826 in TX
Livability — Houston
- Score
- 74/100
- State rank
- #184
- US rank
- #4771
Category grades
Schools grade is shown separately in the Schools card above.
Census & demographics
- Census place
- Houston, TX
- County
- Harris County · 4,702,590 people
- City population
- 3,226,434
- Metro
- Houston-The Woodlands-Sugar Land, TX
- Population (ZIP)
- 29,841
- Household income
- $47,677
- Rent vs Own
- Severe rent burden
- 1297.0
Population outlook (Harris County) Hauer SSP2
- Today (2025)
- 5,571,493 people
- By 2030
- 6,089,821 · +9.3%
- By 2040
- 7,142,806 · +28.2%
- By 2050
- 8,185,864 · +46.9%
- By 2075
- 10,574,329 · +89.8%
- By 2100
- 12,109,958 · +117.4%
Race, ethnicity, and origin ACS 2023
- Neighborhood character
- Majority Black (56%)
- Race & ethnicity
- Black 56% Hispanic / Latino 42% Two or more races 28%
- Hispanic origin (detail)
- Mexican 34%
- Foreign-born
- 18% · Canada
- Languages at home
- 61% English-only · Spanish 37%
Political lean MEDSL · Harris
- 2024 margin
- Lean D (+5.5) · D 52.0% · R 46.4% · Other 1.6%
- 2008→2024 swing
- +3.9pp toward D · 2008: 1.6pp · 2024: 5.5pp
- All cycles
- 2024: D+5.5 2020: D+13.3 2016: D+12.4 2012: D+0.1 2008: D+1.6
Not yet ingested
- Civics
- —
Market trends
- HPI YoY
- ▲ 8.65%
- Current HPI
- 315.6765
- Rent YoY
- ▲ 0.44%
- Metro
- Houston-The Woodlands-Sugar Land, TX
- State GDP YoY
- ▲ 3.95%
- F500 in state
- 110
Industry mix (Fortune 500 HQ in TX)
| Industry | F500 HQs | Revenue |
|---|---|---|
| Energy | 16 | $1,198B |
|
||
| Technology | 5 | $198B |
|
||
| Engineering / Construction | 4 | $72B |
|
||
| Energy Services | 3 | $60B |
|
||
| Utilities | 3 | $41B |
|
||
| Healthcare | 2 | $330B |
|
||
Price history
+245.3% since first listed9 events — show timeline
- 2026-05-18 Price Changed $189,900 HARMLS
- 2026-03-04 Price Changed $200,000 HARMLS
- 2026-02-21 Price Changed $255,000 HARMLS
- 2026-01-31 Listed $280,000 HARMLS
- 2017-05-30 Sold (Public Records) — Public Records
- 2017-05-30 Sold (MLS) — HARMLS
- 2017-04-10 Pending — HARMLS
- 2017-04-10 Listed $55,000 HARMLS
- 1988-01-02 Sold (Public Records) — Public Records
Property tax history
+4.6%/yrLatest (2025): $5,577 · +1.6% YoY. Source: county tax records.
Cash-flow waterfall
monthlySold comps — $/sqft
last 12 mo · ≤1 miLoading sold comps…