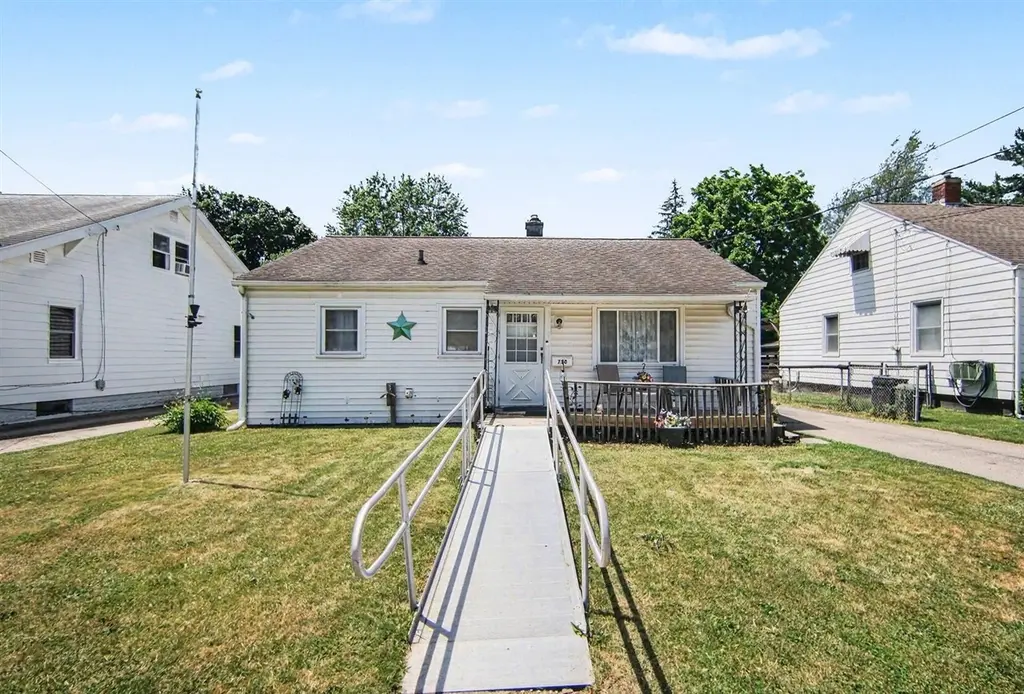
718 N Elm Ave · Jackson, MI
Flood risk 1/10 · Minimal
- FEMA flood zone
- X (unshaded)
- Chance of flooding over 30 yrs
- 0.0%
- Est. flood insurance / yr
- $473 – $860
Fire risk 2/10 · Minimal
- Est. fire insurance / yr
- $784 – $1,456
Heat risk 3/10 · Minor
- Hot days now (above 97°F)
- 7 days/yr
- Hot days in 30 yrs
- 15 days/yr
Wind risk 2/10 · Minimal
- Chance of severe wind over 30 yrs
- —
Air-quality risk 2/10 · Minimal
- Unhealthy air days now
- 1 days/yr
- Unhealthy air days in 30 yrs
- 1 days/yr
Risk factors via First Street. Map © Google.
Why this score? — see what drove the C grade
The composite is a weighted blend of 9 inputs, each scored 0–100. Each bar is that input's sub-score; the figure is the points it added to the 100-point composite (weight × sub-score).
- Cash flow +24.4/30.0
- ARV discount +8.7/15.0
- DSCR +7.9/10.0
- 1% rule +6.1/10.0
- Livability +3.7/5.0
- Rent growth +2.5/5.0
- Condition / age +2.5/5.0
- Schools +1.8/10.0
- Appreciation +0.0/10.0
$112,000
🖨 Deal sheet 📄 Offer letter ✓ Due diligence
Listing remarks MLS
CHEAPER THAN RENT! A great choice for first-time homebuyers or those in the retirement stage looking for one level living. This charming 3-bedroom, 1-bath bungalow offers easy, comfortable living in a convenient location. Enjoy a fully fenced backyard, perfect for pets or play, along with a newer back deck ideal for relaxing or entertaining. A detached garage adds great storage and functionality. Situated just minutes from I-94 for smooth commuting and located up the street from Kiwanis Park, this home blends everyday practicality with nearby outdoor recreation.
Key facts
- 6,970 sq ft lot
- Garage
- Built 1950
Property features AI
Finance
- Financial info: Home warranty included
Exterior
- Parking: Detached 1-car garage
- Utilities: Public water
- Home design: Single family residence; Residential property; Built in 1950
- Construction: Vinyl siding
- Exterior features: Sidewalk; Shed(s); Paved road access; Public water
Interior
- Kitchen: Oven; Refrigerator; Freezer
- Bathrooms: 1 full bathroom
- Heating & cooling: Forced air heating; Window air conditioning unit(s)
- Interior features: Ramped entrance; Grab bar in main floor bathroom; Window treatments
- Laundry & utility: Washer; Dryer
Neighborhood map
What this means for you Summary
Snapshot
- This is a 3-bed/1.0-bath single-family listed at $112k.
Deal economics
- At list price, monthly cash flow is $228 ($3k/yr) — positive.
- The deal already cash-flows at list — no discount required.
- Meets the 1% rule at list price ($1k rent vs $112k).
- Cap rate 8.7% vs local median 5.4% in Jackson — top-decile yield for the area; either an underpriced asset or a hidden risk that comps aren't pricing in. Stress-test before assuming the spread holds.
Location & tenants
- Location reads 74/100 on livability (#197 in MI, #4,970 nationally) — a middle-class / working-renter tenant base. Strengths: cost of living A+, housing A+, health & safety A+; Watch: schools D, crime F, employment F.
- Jackson Public Schools (urban): math 15% / reading 28% proficiency, ranked #458 of 540 in MI (top 85%) — low school quality limits family demand, transient renter base, plan for 1-2y turnover; 63% free/reduced lunch — lower-income household profile, screen leases tightly.
- Market conditions: 79 active listings in the ZIP; 4 comparable units currently listed for rent nearby; rentals lingering (median 44d on market — plan ~5-8 weeks vacancy on turnover, expect pricing pressure); 100% of comp listings sitting > 30 days — soft ceiling on asking rent; 317 units permitted in Jackson County in 2024 (103 in 5+ unit buildings).
Forward outlook
- Local home prices are declining (-3.0%/yr); year-one equity from $774 of loan paydown is wiped out by about $3k of value loss. Plan a longer hold.
- Jackson County population projected at -13% by 2050 — secular population decline; favor cash flow + early exit over multi-decade hold.
Negotiation context
- Only 6 days on market — expect competitive offers; lowballing is unlikely to land.
- 2 sale attempts with the ask held roughly flat each time — persistent listings suggest the price (not the market) is what's stuck; bring a comps-based counter.
Risks & watch-outs
- Watch-outs: built in 1950 — expect roof / HVAC / electrical / plumbing capex.
Questions for the listing agent
- Built in 1950 — when were the roof, HVAC, electrical panel, plumbing, and water heater last replaced?
- Is there a deadline driving the sale (1031 exchange, divorce, estate, relocation)? That informs how much negotiation room exists.
- Schools are D-rated, which usually means shorter tenancies and higher turnover. Who's the typical renter profile here, and what's been the actual vacancy rate?
- Crime grade is F in this area — have there been break-ins, vandalism, or insurance claims at this property in the last 3 years? What carrier currently insures it and at what premium?
- What's the average days-on-market for RENTAL listings here right now (not sales)? A rising rental-DOM trend means longer vacancies and softer asking-rent achievability than the comps imply.
- What's the recent tenant-quality profile in this submarket — average credit score on applications, eviction rate, late-payment / NSF rate, and stable-employment percentage? A property-management company in the area should have these aggregated.
- How much new for-sale + rental construction is in the pipeline within 1–3 miles? Heavy new supply typically softens prices + rents 12–24 months out; constrained supply supports both.
Investment metrics
- 1% rule
- 1.11% ✓
- Cap rate
- 8.73%
- Cash-on-cash
- 8.72%
- DSCR
- 1.39
- GRM
- 7.5
CMA / ARV
- ARV (on-the-fly)
- $115,080
- Comps found
- 12
Show comp detail 12 sales within ~0.75 mi
| Address | Dist | Beds/Ba | Sqft | Sold | Price | $/sf | Match |
|---|---|---|---|---|---|---|---|
| 708 Orange St | 0.25mi | 2/1.0 (-1) | 844 (+0%) | 6mo | $114,000 | $135 | 77 |
| 1324 E North St | 0.19mi | 2/1.0 (-1) | 875 (+4%) | 6mo | $113,000 | $129 | 74 |
| 1402 Floral Ave | 0.24mi | 2/1.0 (-1) | 768 (-9%) | 2mo | $130,000 | $169 | 68 |
| 431 Orange St | 0.21mi | 2/1.0 (-1) | 924 (+10%) | 2mo | $127,500 | $138 | 67 |
| 1022 Ellery Ave | 0.47mi | 3/1.0 | 898 (+7%) | 3mo | $136,100 | $152 | 64 |
| 1110 E North St | 0.34mi | 2/1.0 (-1) | 918 (+9%) | 1mo | $124,000 | $135 | 63 |
| 907 N Elm Ave | 0.24mi | 2/1.0 (-1) | 936 (+11%) | 3mo | $84,000 | $90 | 62 |
| 619 N State St | 0.72mi | 3/1.0 | 864 (+3%) | 3mo | $118,467 | $137 | 59 |
| 1004 Seymour Ave | 0.36mi | 2/1.0 (-1) | 918 (+9%) | 6mo | $82,500 | $90 | 58 |
| 615 Rock St | 0.66mi | 2/1.0 (-1) | 936 (+11%) | 3mo | $69,000 | $74 | 43 |
| 125 N Elm Ave | 0.58mi | 2/1.5 (-1) | 960 (+14%) | 2mo | $189,000 | $197 | 41 |
| 130 N Horton St | 0.63mi | 2/1.0 (-1) | 732 (-13%) | 6mo | $120,000 | $164 | 39 |
Match score weights: distance 35% · size 25% · config 20% · recency 20%. Top-matched comps best support the ARV.
Projected returns pro-forma
-3.0% appreciation · 3.0% rent growth · sell at horizon
- IRR
- -3.1%
- Equity multiple
- 0.88×
- Total profit
- $-3,626
- Equity at exit
- $16,700
- IRR
- 6.6%
- Equity multiple
- 1.50×
- Total profit
- $15,567
- Equity at exit
- $9,684
Cash invested: $31,360 (down + closing). Projections, not guarantees.
Landlord ↔ Tenant lean methodology
- Overall (STATE)
- 62 Landlord-Friendly
- State Michigan
- 62 Landlord-Friendly · EVEN
- County
- — inherits STATE
- City
- — inherits STATE
ZIP-level market 49202
- Active inventory
- 79
- Price-to-rent
- 7.5×
Monthly cashflow live
- Estimated rent
- $1,247 medium interval (Pro) →
- Mortgage (P&I)
- −$587
- Tax from tax record
- −$123 /mo · $1,475/yr
- Insurance
- −$47
- HOA
- −$0
- Vacancy / Maint / Mgmt
- −$262
- Net cashflow
- $228
Break-even live
UW: 25.0% down · 7.5% · 30yr · 1.5% tax · 5.0% vac · 8.0% maint · 8.0% mgmt
Financing live
Cash to close
- Down payment
- $28,000
- Closing costs
- $3,360
- Reserves months
- —
- Total cash needed
- —
Loan-product check · same deal, 3 products live
Conventional
25% down · 7.5% · 30yr
- Down + closing
- —
- Monthly P&I
- —
- Monthly cashflow
- —
- DSCR
- —
- Eligible?
- —
Personal DTI + credit; lowest rate.
DSCR
20% down · 8.5% · 30yr
- Down + closing
- —
- Monthly P&I
- —
- Monthly cashflow
- —
- DSCR
- —
- Eligible?
- —
No personal income docs; deal must DSCR.
Hard money
10% down · 12.0% · 12mo
- Down + closing
- —
- Monthly P&I
- —
- Monthly cashflow
- —
- DSCR
- —
- Eligible?
- —
Short-term bridge; refi at stabilization.
Rent comps 4 comps
| Address | Beds | Baths | Sqft | Rent | $/sqft | DOM | Units | Dist |
|---|---|---|---|---|---|---|---|---|
| 1604 Homewild Ave Jackson, MI | 2.0 | 1.0 | 726 | $1,100 | $1.52 | 43d | 1 | 0.54mi |
| 408 N Perrine St Jackson, MI | 3.0 | 1.0 | 990 | $1,350 | $1.36 | 43d | 1 | 0.93mi |
| 2921 Woods Circle Dr Jackson, MI | 1.0–3.0 | 1.0–2.0 | 872 | $1,335 | $1.53 | 43d | 11 | 1.07mi |
| 159 W Pearl St Unit 202 Jackson, MI | 2.0 | 1.0 | 1000 | $1,350 | $1.35 | 43d | 1 | 1.48mi |
Listing history 7 events
-
2026-06-19days on market $112,000 Active 6 DOM
-
2026-06-18days on market $112,000 Active 5 DOM
-
2026-06-17days on market $112,000 Active 4 DOM
-
2026-06-16days on market $112,000 Active 3 DOM
-
2026-06-15days on market $112,000 Active 2 DOM
-
2026-06-14remarks 568-char remark
-
2026-06-14$112,000 Active 1 DOM
ⓘ Source: listings_history table (triggers on properties + properties_extension) + one-shot
backfill from property_details.listing_events for pre-trigger history.
Tax reassessment forecast MI · Partial reset (capped growth)
- Current annual tax
- $1,475 · $123/mo
- Projected year-2 tax
- $1,600 · $133/mo
- Expected delta
- +$125/yr (+$10/mo · 8.5%)
ⓘ Screening estimate from a state-policy table — verify with the county assessor before closing.
Climate risk First Street
- Flood 1/10 Low FEMA zone X (unshaded) · 0% chance over 30 yrs
- Wildfire 2/10 Low
- Heat 3/10 Moderate 7 d/yr ≥97°F today · 15 d/yr by 30 yrs out
- Wind 2/10 Low
- Air quality 2/10 Low 1 unhealthy d/yr today · 1 by 30 yrs out
Nearby sold comps map
Loading sold comps map…
Walkable amenities ~0.75 mi
Loading nearby amenities…
Taxation est. · year 1
- Rental income
- $14,959
- − Mortgage interest
- −$6,274
- − Property taxes
- −$1,475
- − Insurance
- −$560
- − Repairs & maintenance
- −$1,197
- − Management
- −$1,197
- − Depreciation
- −$3,258
- Taxable income
- $999
- Est. tax owed @ 24.0%
- −$240
- After-tax cash flow
- $2,495/yr
For passive investors: Depreciation is non-cash, so a rental often shows a tax loss while cash-flowing — sheltering income. Rental losses are passive: they offset passive income freely, and up to $25,000/yr can offset ordinary (W-2) income if you actively participate and your MAGI is under $100k (phasing out to $0 by $150k); unused losses carry forward. On sale, claimed depreciation is recaptured at up to 25%, and gains may owe capital-gains tax (a 1031 exchange can defer both). Figures are a year-1 estimate at your 24.0% rate — not tax advice; consult a CPA.
Schools (NCES district)
- District
- Jackson Public Schools
- NCES district ID
- 2619620
- Math proficiency
- 15% ▼ -6.00%
- Reading proficiency
- 28% ▼ -3.00%
- Median HH income
- $38,344
- Composite
- 17.99/100
- National rank
- #8986
- State rank
- #458 of 540 in MI
Livability — Jackson
- Score
- 74/100
- State rank
- #197
- US rank
- #4970
Category grades
Schools grade is shown separately in the Schools card above.
Census & demographics
- Census place
- Jackson, MI
- City population
- 85,581
- Population (ZIP)
- 18,763
Population outlook (Jackson County) Hauer SSP2
- Today (2025)
- 156,365 people
- By 2030
- 153,123 · -2.1%
- By 2040
- 144,981 · -7.3%
- By 2050
- 135,671 · -13.2%
- By 2075
- 113,833 · -27.2%
- By 2100
- 86,592 · -44.6%
Race, ethnicity, and origin ACS 2023
- Neighborhood character
- Predominantly White (75%)
- Race & ethnicity
- White 75% Two or more races 11% Black 10% Hispanic / Latino 5% Asian 1%
- Common ancestry
- Romanian 9% Iranian 2% Lithuanian 2%
- Foreign-born
- 3% · Canada
- Languages at home
- 94% English-only · Spanish 3% Other Asian/Pacific 1% Arabic 1%
Political lean MEDSL · Jackson
- 2024 margin
- Strong R (+21.3) · D 38.6% · R 59.9% · Other 1.5%
- 2008→2024 swing
- -23.7pp toward R · 2008: 2.4pp · 2024: -21.3pp
- All cycles
- 2024: R+21.3 2020: R+19.0 2016: R+20.1 2012: R+5.8 2008: D+2.4
Not yet ingested
- Civics
- —
Market trends
- HPI YoY
- ▼ -175.30%
- Current HPI
- 170.3682
- Rent YoY
- —
- Metro
- —
- State GDP YoY
- ▲ 1.37%
- F500 in state
- 28
Industry mix (Fortune 500 HQ in MI)
| Industry | F500 HQs | Revenue |
|---|---|---|
| Automotive Parts | 3 | $48B |
|
||
| Automotive | 2 | $372B |
|
||
| Chemicals | 1 | $45B |
|
||
| Automotive Retail | 1 | $29B |
|
||
| Healthcare / Medical Devices | 1 | $23B |
|
||
| Automotive Technology | 1 | $20B |
|
||
Price history
+0.0% since first listed2 events — show timeline
- 2026-06-13 Listed $112,000 MiRealSource-MiMLS
- 2026-06-13 Listed $112,000 SW Michigan MLS
Property tax history
+6.4%/yrLatest (2025): $1,475 · +6.0% YoY. Source: county tax records.
Cash-flow waterfall
monthlySold comps — $/sqft
last 12 mo · ≤1 miLoading sold comps…