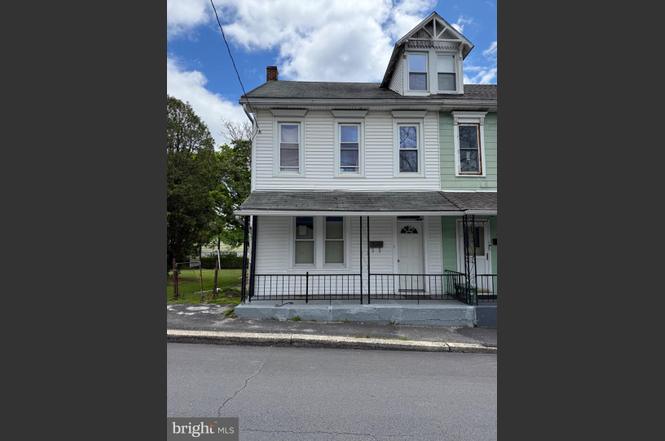
328 E Oak St · West Mahanoy, PA
Flood risk 1/10 · Minimal
- FEMA flood zone
- X (unshaded)
- Chance of flooding over 30 yrs
- 0.0%
- Est. flood insurance / yr
- $473 – $860
Fire risk 3/10 · Minor
- Est. fire insurance / yr
- $511 – $949
Heat risk 3/10 · Minor
- Hot days now (above 92°F)
- 7 days/yr
- Hot days in 30 yrs
- 16 days/yr
Wind risk 4/10 · Minor
- Chance of severe wind over 30 yrs
- 8.0%
Air-quality risk 2/10 · Minimal
- Unhealthy air days now
- 1 days/yr
- Unhealthy air days in 30 yrs
- 1 days/yr
Risk factors via First Street. Map © Google.
Why this score? — see what drove the C- grade
The composite is a weighted blend of 9 inputs, each scored 0–100. Each bar is that input's sub-score; the figure is the points it added to the 100-point composite (weight × sub-score).
- Cash flow +16.3/30.0
- ARV discount +15.0/15.0
- DSCR +5.0/10.0
- 1% rule +4.1/10.0
- Rent growth +2.5/5.0
- Livability +2.5/5.0
- Condition / age +2.5/5.0
- Schools +2.4/10.0
- Appreciation +0.0/10.0
$135,000
🖨 Deal sheet (PDF) 📄 Offer letter ✓ Due diligence
Listing remarks
Welcome to this beautifully renovated property seeking its new owners. Situated in the tranquil borough of Frackville, at the end of a street and conveniently close to I-81, this property offers privacy while providing access to the area’s diverse amenities! Renovated in 2025, this property provides new owners with peace of mind and a seamless transition during the move-in process. It features three bedrooms, one and a half full bathrooms, a spacious attic, and an interior space of approximately 1,800 square feet. Located on a 0.14-acre lot, this property caters to a wide range of preferences! The furniture within the property is negotiable, the property is being sold as is, and perso
Key facts
- Built 1897
- Listed 25 days
Property features AI
Finance
- Other: Not in a federal flood zone; 2+ access exits (accessibility feature); Below-grade unfinished area approximately 200 (source: estimated); Above-grade finished area approximately 1,800 (source: estimated); Total of 14 rooms; Two electric fireplaces (electric)
Exterior
- Parking: On-street parking
- Utilities: Public water; Public sewer; Municipal trash service
- Home design: Semi-detached; Three levels; Building winterized; Fee simple ownership; Estimated effective year of major remodel 2025; Estimated year built (source: estimated)
- Construction: Vinyl siding and masonry exterior; Permanent foundation; Above-grade and below-grade structures
- Exterior features: Porch(es); BBQ grill; Exterior lighting and flood lights; Gutter system; Rear yard; Backs to trees; Adjoins open space; Level, cleared and open lot; Private setting; Road frontage; Side yard(s)
Interior
- Kitchen: Stainless steel appliances; Electric oven/range
- Bedrooms: Three bedrooms on the first upper level
- Flooring: Luxury vinyl plank
- Bathrooms: One full bathroom (all upper levels); One half bathroom on the main level
- Heating & cooling: Electric baseboard heat; Window cooling units; Other cooling; 60+ gallon hot water tank; 100 amp electrical service; Electric heating and cooling fuel
- Interior features: Attic; Dining area; Master bath; Sun/Florida room; Foyer; Family room; Storage room; Basement (interior access, poured concrete, unfinished); Furnished
- Laundry & utility: Washer and electric dryer in unit; Main-floor laundry
Neighborhood map
What this means for you Summary
Snapshot
- This is a 3-bed/1.0-bath townhouse listed at $135k.
Deal economics
- At list price, monthly cash flow is $74 ($888/yr) — positive.
- The deal already cash-flows at list — no discount required.
- To meet the 1% rule (rent ≥ 1% of price), the offer needs to be $123k (8.8% below list).
- Recommended offer: $123k (8.8% below list) — sets the bar for 1% rule.
Location & tenants
- Location reads: area grade C — affects rentability + tenant quality, not the cash-flow math above.
- Shenandoah Valley SD (town): math 20% / reading 38% proficiency, ranked #454 of 539 in PA (top 84%) — low school quality limits family demand, transient renter base, plan for 1-2y turnover; 66% free/reduced lunch — lower-income household profile, screen leases tightly.
- Zoned schools: Shenandoah Valley El Sch (math 21% / reading 41%, grade F, #1,116 of 1,518 statewide, top 74%, 667 students, 100% FRL); Shenandoah Valley Jshs (math 22% / reading 32%, grade F, #365 of 437 statewide, top 85%, 539 students, 96% FRL) — zoned schools average 98% FRL vs 66% district-wide (32 pts higher); higher-poverty schools than district average — tighter screening recommended.
- Market conditions: 34 active listings in the ZIP; 169 units permitted in Schuylkill County in 2024 (0 in 5+ unit buildings).
Forward outlook
- Local home prices are declining (-3.0%/yr); year-one equity from $933 of loan paydown is wiped out by about $4k of value loss. Plan a longer hold.
- Schuylkill County population projected at -16% by 2050 — secular population decline; favor cash flow + early exit over multi-decade hold.
Negotiation context
- It's been on market 25 days — a 2% lower offer ($133k) is reasonable based on typical stale-listing flexibility.
- Current owner paid $60k; list at $135k implies a 125% gain — meaningful room to come down on a strong offer.
Risks & watch-outs
- Watch-outs: built in 1897 — expect roof / HVAC / electrical / plumbing capex.
Questions for the listing agent
- Built in 1897 — when were the roof, HVAC, electrical panel, plumbing, and water heater last replaced?
- Is there a deadline driving the sale (1031 exchange, divorce, estate, relocation)? That informs how much negotiation room exists.
- What's the average days-on-market for RENTAL listings here right now (not sales)? A rising rental-DOM trend means longer vacancies and softer asking-rent achievability than the comps imply.
- What's the recent tenant-quality profile in this submarket — average credit score on applications, eviction rate, late-payment / NSF rate, and stable-employment percentage? A property-management company in the area should have these aggregated.
- How much new for-sale + rental construction is in the pipeline within 1–3 miles? Heavy new supply typically softens prices + rents 12–24 months out; constrained supply supports both.
Investment metrics
- 1% rule
- 0.91% ✗
- Cap rate
- 6.95%
- Cash-on-cash
- 2.35%
- DSCR
- 1.10
- GRM
- 9.1
CMA / ARV
- ARV (on-the-fly)
- $163,618
- Comps found
- 12
Show comp detail 12 sales within ~0.75 mi
| Address | Dist | Beds/Ba | Sqft | Sold | Price | $/sf | Match |
|---|---|---|---|---|---|---|---|
| 145 N Railroad Ave | 0.33mi | 3/2.0 | 1,800 (+0%) | 1mo | $149,900 | $83 | 80 |
| 34 S Broad Mountain Ave | 0.12mi | 3/2.0 | 1,758 (-2%) | 13mo | $180,000 | $102 | 76 |
| 120 E Chestnut St | 0.17mi | 4/2.0 (+1) | 1,610 (-10%) | 2mo | $170,000 | $106 | 64 |
| 337 W Frack St | 0.54mi | 3/1.0 | 1,857 (+3%) | 6mo | $148,830 | $80 | 64 |
| 232 S Broad Mountain Ave | 0.19mi | 3/1.0 | 1,561 (-13%) | 9mo | $154,000 | $99 | 62 |
| 409 S Middle St | 0.37mi | 4/1.0 (+1) | 1,625 (-10%) | 10mo | $137,000 | $84 | 53 |
| 37 S Center St | 0.46mi | 4/1.0 (+1) | 1,650 (-8%) | 8mo | $62,500 | $38 | 53 |
| 39 S Center St | 0.46mi | 4/2.0 (+1) | 1,650 (-8%) | 7mo | $150,000 | $91 | 50 |
| 336 W Spring St | 0.57mi | 4/2.0 (+1) | 1,886 (+5%) | 7mo | $149,500 | $79 | 50 |
| 35 S Center St | 0.46mi | 4/1.5 (+1) | 1,650 (-8%) | 10mo | $150,000 | $91 | 49 |
| 29 S Center St | 0.46mi | 4/2.0 (+1) | 1,650 (-8%) | 13mo | $145,000 | $88 | 45 |
| 220 W High St | 0.64mi | 3/2.5 | 1,593 (-11%) | 3mo | $230,000 | $144 | 43 |
Match score weights: distance 35% · size 25% · config 20% · recency 20%. Top-matched comps best support the ARV.
Projected returns pro-forma
-3.0% appreciation · 3.0% rent growth · sell at horizon
- IRR
- -12.6%
- Equity multiple
- 0.55×
- Total profit
- $-17,165
- Equity at exit
- $20,129
- IRR
- -3.5%
- Equity multiple
- 0.76×
- Total profit
- $-8,888
- Equity at exit
- $11,672
Cash invested: $37,800 (down + closing). Projections, not guarantees.
Landlord ↔ Tenant lean methodology
- Overall (STATE)
- 62 Landlord-Friendly
- State Pennsylvania
- 62 Landlord-Friendly · EVEN
- County
- — inherits STATE
- City
- — inherits STATE
ZIP-level market 17931
- Home prices YoY
- -22.6%
- Active inventory
- 34
- Price-to-rent
- 9.1×
Monthly cashflow live
- Estimated rent
- $1,231 medium interval (Pro) →
- Mortgage (P&I)
- −$708
- Tax from tax record
- −$134 /mo · $1,613/yr
- Insurance
- −$56
- HOA
- −$0
- Vacancy / Maint / Mgmt
- −$259
- Net cashflow
- $74
Break-even live
Sensitivity live
| Price | -10% $150 | -5% $112 | +0% $74 | +5% $36 | +10% $-2 |
|---|---|---|---|---|---|
| Rent | -10% $-23 | -5% $25 | +0% $74 | +5% $123 | +10% $171 |
| Rate | -1.0pp $142 | -0.5pp $108 | base $74 | +0.5pp $39 | +1.0pp $3 |
UW: 25.0% down · 7.5% · 30yr · 1.5% tax · 5.0% vac · 8.0% maint · 8.0% mgmt
Financing live
Cash to close
- Down payment
- $33,750
- Closing costs
- $4,050
- Reserves months
- —
- Total cash needed
- —
Loan-product check · same deal, 3 products live
Conventional
25% down · 7.5% · 30yr
- Down + closing
- —
- Monthly P&I
- —
- Monthly cashflow
- —
- DSCR
- —
- Eligible?
- —
Personal DTI + credit; lowest rate.
DSCR
20% down · 8.5% · 30yr
- Down + closing
- —
- Monthly P&I
- —
- Monthly cashflow
- —
- DSCR
- —
- Eligible?
- —
No personal income docs; deal must DSCR.
Hard money
10% down · 12.0% · 12mo
- Down + closing
- —
- Monthly P&I
- —
- Monthly cashflow
- —
- DSCR
- —
- Eligible?
- —
Short-term bridge; refi at stabilization.
Listing history 18 events
-
2026-06-21days on market $135,000 Active 25 DOM
-
2026-06-21days on market $135,000 Active 24 DOM
-
2026-06-18days on market $135,000 Active 22 DOM
-
2026-06-17days on market $135,000 Active 21 DOM
-
2026-06-16days on market $135,000 Active 20 DOM
-
2026-06-15days on market $135,000 Active 19 DOM
-
2026-06-13days on market $135,000 Active 17 DOM
-
2026-06-12days on market $135,000 Active 16 DOM
-
2026-06-09days on market $135,000 Active 13 DOM
-
2026-06-08days on market $135,000 Active 12 DOM
-
2026-06-08days on market $135,000 Active 11 DOM
-
2026-06-07days on market $135,000 Active 10 DOM
-
2026-06-04days on market $135,000 Active 7 DOM
-
2026-06-02status $135,000 Active 6 DOM
-
2026-05-22status Pending
-
2026-05-22price $135,000
-
2026-05-16$129,900 Active
-
1992-11-24soldstatus $60,000
ⓘ Source: listings_history table (triggers on properties + properties_extension) + one-shot
backfill from property_details.listing_events for pre-trigger history.
Tax reassessment forecast PA · Partial reset (capped growth)
- Current annual tax
- $1,613 · $134/mo
- Projected year-2 tax
- $1,873 · $156/mo
- Expected delta
- +$260/yr (+$22/mo · 16.1%)
ⓘ Screening estimate from a state-policy table — verify with the county assessor before closing.
Climate risk First Street
- Flood 1/10 Low FEMA zone X (unshaded) · 0% chance over 30 yrs
- Wildfire 3/10 Moderate
- Heat 3/10 Moderate 7 d/yr ≥92°F today · 16 d/yr by 30 yrs out
- Wind 4/10 Moderate 8% chance of damaging wind over 30 yrs
- Air quality 2/10 Low 1 unhealthy d/yr today · 1 by 30 yrs out
Nearby sold comps map
Loading sold comps map…
Walkable amenities ~0.75 mi
Loading nearby amenities…
Taxation est. · year 1
- Rental income
- $14,774
- − Mortgage interest
- −$7,562
- − Property taxes
- −$1,613
- − Insurance
- −$675
- − Repairs & maintenance
- −$1,182
- − Management
- −$1,182
- − Depreciation
- −$3,927
- Taxable loss
- −$1,367
- Est. tax savings @ 24.0%
- +$328
- After-tax cash flow
- $1,216/yr
For passive investors: Depreciation is non-cash, so a rental often shows a tax loss while cash-flowing — sheltering income. Rental losses are passive: they offset passive income freely, and up to $25,000/yr can offset ordinary (W-2) income if you actively participate and your MAGI is under $100k (phasing out to $0 by $150k); unused losses carry forward. On sale, claimed depreciation is recaptured at up to 25%, and gains may owe capital-gains tax (a 1031 exchange can defer both). Figures are a year-1 estimate at your 24.0% rate — not tax advice; consult a CPA.
Schools (NCES district)
- District
- Shenandoah Valley SD
- NCES district ID
- 4221490
- Math proficiency
- 20% ▼ -8.00%
- Reading proficiency
- 38% ▼ -6.00%
- Median HH income
- $31,968
- Composite
- 23.58/100
- National rank
- #7851
- State rank
- #454 of 539 in PA
Livability — West Mahanoy
No livability data for this city. (Only ~50 U.S. cities are tracked.)
Census & demographics
- Census place
- Altamont, PA
- Population (ZIP)
- 8,726
Population outlook (Schuylkill County) Hauer SSP2
- Today (2025)
- 137,447 people
- By 2030
- 133,121 · -3.1%
- By 2040
- 124,172 · -9.7%
- By 2050
- 115,611 · -15.9%
- By 2075
- 100,796 · -26.7%
- By 2100
- 86,667 · -36.9%
Race, ethnicity, and origin ACS 2023
- Neighborhood character
- Predominantly White (66%)
- Race & ethnicity
- White 66% Black 23% Hispanic / Latino 9% Two or more races 5%
- Hispanic origin (detail)
- Puerto Rican 4% Dominican 2%
- Common ancestry
- Romanian 10% Iranian 3% Subsaharan African 3%
- Foreign-born
- 1%
- Languages at home
- 91% English-only · Spanish 6% Russian/Polish/Slavic 1% Korean 1%
Political lean MEDSL · Schuylkill
- 2024 margin
- Solid R (+42.1) · D 28.5% · R 70.6%
- 2008→2024 swing
- -33.4pp toward R · 2008: -8.7pp · 2024: -42.1pp
- All cycles
- 2024: R+42.1 2020: R+39.9 2016: R+43.4 2012: R+13.4 2008: R+8.7
Not yet ingested
- Civics
- —
Market trends
- HPI YoY
- ▼ -48.47%
- Current HPI
- 165.7692
- Rent YoY
- —
- Metro
- —
- State GDP YoY
- ▲ 1.68%
- F500 in state
- 34
Industry mix (Fortune 500 HQ in PA)
| Industry | F500 HQs | Revenue |
|---|---|---|
| Healthcare | 2 | $309B |
|
||
| Insurance | 2 | $27B |
|
||
| Telecommunications / Media | 1 | $124B |
|
||
| Industrial Distribution | 1 | $22B |
|
||
| Financial Services | 1 | $20B |
|
||
| Chemicals / Materials | 1 | $18B |
|
||
Price history
+125.0% since first listed4 events — show timeline
- 2026-05-22 Pending — BRIGHT MLS
- 2026-05-22 Price Changed $135,000 BRIGHT MLS
- 2026-05-16 Listed $129,900 BRIGHT MLS
- 1992-11-24 Sold (Public Records) $60,000 Public Records
Property tax history
+1.1%/yrLatest (2025): $1,613 · +4.1% YoY. Source: county tax records.
Cash-flow waterfall
monthlySold comps — $/sqft
last 12 mo · ≤1 miLoading sold comps…