 🏗️ New Construction
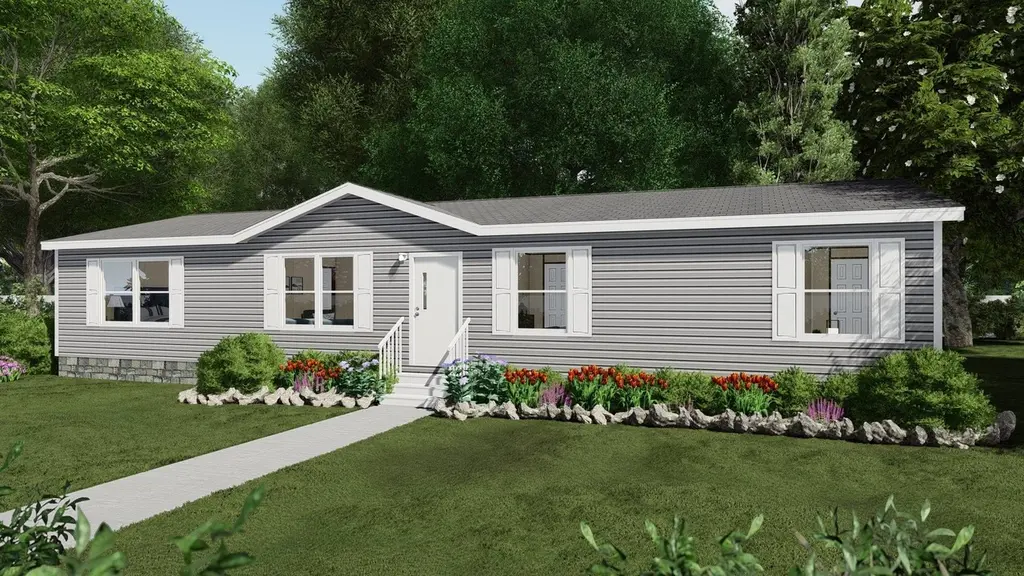
Oak Plan · Fort Worth, TX
Flood risk No data
- FEMA flood zone
- —
- Chance of flooding over 30 yrs
- —
- Est. flood insurance / yr
- —
Fire risk No data
- Est. fire insurance / yr
- —
Heat risk No data
- Hot days now (above threshold)
- —
- Hot days in 30 yrs
- —
Wind risk No data
- Chance of severe wind over 30 yrs
- —
Air-quality risk No data
- Unhealthy air days now
- —
- Unhealthy air days in 30 yrs
- —
Risk factors via First Street. Map © Google.
Why this score? — see what drove the B- grade
The composite is a weighted blend of 9 inputs, each scored 0–100. Each bar is that input's sub-score; the figure is the points it added to the 100-point composite (weight × sub-score).
- Cash flow +30.0/30.0
- 1% rule +10.0/10.0
- DSCR +10.0/10.0
- ARV discount +7.5/15.0
- Livability +4.0/5.0
- Condition / age +4.0/5.0
- Rent growth +2.1/5.0
- Schools +2.0/10.0
- Appreciation +0.0/10.0
$93,999
🖨 Deal sheet 📄 Offer letter ✓ Due diligence
Listing remarks
This is an amazing entry level home at an amazing price! This spacious 4 bedroom has high ceilings, big bedrooms, an island kitchen with great room open to the large living room. As with all our homes, this price includes the delivery, set-up, heating and air conditioning, warranty and much more! Reach out 682-549-3239 or come in and tour this home!! WE are here every day except Sunday!! www. a1fortworth.com
Key facts
- Listed 54 days
Property features AI
Finance
- Financial info: List price $93,999
Exterior
- Utilities: Central air
- Home design: Plan home (Oak)
- Construction: Built as part of a new construction plan
- Exterior features: Composition roof
Interior
- Bedrooms: 4 bedrooms
- Bathrooms: 2 bathrooms
- Heating & cooling: Central air conditioning
- Interior features: Central air conditioning
Neighborhood map
What this means for you Summary
Snapshot
- This is a 4-bed/2.0-bath manufactured listed at $94k. Condition is rated good.
Deal economics
- At list price, monthly cash flow is $990 ($12k/yr) — positive.
- The deal already cash-flows at list — no discount required.
- Meets the 1% rule at list price ($2k rent vs $94k).
- Recommended offer: $91k (3.0% below list) — sets the bar for market timing.
- Cap rate 24.6% vs local median 3.9% in Fort Worth — top-decile yield for the area; either an underpriced asset or a hidden risk that comps aren't pricing in. Stress-test before assuming the spread holds.
Location & tenants
- Location reads 80/100 on livability (#49 in TX, #1,954 nationally) — a professional / high-income tenant draw. Strengths: amenities A+, cost of living A+, housing A+; Watch: schools D+, crime F.
- Fort Worth ISD (urban): math 18% / reading 28% proficiency, ranked #742 of 826 in TX (top 90%) — low school quality limits family demand, transient renter base, plan for 1-2y turnover; 73% free/reduced lunch — lower-income household profile, screen leases tightly.
- Market conditions: Rents soft (-1.6%/yr); 186 active listings in the ZIP; 22 comparable units currently listed for rent nearby; rentals at typical pace (median 24d on market — plan ~3-4 weeks tenant-placement turnaround); 18,938 units permitted in Tarrant County in 2024 (8,336 in 5+ unit buildings).
- This rent runs 43% of the median local income ($51k/yr) — at the standard rent-burdened threshold; future hikes will face affordability resistance.
Forward outlook
- Local home prices are declining (-3.0%/yr); year-one equity from $449 of loan paydown is wiped out by about $2k of value loss. Plan a longer hold.
- Tarrant County population projected at +41% by 2050 — long-run rental-demand tailwind backs the buy-and-hold thesis.
- At projected returns (-3.0% appreciation + 0.0% rent growth), your $18k cash investment doubles in ~2 years — after that, you're playing with house money.
Negotiation context
- It's been on market 54 days — a 3% lower offer ($91k) is reasonable based on typical stale-listing flexibility.
Questions for the listing agent
- It's been on market 54 days. Have you received any prior offers? Is the seller open to a 3% concession, seller financing, or rate buy-down credit?
- Is there a deadline driving the sale (1031 exchange, divorce, estate, relocation)? That informs how much negotiation room exists.
- Schools are D-rated, which usually means shorter tenancies and higher turnover. Who's the typical renter profile here, and what's been the actual vacancy rate?
- Crime grade is F in this area — have there been break-ins, vandalism, or insurance claims at this property in the last 3 years? What carrier currently insures it and at what premium?
- What's the average days-on-market for RENTAL listings here right now (not sales)? A rising rental-DOM trend means longer vacancies and softer asking-rent achievability than the comps imply.
- What's the recent tenant-quality profile in this submarket — average credit score on applications, eviction rate, late-payment / NSF rate, and stable-employment percentage? A property-management company in the area should have these aggregated.
- How much new for-sale + rental construction is in the pipeline within 1–3 miles? Heavy new supply typically softens prices + rents 12–24 months out; constrained supply supports both.
Investment metrics
- 1% rule
- 2.80% ✓
- Cap rate
- 24.57%
- Cash-on-cash
- 65.26%
- DSCR
- 3.90
- GRM
- 3.0
CMA / ARV
- ARV (median comp)
- $65,000
- List price
- $93,999
- Delta
- 44.61%
- Verdict
- OVERPRICED
- Comps
- 1 within 2.0 mi
Projected returns pro-forma
-3.0% appreciation · 0.0% rent growth · sell at horizon
- IRR
- 61.0%
- Equity multiple
- 3.59×
- Total profit
- $47,196
- Equity at exit
- $9,692
- IRR
- 64.6%
- Equity multiple
- 6.59×
- Total profit
- $101,752
- Equity at exit
- $5,620
Cash invested: $18,200 (down + closing). Projections, not guarantees.
Landlord ↔ Tenant lean methodology
- Overall (STATE)
- 87 Strongly Landlord-Friendly
- State Texas
- 87 Strongly Landlord-Friendly · R+5
- County
- — inherits STATE
- City
- — inherits STATE
ZIP-level market 76119
- Home prices YoY
- -6.4%
- Rents YoY
- -1.6%
- Active inventory
- 186
- Price-to-rent
- 4.3×
Monthly cashflow live
- Estimated rent
- $1,821 high interval (Pro) →
- Mortgage (P&I)
- −$341
- Tax est. 1.5%
- −$81 /mo · $975/yr
- Insurance
- −$27
- HOA
- −$0
- Vacancy / Maint / Mgmt
- −$383
- Net cashflow
- $990
Break-even live
UW: 25.0% down · 7.5% · 30yr · 1.5% tax · 5.0% vac · 8.0% maint · 8.0% mgmt
Financing live
Cash to close
- Down payment
- $16,250
- Closing costs
- $1,950
- Reserves months
- —
- Total cash needed
- —
Loan-product check · same deal, 3 products live
Conventional
25% down · 7.5% · 30yr
- Down + closing
- —
- Monthly P&I
- —
- Monthly cashflow
- —
- DSCR
- —
- Eligible?
- —
Personal DTI + credit; lowest rate.
DSCR
20% down · 8.5% · 30yr
- Down + closing
- —
- Monthly P&I
- —
- Monthly cashflow
- —
- DSCR
- —
- Eligible?
- —
No personal income docs; deal must DSCR.
Hard money
10% down · 12.0% · 12mo
- Down + closing
- —
- Monthly P&I
- —
- Monthly cashflow
- —
- DSCR
- —
- Eligible?
- —
Short-term bridge; refi at stabilization.
Rent comps 22 comps
| Address | Beds | Baths | Sqft | Rent | $/sqft | DOM | Units | Dist |
|---|---|---|---|---|---|---|---|---|
| 3865 Stalcup Rd Fort Worth, TX | 3.0 | 2.0 | 1090 | $1,814 | $1.66 | 6d | 1 | 0.21mi |
| 5818 Grayson St Unit 5818 Fort Worth, TX | 3.0 | 2.5 | 1400 | $2,000 | $1.43 | 18d | 1 | 0.27mi |
| 5820 Grayson St Fort Worth, TX | 3.0 | 2.5 | 1417 | $1,895 | $1.34 | 43d | 1 | 0.27mi |
| 5913 Montague St Fort Worth, TX | 3.0 | 2.0 | 1090 | $1,549 | $1.42 | 14d | 1 | 0.35mi |
| 5908 Oakdale Dr Fort Worth, TX | 3.0 | 2.0 | 1090 | $1,475 | $1.35 | 6d | 1 | 0.37mi |
| 5712 Whittlesey Rd Fort Worth, TX | 4.0 | 2.0 | 1610 | $2,000 | $1.24 | 44d | 1 | 0.39mi |
| 3700 Radford Rd Fort Worth, TX | 3.0 | 2.0 | 1124 | $1,650 | $1.47 | 12d | 1 | 0.50mi |
| 3700 Radford Rd Fort Worth, TX | 3.0 | 2.0 | 1124 | $1,650 | $1.47 | 24d | 1 | 0.50mi |
| 5055 Virgil St Fort Worth, TX | 3.0 | 2.0 | 1089 | $1,650 | $1.52 | 24d | 1 | 0.77mi |
| 3201 Mount Horum Way Fort Worth, TX | 3.0 | 2.0 | 1045 | $1,699 | $1.63 | 6d | 1 | 0.79mi |
| 5336 Cottey St Fort Worth, TX | 3.0 | 2.0 | 1045 | $1,699 | $1.63 | 43d | 1 | 0.88mi |
| 5328 Carol Ave Fort Worth, TX | 4.0 | 2.0 | 1230 | $2,100 | $1.71 | 43d | 1 | 1.02mi |
| 4217 Wilhelm St Fort Worth, TX | 3.0 | 2.0 | 1380 | $1,650 | $1.20 | 43d | 1 | 1.13mi |
| 5702 Shoreline Cir S Fort Worth, TX | 3.0 | 2.0 | 1200 | $1,450 | $1.21 | 43d | 1 | 1.18mi |
| 5636 Lester Granger Dr Fort Worth, TX | 3.0 | 2.0 | 1300 | $1,495 | $1.15 | 24d | 1 | 1.18mi |
| 4508 Wiman Dr Fort Worth, TX | 3.0 | 2.0 | 1045 | $1,580 | $1.51 | 6d | 1 | 1.34mi |
| 4336 Jana Dr Fort Worth, TX | 3.0 | 1.0 | 1070 | $1,650 | $1.54 | 4d | 1 | 1.35mi |
| 2312 Cass St Fort Worth, TX | 4.0 | 2.5 | 1600 | $1,850 | $1.16 | 14d | 1 | 1.38mi |
| 2128 R. W. Bivens Ln Fort Worth, TX | 3.0 | 2.0 | 1045 | $1,615 | $1.55 | 14d | 1 | 1.40mi |
| 5664 Shore Point Trl Fort Worth, TX | 3.0 | 2.5 | 1742 | $2,150 | $1.23 | 43d | 1 | 1.41mi |
| 5532 Shore Point Trl Fort Worth, TX | 3.0 | 2.5 | 1446 | $1,950 | $1.35 | 43d | 1 | 1.42mi |
| 5641 Willamette Dr Fort Worth, TX | 3.0 | 2.5 | 1631 | $2,150 | $1.32 | 16d | 1 | 1.48mi |
Listing history 14 events
-
2026-06-18days on market $93,999 Active 54 DOM
-
2026-06-17days on market $93,999 Active 53 DOM
-
2026-06-16days on market $93,999 Active 52 DOM
-
2026-06-15days on market $93,999 Active 51 DOM
-
2026-06-13days on market $93,999 Active 49 DOM
-
2026-06-09days on market $93,999 Active 45 DOM
-
2026-06-08days on market $93,999 Active 44 DOM
-
2026-06-07days on market $93,999 Active 43 DOM
-
2026-06-04days on market $93,999 Active 40 DOM
-
2026-06-03days on market $93,999 Active 39 DOM
-
2026-06-02days on market $93,999 Active 38 DOM
-
2026-06-02days on market $93,999 Active 37 DOM
-
2026-05-31days on market $93,999 Active 36 DOM
-
2026-04-25$93,999 Active 411-char remark
ⓘ Source: listings_history table (triggers on properties + properties_extension) + one-shot
backfill from property_details.listing_events for pre-trigger history.
Nearby sold comps map
Loading sold comps map…
Walkable amenities ~0.75 mi
Loading nearby amenities…
Taxation est. · year 1
- Rental income
- $21,858
- − Mortgage interest
- −$3,641
- − Property taxes
- −$975
- − Insurance
- −$325
- − Repairs & maintenance
- −$1,749
- − Management
- −$1,749
- − Depreciation
- −$1,891
- Taxable income
- $11,529
- Est. tax owed @ 24.0%
- −$2,767
- After-tax cash flow
- $9,110/yr
For passive investors: Depreciation is non-cash, so a rental often shows a tax loss while cash-flowing — sheltering income. Rental losses are passive: they offset passive income freely, and up to $25,000/yr can offset ordinary (W-2) income if you actively participate and your MAGI is under $100k (phasing out to $0 by $150k); unused losses carry forward. On sale, claimed depreciation is recaptured at up to 25%, and gains may owe capital-gains tax (a 1031 exchange can defer both). Figures are a year-1 estimate at your 24.0% rate — not tax advice; consult a CPA.
Condition & rehab AI · 11 photos
This spacious 4-bedroom home is in excellent condition with modern finishes and a well-maintained exterior. It's ready to move in and would benefit from some minor updates to further enhance its value.
Value-add opportunities
- Both Painting the interior walls — Fresh paint can make a home look more inviting and modern
- Both Updating the flooring — Hardwood floors are durable and add value
- Both Adding smart home features — Smart home features can increase both resale and rental value
Renovation cost estimate screening
Value-add ROI direction
- Both Painting the interior walls — Fresh paint can make a home look more inviting and modern ↑
- Both Updating the flooring — Hardwood floors are durable and add value ↑
- Both Adding smart home features — Smart home features can increase both resale and rental value ↑
ⓘ Cost ranges are severity-bucket heuristics (US national rule-of-thumb). Get contractor quotes + a written scope before underwriting a rehab budget.
Schools (NCES district)
- District
- Fort Worth ISD
- NCES district ID
- 4819700
- Math proficiency
- 18% ▼ -16.00%
- Reading proficiency
- 28% ▼ -6.00%
- Median HH income
- $42,109
- Composite
- 19.61/100
- National rank
- #8753
- State rank
- #742 of 826 in TX
Livability — Fort Worth
- Score
- 80/100
- State rank
- #49
- US rank
- #1954
Category grades
Schools grade is shown separately in the Schools card above.
Census & demographics
- Census place
- Fort Worth, TX
- County
- Tarrant County · 2,033,669 people
- City population
- 911,619
- Metro
- Dallas-Fort Worth-Arlington, TX
- Population (ZIP)
- 52,974
- Household income
- $51,267
- Rent vs Own
- Severe rent burden
- 2221.0
Population outlook (Tarrant County) Hauer SSP2
- Today (2025)
- 2,380,417 people
- By 2030
- 2,578,900 · +8.3%
- By 2040
- 2,974,995 · +25.0%
- By 2050
- 3,350,489 · +40.8%
- By 2075
- 4,216,909 · +77.2%
- By 2100
- 4,741,527 · +99.2%
Race, ethnicity, and origin ACS 2023
- Neighborhood character
- Diverse neighborhood (Simpson 0.60)
- Race & ethnicity
- Hispanic / Latino 51% Black 36% Two or more races 26% White 8% Asian 3%
- Hispanic origin (detail)
- Mexican 44%
- Foreign-born
- 25% · Canada, Philippines
- Languages at home
- 54% English-only · Spanish 42% Other Indo-European 2% Other Asian/Pacific 1%
Political lean MEDSL · Tarrant
- 2024 margin
- Lean R (+5.1) · D 46.7% · R 51.9% · Other 1.4%
- 2008→2024 swing
- +6.6pp toward D · 2008: -11.7pp · 2024: -5.1pp
- All cycles
- 2024: R+5.1 2020: D+0.2 2016: R+8.7 2012: R+15.7 2008: R+11.7
Not yet ingested
- Civics
- —
Market trends
- HPI YoY
- ▼ -23.04%
- Current HPI
- 336.7941
- Rent YoY
- ▼ -1.61%
- Metro
- Dallas-Fort Worth-Arlington, TX
- State GDP YoY
- ▲ 3.95%
- F500 in state
- 110
Industry mix (Fortune 500 HQ in TX)
| Industry | F500 HQs | Revenue |
|---|---|---|
| Energy | 16 | $1,198B |
|
||
| Technology | 5 | $198B |
|
||
| Engineering / Construction | 4 | $72B |
|
||
| Energy Services | 3 | $60B |
|
||
| Utilities | 3 | $41B |
|
||
| Healthcare | 2 | $330B |
|
||
Cash-flow waterfall
monthlySold comps — $/sqft
last 12 mo · ≤1 miLoading sold comps…