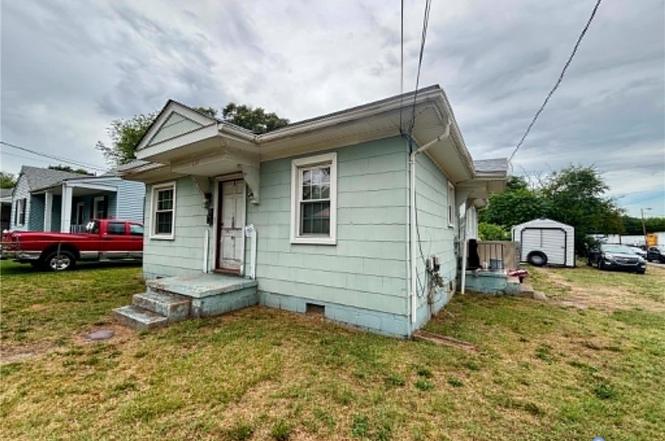
610 Holly Spring Ave · Richmond, VA
Flood risk 6/10 · Moderate
- FEMA flood zone
- X (unshaded)
- Chance of flooding over 30 yrs
- 0.74%
- Est. flood insurance / yr
- $507 – $1,088
Fire risk 1/10 · Minimal
- Est. fire insurance / yr
- $666 – $1,236
Heat risk 8/10 · Major
- Hot days now (above 105°F)
- 7 days/yr
- Hot days in 30 yrs
- 16 days/yr
Wind risk 6/10 · Moderate
- Chance of severe wind over 30 yrs
- 27.0%
Air-quality risk 2/10 · Minimal
- Unhealthy air days now
- 1 days/yr
- Unhealthy air days in 30 yrs
- 1 days/yr
Risk factors via First Street. Map © Google.
Why this score? — see what drove the B+ grade
The composite is a weighted blend of 9 inputs, each scored 0–100. Each bar is that input's sub-score; the figure is the points it added to the 100-point composite (weight × sub-score).
- Cash flow +29.3/30.0
- ARV discount +15.0/15.0
- DSCR +10.0/10.0
- 1% rule +7.5/10.0
- Livability +4.2/5.0
- Rent growth +3.6/5.0
- Schools +3.3/10.0
- Condition / age +2.5/5.0
- Appreciation +0.0/10.0
$139,000
🖨 Deal sheet 📄 Offer letter ✓ Due diligence
Listing remarks
Investment property for sale - great potential! The property has 1,040 square feet including 3 bedrooms and 1 full bath. This property is in a very up-and-coming area of Richmond right now - flip it and resell it, fix it up and live in it, renovate it and rent it out - so many options for your real estate investment portfolio! Property sold in AS-IS condition and will not be eligible for financing, this is a cash sale.
Key facts
- 7,505 sq ft lot
- Built 1951
- Listed 4 days
Property features AI
Exterior
- Utilities: Public water; Public sewer
- Home design: Single-story home; Above-grade finished area approximately 1,040; Asphalt shingle roof
- Construction: Frame construction with asbestos siding; Built (actual year recorded)
- Exterior features: R-5 zoning
Interior
- Bedrooms: 6 total rooms (includes bedrooms and other living spaces); Full bathroom on the first floor with tub and shower
- Bathrooms: 1 full bathroom
- Heating & cooling: Forced air heating; Oil-fired heating
- Interior features: Resale condition
Neighborhood map
What this means for you Summary
Snapshot
- This is a 3-bed/1.0-bath single-family listed at $139k.
Deal economics
- At list price, monthly cash flow is $489 ($6k/yr) — positive.
- The deal already cash-flows at list — no discount required.
- Meets the 1% rule at list price ($2k rent vs $139k).
- Cap rate 10.5% vs local median 3.3% in Richmond — top-decile yield for the area; either an underpriced asset or a hidden risk that comps aren't pricing in. Stress-test before assuming the spread holds.
Location & tenants
- Location reads 84/100 on livability (#33 in VA, #793 nationally) — a professional / high-income tenant draw. Strengths: amenities A+, commute A+, health & safety A+; Watch: crime D-.
- Richmond City Public School District (urban): math 32% / reading 47% proficiency, ranked #123 of 131 in VA (top 94%) — families likely to look elsewhere, expect single-tenant / working-renter base with shorter leases; 74% free/reduced lunch — lower-income household profile, screen leases tightly.
- Market conditions: Rents rising fast (+4.5%/yr); 173 active listings in the ZIP; 35 comparable units currently listed for rent nearby; rentals at typical pace (median 24d on market — plan ~3-4 weeks tenant-placement turnaround); 2,540 units permitted in Richmond city in 2024 (2,077 in 5+ unit buildings).
- This rent runs 41% of the median local income ($50k/yr) — at the standard rent-burdened threshold; future hikes will face affordability resistance.
Forward outlook
- Local home prices are declining (-3.0%/yr); year-one equity from $961 of loan paydown is wiped out by about $4k of value loss. Plan a longer hold.
- Richmond County population projected at +40% by 2050 — long-run rental-demand tailwind backs the buy-and-hold thesis.
- At projected returns (-3.0% appreciation + 4.5% rent growth), your $39k cash investment doubles in ~8 years — after that, you're playing with house money.
Negotiation context
- Only 4 days on market — expect competitive offers; lowballing is unlikely to land.
- Current owner paid $36k; list at $139k implies a 285% gain — meaningful room to come down on a strong offer.
Risks & watch-outs
- Watch-outs: built in 1951 — expect roof / HVAC / electrical / plumbing capex.
- Climate carrying-cost: major flood risk; major wind risk, 27% chance of damaging wind over 30y; extreme-heat days projected 7→16/yr by 2055 (HVAC capex compounding) — expect insurance premiums to compound above CPI over the hold.
Questions for the listing agent
- Built in 1951 — when were the roof, HVAC, electrical panel, plumbing, and water heater last replaced?
- Is there a deadline driving the sale (1031 exchange, divorce, estate, relocation)? That informs how much negotiation room exists.
- Schools are A-rated — typically a magnet for longer-tenancy family renters. What's the average tenant stay here, and is there a school-zone premium baked into asking?
- Crime grade is D in this area — have there been break-ins, vandalism, or insurance claims at this property in the last 3 years? What carrier currently insures it and at what premium?
- What's the average days-on-market for RENTAL listings here right now (not sales)? A rising rental-DOM trend means longer vacancies and softer asking-rent achievability than the comps imply.
- What's the recent tenant-quality profile in this submarket — average credit score on applications, eviction rate, late-payment / NSF rate, and stable-employment percentage? A property-management company in the area should have these aggregated.
- How much new for-sale + rental construction is in the pipeline within 1–3 miles? Heavy new supply typically softens prices + rents 12–24 months out; constrained supply supports both.
Investment metrics
- 1% rule
- 1.25% ✓
- Cap rate
- 10.52%
- Cash-on-cash
- 15.08%
- DSCR
- 1.67
- GRM
- 6.7
CMA / ARV
- ARV (on-the-fly)
- $246,480
- Comps found
- 12
Show comp detail 12 sales within ~0.75 mi
| Address | Dist | Beds/Ba | Sqft | Sold | Price | $/sf | Match |
|---|---|---|---|---|---|---|---|
| 3010 Lawson St | 0.40mi | 3/2.0 | 1,040 (0%) | 3mo | $270,000 | $260 | 75 |
| 3061 Decatur St | 0.28mi | 2/1.5 (-1) | 1,006 (-3%) | 1mo | $225,000 | $224 | 73 |
| 3706 Mcrand St | 0.53mi | 3/1.0 | 1,048 (+1%) | 1mo | $265,000 | $253 | 73 |
| 3205 Stockton St | 0.16mi | 2/1.0 (-1) | 950 (-9%) | 2mo | $224,900 | $237 | 71 |
| 3110 Stockton St | 0.13mi | 2/1.0 (-1) | 908 (-13%) | 2mo | $262,000 | $289 | 66 |
| 2857 Decatur St | 0.42mi | 3/1.0 | 1,148 (+10%) | 1mo | $250,000 | $218 | 62 |
| 204 W 32nd St | 0.71mi | 2/1.0 (-1) | 1,038 (-0%) | 1mo | $205,000 | $197 | 61 |
| 212 W Blake Ln | 0.70mi | 2/1.0 (-1) | 1,039 (-0%) | 2mo | $340,000 | $327 | 60 |
| 1 E 35th St | 0.67mi | 4/1.5 (+1) | 1,032 (-1%) | 2mo | $294,500 | $285 | 59 |
| 3414 Hull St | 0.33mi | 2/1.0 (-1) | 920 (-12%) | 2mo | $173,980 | $189 | 59 |
| 3116 Maurice Ave | 0.74mi | 3/1.0 | 916 (-12%) | 1mo | $165,000 | $180 | 45 |
| 1411 Hopkins Rd | 0.47mi | 4/2.0 (+1) | 1,196 (+15%) | 1mo | $210,000 | $176 | 43 |
Match score weights: distance 35% · size 25% · config 20% · recency 20%. Top-matched comps best support the ARV.
Projected returns pro-forma
-3.0% appreciation · 4.55% rent growth · sell at horizon
- IRR
- 7.3%
- Equity multiple
- 1.29×
- Total profit
- $11,353
- Equity at exit
- $20,725
- IRR
- 17.9%
- Equity multiple
- 2.58×
- Total profit
- $61,547
- Equity at exit
- $12,018
Cash invested: $38,920 (down + closing). Projections, not guarantees.
Landlord ↔ Tenant lean methodology
- Overall (STATE)
- 55 Moderately Landlord-Leaning
- State Virginia
- 55 Moderately Landlord-Leaning · D+2
- County
- — inherits STATE
- City
- — inherits STATE
ZIP-level market 23224
- Rents YoY
- 4.5%
- Active inventory
- 173
- Price-to-rent
- 6.7×
Monthly cashflow live
- Estimated rent
- $1,735 high interval (Pro) →
- Mortgage (P&I)
- −$729
- Tax from tax record
- −$95 /mo · $1,140/yr
- Insurance
- −$58
- HOA
- −$0
- Vacancy / Maint / Mgmt
- −$364
- Net cashflow
- $489
Break-even live
UW: 25.0% down · 7.5% · 30yr · 1.5% tax · 5.0% vac · 8.0% maint · 8.0% mgmt
Financing live
Cash to close
- Down payment
- $34,750
- Closing costs
- $4,170
- Reserves months
- —
- Total cash needed
- —
Loan-product check · same deal, 3 products live
Conventional
25% down · 7.5% · 30yr
- Down + closing
- —
- Monthly P&I
- —
- Monthly cashflow
- —
- DSCR
- —
- Eligible?
- —
Personal DTI + credit; lowest rate.
DSCR
20% down · 8.5% · 30yr
- Down + closing
- —
- Monthly P&I
- —
- Monthly cashflow
- —
- DSCR
- —
- Eligible?
- —
No personal income docs; deal must DSCR.
Hard money
10% down · 12.0% · 12mo
- Down + closing
- —
- Monthly P&I
- —
- Monthly cashflow
- —
- DSCR
- —
- Eligible?
- —
Short-term bridge; refi at stabilization.
Rent comps 35 comps
| Address | Beds | Baths | Sqft | Rent | $/sqft | DOM | Units | Dist |
|---|---|---|---|---|---|---|---|---|
| 3154 Stockton St Richmond, VA | 3.0 | 1.0 | 1169 | $1,600 | $1.37 | 43d | 1 | 0.14mi |
| 3204 Midlothian Tpke Apt O Richmond, VA | 2.0 | 1.0 | 715 | $1,150 | $1.61 | 23d | 1 | 0.58mi |
| 3202 Midlothian Tpke Richmond, VA | 2.0 | 1.0 | 715 | $1,150 | $1.61 | 3d | 6 | 0.59mi |
| 3300 Midlothian Tpke Richmond, VA | 2.0 | 1.0 | 1116 | $1,800 | $1.61 | 4d | 1 | 0.62mi |
| 10 W 27th St Unit P P Richmond, VA | 2.0 | 1.0 | 975 | $1,300 | $1.33 | 43d | 1 | 0.70mi |
| 1100 Richmond Hwy Richmond, VA | 1.0–3.0 | 1.0–2.0 | 1062 | $2,345 | $2.21 | 1d | 16 | 0.76mi |
| 100 Mardick Rd Richmond, VA | 4.0 | 2.0 | 1254 | $2,250 | $1.79 | 23d | 1 | 0.84mi |
| 800 Richmond Hwy Richmond, VA | 1.0–2.0 | 1.0–2.0 | 778 | $2,044 | $2.63 | 43d | 1 | 0.84mi |
| 2522 Porter St Richmond, VA | 3.0 | 2.5 | 1390 | $1,800 | $1.29 | 43d | 1 | 0.91mi |
| 205 W Roanoke St Richmond, VA | 1.0–2.0 | 1.0 | 685 | $1,330 | $1.94 | 11d | 1 | 0.93mi |
| 2010 Maury St Richmond, VA | 2.0 | 1.0 | 883 | $1,675 | $1.90 | 4d | 1 | 1.02mi |
| 2708 Semmes Ave Unit A Richmond, VA | 2.0 | 1.0 | 1050 | $1,275 | $1.21 | 43d | 1 | 1.02mi |
| 1410 Enfield Ave Unit 1410 Richmond, VA | 3.0 | 1.0 | 912 | $1,500 | $1.64 | 43d | 1 | 1.02mi |
| 1913 Dinwiddie Ave Unit 1546196P Richmond, VA | 2.0 | 1.0 | 1044 | $2,519 | $2.41 | 14d | 1 | 1.08mi |
| 2200 Ingram Ave Richmond, VA | 2.0 | 1.0–2.0 | 711 | $1,668 | $2.35 | 4d | 1 | 1.08mi |
| 1808 Edwards Ave Richmond, VA | 3.0 | 2.0 | 1040 | $1,750 | $1.68 | 23d | 1 | 1.13mi |
| 2208 Keswick Ave Richmond, VA | 3.0 | 1.0 | 916 | $1,775 | $1.94 | 20d | 1 | 1.14mi |
| 1801 Chicago Ave Richmond, VA | 2.0 | 1.0 | 850 | $995 | $1.17 | 23d | 1 | 1.15mi |
| 622 E 18th St Richmond, VA | 2.0 | 1.0 | 850 | $995 | $1.17 | 43d | 1 | 1.17mi |
| 1912 Porter St Richmond, VA | 3.0 | 1.5 | 1415 | $1,950 | $1.38 | 23d | 1 | 1.18mi |
| 1709 Everett St Richmond, VA | 4.0 | 1.5 | 1460 | $1,995 | $1.37 | 43d | 1 | 1.18mi |
| 216 Brandon Rd Richmond, VA | 3.0 | 1.0 | 1237 | $1,800 | $1.46 | 23d | 1 | 1.19mi |
| 1707 Chicago Ave Richmond, VA | 2.0 | 1.0 | 750 | $995 | $1.33 | 43d | 1 | 1.19mi |
| 2143 S Kinsley Ave Richmond, VA | 4.0 | 1.0 | 1297 | $1,550 | $1.20 | 43d | 1 | 1.22mi |
| 1305 Chambers St Richmond, VA | 2.0 | 1.0 | 966 | $1,100 | $1.14 | 23d | 1 | 1.23mi |
| 152 Brandon Rd Richmond, VA | 3.0 | 1.0 | 1237 | $2,109 | $1.70 | 23d | 1 | 1.26mi |
| 1514 Bainbridge St Unit A Richmond, VA | 2.0 | 1.0 | 800 | $1,299 | $1.62 | 11d | 1 | 1.31mi |
| 201 Cowardin Ave Unit B Richmond, VA | 2.0 | 2.5 | 1436 | $2,200 | $1.53 | 43d | 1 | 1.32mi |
| 116 E 15th St Richmond, VA | 4.0 | 2.0 | 1452 | $2,250 | $1.55 | 23d | 1 | 1.32mi |
| 1200 Southwood Pkwy Richmond, VA | 1.0–2.0 | 1.0–2.0 | 916 | $1,605 | $1.75 | 43d | 11 | 1.35mi |
| 1112 E 16th St Richmond, VA | 4.0 | 1.0 | 1206 | $1,595 | $1.32 | 43d | 1 | 1.36mi |
| 1422 Bainbridge St Richmond, VA | 2.0 | 2.0 | 1121 | $2,399 | $2.14 | 2d | 1 | 1.37mi |
| 2200 Lynhaven Ave Richmond, VA | 1.0–2.0 | 1.0 | 785 | $1,230 | $1.57 | 4d | 2 | 1.37mi |
| 1411 Porter St Unit B Richmond, VA | 3.0 | 3.0 | 1500 | $2,145 | $1.43 | 4d | 1 | 1.43mi |
| 1429 McDonough St Richmond, VA | 1.0–3.0 | 1.0–2.0 | 826 | $2,469 | $2.99 | 2d | 15 | 1.45mi |
Listing history 4 events
-
2026-06-16status $139,000 Pending 4 DOM
-
2026-06-15days on market $139,000 Active 4 DOM
-
2026-06-13remarks 422-char remark
-
2026-06-13$139,000 Active 2 DOM
ⓘ Source: listings_history table (triggers on properties + properties_extension) + one-shot
backfill from property_details.listing_events for pre-trigger history.
Tax reassessment forecast VA · Resets to sale price
- Current annual tax
- $1,140 · $95/mo
- Projected year-2 tax
- $1,140 · $95/mo
- Expected delta
- $0/yr ($0/mo · 0.0%)
ⓘ Screening estimate from a state-policy table — verify with the county assessor before closing.
Climate risk First Street
- Flood 6/10 Major FEMA zone X (unshaded) · 74% chance over 30 yrs
- Wildfire 1/10 Low
- Heat 8/10 Severe 7 d/yr ≥105°F today · 16 d/yr by 30 yrs out
- Wind 6/10 Major 27% chance of damaging wind over 30 yrs
- Air quality 2/10 Low 1 unhealthy d/yr today · 1 by 30 yrs out
Nearby sold comps map
Loading sold comps map…
Walkable amenities ~0.75 mi
Loading nearby amenities…
Taxation est. · year 1
- Rental income
- $20,825
- − Mortgage interest
- −$7,786
- − Property taxes
- −$1,140
- − Insurance
- −$695
- − Repairs & maintenance
- −$1,666
- − Management
- −$1,666
- − Depreciation
- −$4,044
- Taxable income
- $3,828
- Est. tax owed @ 24.0%
- −$919
- After-tax cash flow
- $4,951/yr
For passive investors: Depreciation is non-cash, so a rental often shows a tax loss while cash-flowing — sheltering income. Rental losses are passive: they offset passive income freely, and up to $25,000/yr can offset ordinary (W-2) income if you actively participate and your MAGI is under $100k (phasing out to $0 by $150k); unused losses carry forward. On sale, claimed depreciation is recaptured at up to 25%, and gains may owe capital-gains tax (a 1031 exchange can defer both). Figures are a year-1 estimate at your 24.0% rate — not tax advice; consult a CPA.
Schools (NCES district)
- District
- Richmond City Public School District
- NCES district ID
- 5103240
- Math proficiency
- 32% ▼ -24.00%
- Reading proficiency
- 47% ▼ -9.00%
- Median HH income
- $40,276
- Composite
- 33.09/100
- National rank
- #5564
- State rank
- #123 of 131 in VA
Livability — Richmond
- Score
- 84/100
- State rank
- #33
- US rank
- #793
Category grades
Schools grade is shown separately in the Schools card above.
Census & demographics
- Census place
- Richmond, VA
- County
- Richmond City · 178,280 people
- City population
- 287,109
- Metro
- Richmond, VA
- Population (ZIP)
- 40,575
- Household income
- $50,475
- Rent vs Own
- Severe rent burden
- 3584.0
Population outlook (Richmond County) Hauer SSP2
- Today (2025)
- 262,263 people
- By 2030
- 284,503 · +8.5%
- By 2040
- 327,353 · +24.8%
- By 2050
- 367,946 · +40.3%
- By 2075
- 449,560 · +71.4%
- By 2100
- 500,301 · +90.8%
Race, ethnicity, and origin ACS 2023
- Neighborhood character
- Diverse neighborhood (Simpson 0.58)
- Race & ethnicity
- Black 59% Hispanic / Latino 22% White 15% Two or more races 6%
- Hispanic origin (detail)
- Mexican 5% Puerto Rican 2%
- Common ancestry
- Romanian 1% Lithuanian 1% Serbian 1%
- Foreign-born
- 17% · Canada
- Languages at home
- 78% English-only · Spanish 19% French/Haitian/Cajun 1%
Political lean MEDSL · Richmond
- 2024 margin
- Solid D (+66.3) · D 82.0% · R 15.8% · Other 2.2%
- 2008→2024 swing
- +7.2pp toward D · 2008: 59.1pp · 2024: 66.3pp
- All cycles
- 2024: D+66.3 2020: D+68.0 2016: D+63.8 2012: D+55.7 2008: D+59.1
Not yet ingested
- Civics
- —
Market trends
- HPI YoY
- ▼ -283.99%
- Current HPI
- 336.9345
- Rent YoY
- ▲ 4.55%
- Metro
- Richmond, VA
- State GDP YoY
- ▲ 2.40%
- F500 in state
- 50
Industry mix (Fortune 500 HQ in VA)
| Industry | F500 HQs | Revenue |
|---|---|---|
| Aerospace / Defense | 4 | $236B |
|
||
| Technology / Defense | 3 | $32B |
|
||
| Financial Services | 2 | $176B |
|
||
| Utilities | 2 | $27B |
|
||
| Insurance | 2 | $25B |
|
||
| Technology | 2 | $15B |
|
||
Price history
+265.8% since first listed3 events — show timeline
- 2026-06-10 Listed $139,000 CVRMLS
- 1990-07-16 Sold (Public Records) $36,078 Public Records
- 1986-09-29 Sold (Public Records) $38,000 Public Records
Property tax history
-2.1%/yrLatest (2022): $1,140 · +6.0% YoY. Source: county tax records.
Cash-flow waterfall
monthlySold comps — $/sqft
last 12 mo · ≤1 miLoading sold comps…