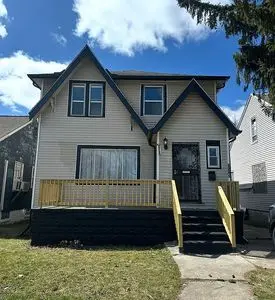
5245 Marlborough St · Detroit, MI
Flood risk 1/10 · Minimal
- FEMA flood zone
- X (unshaded)
- Chance of flooding over 30 yrs
- 0.0%
- Est. flood insurance / yr
- $473 – $860
Fire risk 1/10 · Minimal
- Est. fire insurance / yr
- $784 – $1,456
Heat risk 3/10 · Minor
- Hot days now (above 96°F)
- 7 days/yr
- Hot days in 30 yrs
- 15 days/yr
Wind risk 2/10 · Minimal
- Chance of severe wind over 30 yrs
- —
Air-quality risk 3/10 · Minor
- Unhealthy air days now
- 2 days/yr
- Unhealthy air days in 30 yrs
- 5 days/yr
Risk factors via First Street. Map © Google.
Why this score? — see what drove the B- grade
The composite is a weighted blend of 9 inputs, each scored 0–100. Each bar is that input's sub-score; the figure is the points it added to the 100-point composite (weight × sub-score).
- Cash flow +29.6/30.0
- DSCR +10.0/10.0
- ARV discount +8.2/15.0
- 1% rule +7.3/10.0
- Livability +3.7/5.0
- Rent growth +2.7/5.0
- Condition / age +2.5/5.0
- Schools +1.3/10.0
- Appreciation +0.0/10.0
$115,000
🖨 Deal sheet 📄 Offer letter ✓ Due diligence
Listing remarks
Great Turnkey House in Morningside with a renter at $1431/mo 3 Bedrooms 1 Bath house. Start making a return on your investment day 1. Do not approach the house with out an appointment. Call 772-333-9239
Key facts
- Built 1928
- Listed 23 days
Property features AI
Finance
- Other: Living area approximately 1,426 (exact interior measurements not listed in sections)
- Financial info: Income and expense details not provided
- HOA & community: HOA details not provided
Exterior
- Parking: Parking details not provided
- Security: Details not provided
- Utilities: Utilities details not provided
- Home design: Property type details not provided; Stories and entry level not provided; Facing direction not provided
- Construction: Originally built in 1928
- Exterior features: Located in the Chandler Park-Chalmers subdivision
Interior
- Kitchen: Details not provided
- Bedrooms: Details not provided
- Flooring: Details not provided
- Bathrooms: Details not provided
- Heating & cooling: Details not provided
- Interior features: Built in 1928
- Laundry & utility: Details not provided
Neighborhood map
What this means for you Summary
Snapshot
- This is a 3-bed/1.0-bath single-family listed at $115k.
Deal economics
- At list price, monthly cash flow is $415 ($5k/yr) — positive.
- The deal already cash-flows at list — no discount required.
- Meets the 1% rule at list price ($1k rent vs $115k).
- Recommended offer: $113k (1.5% below list) — sets the bar for market timing.
Location & tenants
- Location reads 73/100 on livability (#218 in MI) — a middle-class / working-renter tenant base. Strengths: amenities A+, commute A+, cost of living A+; Watch: schools F, crime F, employment F.
- Detroit Public Schools Community District (urban): math 10% / reading 24% proficiency, ranked #499 of 540 in MI (top 92%) — low school quality limits family demand, transient renter base, plan for 1-2y turnover; 90% free/reduced lunch — lower-income household profile, screen leases tightly.
- Market conditions: Rents flat; 484 active listings in the ZIP; 40 comparable units currently listed for rent nearby; rentals at typical pace (median 18d on market — plan ~3-4 weeks tenant-placement turnaround); lower-income renter base — watch delinquency; 2,639 units permitted in Wayne County in 2024 (1,216 in 5+ unit buildings).
- This rent runs 38% of the median local income ($45k/yr) — at the standard rent-burdened threshold; future hikes will face affordability resistance.
Forward outlook
- Local home prices are declining (-3.0%/yr); year-one equity from $795 of loan paydown is wiped out by about $3k of value loss. Plan a longer hold.
- Wayne County population projected at -17% by 2050 — secular population decline; favor cash flow + early exit over multi-decade hold.
- At projected returns (-3.0% appreciation + 0.7% rent growth), your $32k cash investment doubles in ~10 years — after that, you're playing with house money.
Negotiation context
- It's been on market 23 days — a 2% lower offer ($113k) is reasonable based on typical stale-listing flexibility.
- 22 sale attempts since 17y ago with the ask held roughly flat each time — persistent listings suggest the price (not the market) is what's stuck; bring a comps-based counter.
- Current owner paid $16k; list at $115k implies a 619% gain — meaningful room to come down on a strong offer.
Risks & watch-outs
- Watch-outs: built in 1928 — expect roof / HVAC / electrical / plumbing capex.
Questions for the listing agent
- Built in 1928 — when were the roof, HVAC, electrical panel, plumbing, and water heater last replaced?
- Is there a deadline driving the sale (1031 exchange, divorce, estate, relocation)? That informs how much negotiation room exists.
- Schools are F-rated, which usually means shorter tenancies and higher turnover. Who's the typical renter profile here, and what's been the actual vacancy rate?
- Crime grade is F in this area — have there been break-ins, vandalism, or insurance claims at this property in the last 3 years? What carrier currently insures it and at what premium?
- What's the average days-on-market for RENTAL listings here right now (not sales)? A rising rental-DOM trend means longer vacancies and softer asking-rent achievability than the comps imply.
- What's the recent tenant-quality profile in this submarket — average credit score on applications, eviction rate, late-payment / NSF rate, and stable-employment percentage? A property-management company in the area should have these aggregated.
- How much new for-sale + rental construction is in the pipeline within 1–3 miles? Heavy new supply typically softens prices + rents 12–24 months out; constrained supply supports both.
Investment metrics
- 1% rule
- 1.23% ✓
- Cap rate
- 10.62%
- Cash-on-cash
- 15.47%
- DSCR
- 1.69
- GRM
- 6.8
CMA / ARV
- ARV (on-the-fly)
- $116,932
- Comps found
- 12
Show comp detail 12 sales within ~0.75 mi
| Address | Dist | Beds/Ba | Sqft | Sold | Price | $/sf | Match |
|---|---|---|---|---|---|---|---|
| 5794 Dickerson St | 0.60mi | 3/1.0 | 1,467 (+3%) | 4mo | $118,000 | $80 | 64 |
| 5050 Somerset Ave | 0.60mi | 3/1.0 | 1,356 (-5%) | 1mo | $84,900 | $63 | 63 |
| 5557 Lakeview St | 0.36mi | 3/1.0 | 1,233 (-14%) | 4mo | $40,000 | $32 | 57 |
| 4643 Somerset Ave | 0.67mi | 3/1.5 | 1,366 (-4%) | 3mo | $80,000 | $59 | 57 |
| 5721 Somerset Ave | 0.60mi | 3/1.5 | 1,513 (+6%) | 3mo | $152,000 | $100 | 57 |
| 4830 Dickerson St | 0.58mi | 3/1.5 | 1,542 (+8%) | 2mo | $60,099 | $39 | 56 |
| 5545 Maryland St | 0.31mi | 4/1.0 (+1) | 1,251 (-12%) | 6mo | $140,000 | $112 | 55 |
| 5306 Somerset Ave | 0.58mi | 3/1.5 | 1,324 (-7%) | 4mo | $135,000 | $102 | 55 |
| 5566 Somerset Ave | 0.60mi | 3/2.5 | 1,521 (+7%) | 3mo | $87,000 | $57 | 53 |
| 4404 Somerset Ave | 0.73mi | 3/1.0 | 1,292 (-9%) | 0mo | $190,000 | $147 | 50 |
| 4810 Lakepointe St | 0.48mi | 4/1.0 (+1) | 1,218 (-15%) | 3mo | $200,000 | $164 | 46 |
| 9131 Wayburn St | 0.65mi | 3/1.5 | 1,222 (-14%) | 6mo | $100,000 | $82 | 39 |
Match score weights: distance 35% · size 25% · config 20% · recency 20%. Top-matched comps best support the ARV.
Projected returns pro-forma
-3.0% appreciation · 0.73% rent growth · sell at horizon
- IRR
- 3.8%
- Equity multiple
- 1.14×
- Total profit
- $4,610
- Equity at exit
- $17,147
- IRR
- 11.2%
- Equity multiple
- 1.79×
- Total profit
- $25,531
- Equity at exit
- $9,943
Cash invested: $32,200 (down + closing). Projections, not guarantees.
Landlord ↔ Tenant lean methodology
- Overall (STATE)
- 62 Landlord-Friendly
- State Michigan
- 62 Landlord-Friendly · EVEN
- County
- — inherits STATE
- City
- — inherits STATE
ZIP-level market 48224
- Rents YoY
- 0.7%
- Active inventory
- 484
- Price-to-rent
- 6.8×
Monthly cashflow live
- Estimated rent
- $1,414 high interval (Pro) →
- Mortgage (P&I)
- −$603
- Tax from tax record
- −$51 /mo · $611/yr
- Insurance
- −$48
- HOA
- −$0
- Vacancy / Maint / Mgmt
- −$297
- Net cashflow
- $415
Break-even live
UW: 25.0% down · 7.5% · 30yr · 1.5% tax · 5.0% vac · 8.0% maint · 8.0% mgmt
Financing live
Cash to close
- Down payment
- $28,750
- Closing costs
- $3,450
- Reserves months
- —
- Total cash needed
- —
Loan-product check · same deal, 3 products live
Conventional
25% down · 7.5% · 30yr
- Down + closing
- —
- Monthly P&I
- —
- Monthly cashflow
- —
- DSCR
- —
- Eligible?
- —
Personal DTI + credit; lowest rate.
DSCR
20% down · 8.5% · 30yr
- Down + closing
- —
- Monthly P&I
- —
- Monthly cashflow
- —
- DSCR
- —
- Eligible?
- —
No personal income docs; deal must DSCR.
Hard money
10% down · 12.0% · 12mo
- Down + closing
- —
- Monthly P&I
- —
- Monthly cashflow
- —
- DSCR
- —
- Eligible?
- —
Short-term bridge; refi at stabilization.
Rent comps 40 comps
| Address | Beds | Baths | Sqft | Rent | $/sqft | DOM | Units | Dist |
|---|---|---|---|---|---|---|---|---|
| 5747 Lakepointe St Detroit, MI | 3.0 | 1.5 | 1316 | $1,473 | $1.12 | 43d | 1 | 0.44mi |
| 5966 Eastlawn St Unit NA Detroit, MI | 3.0 | 1.5 | 1366 | $1,500 | $1.10 | 24d | 1 | 0.48mi |
| 5751 Nottingham Rd Unit 5/21/26 Detroit, MI | 3.0 | 1.0 | 1100 | $1,250 | $1.14 | 15d | 1 | 0.56mi |
| 4251 Wayburn St Detroit, MI | 3.0 | 1.5 | 1326 | $1,650 | $1.24 | 43d | 1 | 0.62mi |
| 5791 Somerset Ave Detroit, MI | 3.0 | 2.0 | 1660 | $1,400 | $0.84 | 17d | 1 | 0.63mi |
| 4391 Nottingham Rd Unit 4393 Detroit, MI | 2.0 | 1.0 | 1038 | $950 | $0.92 | 5d | 1 | 0.66mi |
| 5235 Chatsworth St Detroit, MI | 2.0 | 1.0 | 900 | $1,050 | $1.17 | 43d | 1 | 0.67mi |
| 9168 Wayburn St Detroit, MI | 3.0 | 1.0 | 1274 | $1,300 | $1.02 | 20d | 1 | 0.70mi |
| 9400 Lakepointe St Detroit, MI | 3.0 | 1.0 | 1300 | $1,150 | $0.88 | 5d | 1 | 0.75mi |
| 4151 Nottingham Rd Detroit, MI | 2.0 | 1.0 | 1022 | $1,275 | $1.25 | 17d | 1 | 0.78mi |
| 5574 Buckingham Ave Detroit, MI | 3.0 | 1.0 | 1430 | $1,450 | $1.01 | 4d | 1 | 0.82mi |
| 9409 Balfour Rd Detroit, MI | 3.0 | 1.0 | 1195 | $1,200 | $1.00 | 43d | 1 | 0.83mi |
| 5267 Haverhill St Detroit, MI | 3.0 | 1.5 | 1458 | $1,300 | $0.89 | 17d | 1 | 0.83mi |
| 5267 Haverhill St Detroit, MI | 3.0 | 1.5 | 1458 | $1,300 | $0.89 | 16d | 1 | 0.83mi |
| 5112 Haverhill St Unit 1 Detroit, MI | 2.0 | 1.0 | 1000 | $1,100 | $1.10 | 43d | 1 | 0.86mi |
| 15857 Evanston St Detroit, MI | 3.0 | 1.5 | 1232 | $1,250 | $1.01 | 5d | 1 | 0.92mi |
| 9755 Wayburn St Detroit, MI | 3.0 | 2.0 | 1498 | $1,400 | $0.93 | 3d | 1 | 0.93mi |
| 9927 Beaconsfield St Detroit, MI | 3.0 | 1.0 | 942 | $1,375 | $1.46 | 15d | 1 | 0.94mi |
| 5031 Bedford St Detroit, MI | 2.0 | 1.0 | 876 | $1,870 | $2.13 | 1d | 1 | 0.94mi |
| 5028 Bedford St Detroit, MI | 3.0 | 1.0 | 1000 | $1,400 | $1.40 | 5d | 1 | 0.97mi |
| 9984 Beaconsfield St Detroit, MI | 3.0 | 1.0 | 1222 | $1,575 | $1.29 | 43d | 1 | 0.99mi |
| 10141 Roxbury St Detroit, MI | 3.0 | 1.0 | 1115 | $1,000 | $0.90 | 43d | 1 | 1.00mi |
| 4627 Bedford St Unit 1 Detroit, MI | 2.0 | 1.0 | 1050 | $945 | $0.90 | 20d | 1 | 1.01mi |
| 13137 Elmdale St Detroit, MI | 3.0 | 1.0 | 1115 | $1,400 | $1.26 | 24d | 1 | 1.05mi |
| 13400 Longview St Detroit, MI | 3.0 | 1.5 | 1000 | $1,400 | $1.40 | 43d | 1 | 1.05mi |
| 3625 Chatsworth St Detroit, MI | 3.0 | 1.5 | 1182 | $1,295 | $1.10 | 24d | 1 | 1.10mi |
| 3651 Buckingham Ave Detroit, MI | 3.0 | 1.0 | 1320 | $1,300 | $0.98 | 17d | 1 | 1.15mi |
| 10644 Stratman St Detroit, MI | 2.0 | 1.0 | 1000 | $1,200 | $1.20 | 17d | 1 | 1.18mi |
| 10724 Whitehill St Detroit, MI | 3.0 | 3.0 | 1425 | $1,550 | $1.09 | 18d | 1 | 1.19mi |
| 1348 Wayburn St Grosse Pointe, MI | 3.0 | 2.0 | 1035 | $2,200 | $2.13 | 24d | 1 | 1.24mi |
| 10813 Whitehill St Detroit, MI | 3.0 | 1.0 | 1392 | $1,350 | $0.97 | 17d | 1 | 1.25mi |
| 1334 Maryland St Grosse Pointe Park, MI | 2.0 | 1.0 | 1786 | $1,200 | $0.67 | 18d | 1 | 1.27mi |
| 1314 Maryland St Grosse Pointe Park, MI | 2.0 | 1.0 | 1008 | $1,250 | $1.24 | 43d | 1 | 1.31mi |
| 9635 Everts St Detroit, MI | 4.0 | 2.0 | 1450 | $1,650 | $1.14 | 43d | 1 | 1.33mi |
| 1300 Maryland St Grosse Pointe Park, MI | 2.0 | 1.0 | 900 | $1,200 | $1.33 | 22d | 1 | 1.33mi |
| 1300 Maryland St Grosse Pointe Park, MI | 2.0 | 1.0 | 900 | $1,200 | $1.33 | 3d | 1 | 1.33mi |
| 11018 Whitehill St Detroit, MI | 3.0 | 1.0 | 1146 | $1,450 | $1.27 | 11d | 1 | 1.34mi |
| 5783 Yorkshire Rd Detroit, MI | 2.0 | 1.0 | 1040 | $1,200 | $1.15 | 43d | 1 | 1.36mi |
| 3626 Courville St Detroit, MI | 3.0 | 1.0 | 1260 | $1,300 | $1.03 | 43d | 1 | 1.39mi |
| 1312 Somerset Ave Grosse Pointe Park, MI | 2.0 | 1.0 | 1200 | $1,400 | $1.17 | 16d | 1 | 1.40mi |
Listing history 50 events
-
2026-06-18days on market $115,000 Active 23 DOM
-
2026-06-17days on market $115,000 Active 22 DOM
-
2026-06-15days on market $115,000 Active 20 DOM
-
2026-06-13days on market $115,000 Active 18 DOM
-
2026-06-13days on market $115,000 Active 17 DOM
-
2026-06-09days on market $115,000 Active 14 DOM
-
2026-06-08days on market $115,000 Active 13 DOM
-
2026-06-07days on market $115,000 Active 12 DOM
-
2026-06-04days on market $115,000 Active 9 DOM
-
2026-06-03days on market $115,000 Active 8 DOM
-
2026-06-01days on market $115,000 Active 6 DOM
-
2026-05-31days on market $115,000 Active 5 DOM
-
2026-05-26$115,000 Active
-
2023-03-02historical
-
2023-03-02status Active
-
2023-01-01historical
-
2022-12-31historical
-
2022-10-14price $36,400
-
2022-10-14price $36,400
-
2022-10-06$36,900 Active
-
2022-10-06$36,900 Active
-
2022-09-20historical
-
2022-09-19historical
-
2022-08-18$39,900 Active
-
2022-08-18$39,900 Active
-
2022-08-18historical
-
2022-08-01status Pending
-
2022-08-01status Pending
-
2022-07-28historical
-
2022-05-17historical
-
2022-05-06status Active
-
2022-04-28historical
-
2022-04-27price $29,900
-
2022-04-27price $29,900
-
2022-04-23price $32,000
-
2022-04-23price $32,000
-
2022-04-15status Active
-
2022-04-12historical
-
2022-03-23$38,500 Active
-
2022-03-23$38,500 Active
-
2022-02-16price $38,500
-
2022-02-15historical
-
2022-02-15price $38,500
-
2022-02-15historical
-
2022-02-13price $385,000
-
2022-02-12price $385,000
-
2022-01-28status Active
-
2022-01-24historical
-
2022-01-18$28,000 Active
-
2022-01-18$28,000 Active
ⓘ Source: listings_history table (triggers on properties + properties_extension) + one-shot
backfill from property_details.listing_events for pre-trigger history.
Tax reassessment forecast MI · Partial reset (capped growth)
- Current annual tax
- $611 · $51/mo
- Projected year-2 tax
- $1,191 · $99/mo
- Expected delta
- +$580/yr (+$48/mo · 94.9%)
ⓘ Screening estimate from a state-policy table — verify with the county assessor before closing.
Climate risk First Street
- Flood 1/10 Low FEMA zone X (unshaded) · 0% chance over 30 yrs
- Wildfire 1/10 Low
- Heat 3/10 Moderate 7 d/yr ≥96°F today · 15 d/yr by 30 yrs out
- Wind 2/10 Low
- Air quality 3/10 Moderate 2 unhealthy d/yr today · 5 by 30 yrs out
Nearby sold comps map
Loading sold comps map…
Walkable amenities ~0.75 mi
Loading nearby amenities…
Taxation est. · year 1
- Rental income
- $16,968
- − Mortgage interest
- −$6,442
- − Property taxes
- −$611
- − Insurance
- −$575
- − Repairs & maintenance
- −$1,357
- − Management
- −$1,357
- − Depreciation
- −$3,345
- Taxable income
- $3,279
- Est. tax owed @ 24.0%
- −$787
- After-tax cash flow
- $4,194/yr
For passive investors: Depreciation is non-cash, so a rental often shows a tax loss while cash-flowing — sheltering income. Rental losses are passive: they offset passive income freely, and up to $25,000/yr can offset ordinary (W-2) income if you actively participate and your MAGI is under $100k (phasing out to $0 by $150k); unused losses carry forward. On sale, claimed depreciation is recaptured at up to 25%, and gains may owe capital-gains tax (a 1031 exchange can defer both). Figures are a year-1 estimate at your 24.0% rate — not tax advice; consult a CPA.
Schools (NCES district)
- District
- Detroit Public Schools Community District
- NCES district ID
- 2601103
- Math proficiency
- 10% ▼ -2.00%
- Reading proficiency
- 24% ▲ 6.00%
- Median HH income
- $25,815
- Composite
- 13.06/100
- National rank
- #9564
- State rank
- #499 of 540 in MI
Livability — Detroit
- Score
- 73/100
- State rank
- #218
- US rank
- #5427
Category grades
Schools grade is shown separately in the Schools card above.
Census & demographics
- Census place
- Detroit, MI
- County
- Wayne County · 1,562,939 people
- City population
- 572,865
- Metro
- Detroit-Warren-Dearborn, MI
- Population (ZIP)
- 39,668
- Household income
- $44,856
- Rent vs Own
- Severe rent burden
- 2515.0
Population outlook (Wayne County) Hauer SSP2
- Today (2025)
- 1,675,273 people
- By 2030
- 1,620,300 · -3.3%
- By 2040
- 1,502,341 · -10.3%
- By 2050
- 1,384,039 · -17.4%
- By 2075
- 1,124,592 · -32.9%
- By 2100
- 881,193 · -47.4%
Race, ethnicity, and origin ACS 2023
- Neighborhood character
- Predominantly Black (88%)
- Race & ethnicity
- Black 88% White 8% Two or more races 3% Hispanic / Latino 1%
- Common ancestry
- Iranian 1% Romanian 1% Lithuanian 1%
- Foreign-born
- 1%
- Languages at home
- 97% English-only · Spanish 2%
Political lean MEDSL · Wayne
- 2024 margin
- Strong D (+29.0) · D 62.7% · R 33.7% · Other 3.6%
- 2008→2024 swing
- -20.5pp toward R · 2008: 49.5pp · 2024: 29.0pp
- All cycles
- 2024: D+29.0 2020: D+38.1 2016: D+37.3 2012: D+46.9 2008: D+49.5
Not yet ingested
- Civics
- —
Market trends
- HPI YoY
- ▼ -226.38%
- Current HPI
- 161.886
- Rent YoY
- ▲ 0.73%
- Metro
- Detroit-Warren-Dearborn, MI
- State GDP YoY
- ▲ 1.37%
- F500 in state
- 28
Industry mix (Fortune 500 HQ in MI)
| Industry | F500 HQs | Revenue |
|---|---|---|
| Automotive Parts | 3 | $48B |
|
||
| Automotive | 2 | $372B |
|
||
| Chemicals | 1 | $45B |
|
||
| Automotive Retail | 1 | $29B |
|
||
| Healthcare / Medical Devices | 1 | $23B |
|
||
| Automotive Technology | 1 | $20B |
|
||
Price history
+4175.1% since first listed61 events — show timeline
- 2026-05-26 Listed $115,000 FSBO.com
- 2023-03-02 Listing Removed — REALCOMP
- 2023-03-02 Relisted — REALCOMP
- 2023-01-01 Listing Removed — MiRealSource-MiMLS
- 2022-12-31 Listing Removed — REALCOMP
- 2022-10-14 Price Changed $36,400 MiRealSource-MiMLS
- 2022-10-14 Price Changed $36,400 REALCOMP
- 2022-10-06 Listed $36,900 MiRealSource-MiMLS
- 2022-10-06 Listed $36,900 REALCOMP
- 2022-09-20 Listing Removed — REALCOMP
- 2022-09-19 Listing Removed — MiRealSource-MiMLS
- 2022-08-18 Listed $39,900 MiRealSource-MiMLS
- 2022-08-18 Listed $39,900 REALCOMP
- 2022-08-18 Listing Removed — REALCOMP
- 2022-08-01 Pending — MiRealSource-MiMLS
- 2022-08-01 Pending — REALCOMP
- 2022-07-28 Listing Removed — MiRealSource-MiMLS
- 2022-05-17 Listing Removed — REALCOMP
- 2022-05-06 Relisted — REALCOMP
- 2022-04-28 Listing Removed — REALCOMP
- 2022-04-27 Price Changed $29,900 MiRealSource-MiMLS
- 2022-04-27 Price Changed $29,900 REALCOMP
- 2022-04-23 Price Changed $32,000 MiRealSource-MiMLS
- 2022-04-23 Price Changed $32,000 REALCOMP
- 2022-04-15 Relisted — REALCOMP
- 2022-04-12 Listing Removed — REALCOMP
- 2022-03-23 Listed $38,500 MiRealSource-MiMLS
- 2022-03-23 Listed $38,500 REALCOMP
- 2022-02-16 Price Changed $38,500 MiRealSource-MiMLS
- 2022-02-15 Listing Removed — REALCOMP
- 2022-02-15 Price Changed $38,500 REALCOMP
- 2022-02-15 Listing Removed — MiRealSource-MiMLS
- 2022-02-13 Price Changed $385,000 MiRealSource-MiMLS
- 2022-02-12 Price Changed $385,000 REALCOMP
- 2022-01-28 Relisted — REALCOMP
- 2022-01-24 Listing Removed — REALCOMP
- 2022-01-18 Listed $28,000 MiRealSource-MiMLS
- 2022-01-18 Listed $28,000 REALCOMP
- 2021-03-17 Sold (MLS) $16,000 MiRealSource-MiMLS
- 2021-03-17 Sold (MLS) $16,000 REALCOMP
- 2021-03-15 Pending — MiRealSource-MiMLS
- 2021-03-15 Pending — REALCOMP
- 2020-08-12 Price Changed $19,900 MiRealSource-MiMLS
- 2020-08-12 Price Changed $19,900 REALCOMP
- 2020-06-18 Listed $24,900 MiRealSource-MiMLS
- 2020-06-18 Listed $24,900 REALCOMP
- 2011-01-27 Sold (MLS) $3,500 MiRealSource-MiMLS
- 2011-01-27 Sold (MLS) $3,500 MiRealSource-MiMLS
- 2011-01-27 Sold (MLS) $3,500 REALCOMP
- 2011-01-07 Listing Removed — REALCOMP
- 2011-01-07 Listed $3,500 MiRealSource-MiMLS
- 2011-01-07 Listed $3,500 REALCOMP
- 2010-11-12 Listed $3,500 REALCOMP
- 2010-11-12 Listed $3,500 MiRealSource-MiMLS
- 2010-03-25 Listing Removed — REALCOMP
- 2010-03-25 Listing Removed — MiRealSource-MiMLS
- 2009-11-16 Listed $19,900 REALCOMP
- 2009-11-16 Listed $19,900 MiRealSource-MiMLS
- 2009-11-03 Sold (MLS) $1,000 MiRealSource-MiMLS
- 2009-11-02 Listing Removed — MiRealSource-MiMLS
- 2009-08-02 Listed $2,690 MiRealSource-MiMLS
Property tax history
+6.5%/yrLatest (2025): $611 · -54.1% YoY. Source: county tax records.
Cash-flow waterfall
monthlySold comps — $/sqft
last 12 mo · ≤1 miLoading sold comps…