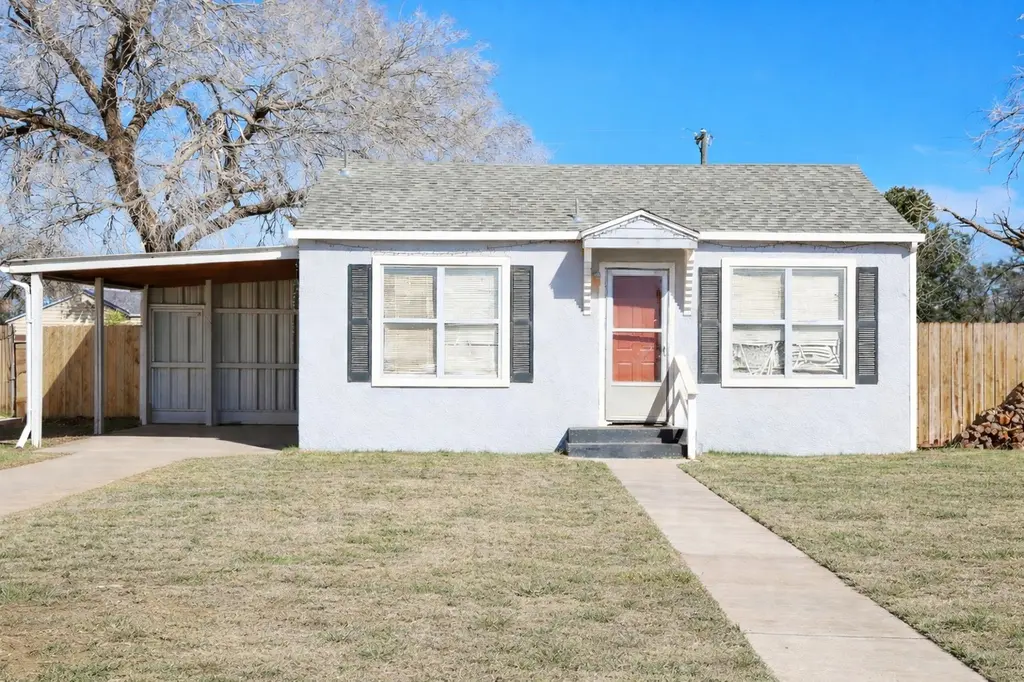
709 10th St · Shallowater, TX
Flood risk 1/10 · Minimal
- FEMA flood zone
- X (unshaded)
- Chance of flooding over 30 yrs
- 0.0%
- Est. flood insurance / yr
- $507 – $1,088
Fire risk 7/10 · Major
- Est. fire insurance / yr
- $1,222 – $2,270
Heat risk 5/10 · Moderate
- Hot days now (above 99°F)
- 7 days/yr
- Hot days in 30 yrs
- 21 days/yr
Wind risk 2/10 · Minimal
- Chance of severe wind over 30 yrs
- —
Air-quality risk 2/10 · Minimal
- Unhealthy air days now
- 1 days/yr
- Unhealthy air days in 30 yrs
- 1 days/yr
Risk factors via First Street. Map © Google.
Why this score? — see what drove the A- grade
The composite is a weighted blend of 9 inputs, each scored 0–100. Each bar is that input's sub-score; the figure is the points it added to the 100-point composite (weight × sub-score).
- Cash flow +30.0/30.0
- DSCR +10.0/10.0
- Appreciation +10.0/10.0
- 1% rule +8.5/10.0
- ARV discount +7.5/15.0
- Schools +6.0/10.0
- Livability +3.7/5.0
- Rent growth +2.5/5.0
- Condition / age +2.5/5.0
$108,900
🖨 Deal sheet (PDF) 📄 Offer letter ✓ Due diligence
Listing remarks MLS
Great property featuring 2-bedroom, 1-bath home with central AC and heat. The home offers a functional floor plan with a complete remodel in 2023, providing comfortable everyday living and room to make it your own. Enjoy the privacy and peaceful style living while still being conveniently located just 15–20 minutes from Texas Tech University, shopping, dining, and major roadways. Ideal for those seeking space, affordability, and easy access to town.
Key facts
- Complete remodel
- Conveniently located
- 0.24 acre lot
Tags
Neighborhood map
What this means for you Summary
Snapshot
- This is a 2-bed/1.0-bath single-family listed at $109k.
Deal economics
- At list price, monthly cash flow is $469 ($6k/yr) — positive.
- The deal already cash-flows at list — no discount required.
- Meets the 1% rule at list price ($1k rent vs $109k).
- Recommended offer: $99k (9.0% below list) — sets the bar for market timing.
Location & tenants
- Location reads 73/100 on livability (#207 in TX) — a middle-class / working-renter tenant base. Strengths: crime A+, cost of living A+, housing A+; Watch: health & safety C-, amenities F, commute F.
- Shallowater ISD (town): math 73% / reading 66% proficiency, ranked #18 of 826 in TX (top 2%) — acceptable for families but not a draw, mixed tenant base, ~2y average lease.
- Zoned schools: Shallowater Int (math 71% / reading 65%, grade B+, #181 of 4,322 statewide, top 4%, 387 students, 39% FRL); Shallowater Middle (math 75% / reading 64%, grade A, #63 of 1,662 statewide, top 4%, 500 students, 37% FRL); Shallowater H S (math 67% / reading 72%, grade B, #119 of 1,632 statewide, top 9%, 542 students, 37% FRL) — zoned schools at 38% FRL track the district average.
- Market conditions: 117 active listings in the ZIP; 2,219 units permitted in Lubbock County in 2024 (252 in 5+ unit buildings).
Forward outlook
- In year one you build about $12k of equity ($753 loan paydown + $11k appreciation (10.0% local appreciation)).
- Lubbock County population projected at +39% by 2050 — long-run rental-demand tailwind backs the buy-and-hold thesis.
- At projected returns (10.0% appreciation + 3.0% rent growth), your $30k cash investment doubles in ~2 years — after that, you're playing with house money.
- By year 4, paydown + projected appreciation supports a ~$41k cash-out refi (75% LTV) — recoverable capital for the next deal without selling this one.
Negotiation context
- It's been on market 108 days — a 9% lower offer ($99k) is reasonable based on typical stale-listing flexibility.
Risks & watch-outs
- Watch-outs: built in 1935 — expect roof / HVAC / electrical / plumbing capex.
- Climate carrying-cost: major wildfire risk; extreme-heat days projected 7→21/yr by 2055 (HVAC capex compounding) — expect insurance premiums to compound above CPI over the hold.
Questions for the listing agent
- It's been on market 108 days. Have you received any prior offers? Is the seller open to a 9% concession, seller financing, or rate buy-down credit?
- Built in 1935 — when were the roof, HVAC, electrical panel, plumbing, and water heater last replaced?
- Why hasn't it sold? Are there any deal-killer items the seller is aware of (foundation, flood, title, zoning, code violations)?
- Is there a deadline driving the sale (1031 exchange, divorce, estate, relocation)? That informs how much negotiation room exists.
- Schools are A-rated — typically a magnet for longer-tenancy family renters. What's the average tenant stay here, and is there a school-zone premium baked into asking?
- What's the average days-on-market for RENTAL listings here right now (not sales)? A rising rental-DOM trend means longer vacancies and softer asking-rent achievability than the comps imply.
- What's the recent tenant-quality profile in this submarket — average credit score on applications, eviction rate, late-payment / NSF rate, and stable-employment percentage? A property-management company in the area should have these aggregated.
- How much new for-sale + rental construction is in the pipeline within 1–3 miles? Heavy new supply typically softens prices + rents 12–24 months out; constrained supply supports both.
Investment metrics
- 1% rule
- 1.35% ✓
- Cap rate
- 11.46%
- Cash-on-cash
- 18.45%
- DSCR
- 1.82
- GRM
- 6.2
CMA / ARV
No comps found within radius.
Projected returns pro-forma
10.0% appreciation · 3.0% rent growth · sell at horizon
- IRR
- 38.0%
- Equity multiple
- 3.92×
- Total profit
- $89,152
- Equity at exit
- $98,106
- IRR
- 32.7%
- Equity multiple
- 8.84×
- Total profit
- $239,031
- Equity at exit
- $211,569
Cash invested: $30,492 (down + closing). Projections, not guarantees.
Landlord ↔ Tenant lean methodology
- Overall (STATE)
- 87 Strongly Landlord-Friendly
- State Texas
- 87 Strongly Landlord-Friendly · R+5
- County
- — inherits STATE
- City
- — inherits STATE
ZIP-level market 79363
- Home prices YoY
- 7.3%
- Active inventory
- 117
- Price-to-rent
- 6.2×
Monthly cashflow live
- Estimated rent
- $1,471 medium interval (Pro) →
- Mortgage (P&I)
- −$571
- Tax from tax record
- −$77 /mo · $921/yr
- Insurance
- −$45
- HOA
- −$0
- Vacancy / Maint / Mgmt
- −$309
- Net cashflow
- $469
Break-even live
Sensitivity live
| Price | -10% $530 | -5% $500 | +0% $469 | +5% $438 | +10% $407 |
|---|---|---|---|---|---|
| Rent | -10% $353 | -5% $411 | +0% $469 | +5% $527 | +10% $585 |
| Rate | -1.0pp $524 | -0.5pp $496 | base $469 | +0.5pp $441 | +1.0pp $412 |
UW: 25.0% down · 7.5% · 30yr · 1.5% tax · 5.0% vac · 8.0% maint · 8.0% mgmt
Financing live
Cash to close
- Down payment
- $27,225
- Closing costs
- $3,267
- Reserves months
- —
- Total cash needed
- —
Loan-product check · same deal, 3 products live
Conventional
25% down · 7.5% · 30yr
- Down + closing
- —
- Monthly P&I
- —
- Monthly cashflow
- —
- DSCR
- —
- Eligible?
- —
Personal DTI + credit; lowest rate.
DSCR
20% down · 8.5% · 30yr
- Down + closing
- —
- Monthly P&I
- —
- Monthly cashflow
- —
- DSCR
- —
- Eligible?
- —
No personal income docs; deal must DSCR.
Hard money
10% down · 12.0% · 12mo
- Down + closing
- —
- Monthly P&I
- —
- Monthly cashflow
- —
- DSCR
- —
- Eligible?
- —
Short-term bridge; refi at stabilization.
Listing history 24 events
-
2026-06-22days on market $108,900 Active 108 DOM
-
2026-06-18days on market $108,900 Active 105 DOM
-
2026-06-17days on market $108,900 Active 104 DOM
-
2026-06-16days on market $108,900 Active 103 DOM
-
2026-06-15days on market $108,900 Active 102 DOM
-
2026-06-14days on market $108,900 Active 100 DOM
-
2026-06-13days on market $108,900 Active 99 DOM
-
2026-06-10days on market $108,900 Active 97 DOM
-
2026-06-09days on market $108,900 Active 96 DOM
-
2026-06-08days on market $108,900 Active 95 DOM
-
2026-06-07days on market $108,900 Active 94 DOM
-
2026-06-05days on market $108,900 Active 91 DOM
-
2026-06-03days on market $108,900 Active 90 DOM
-
2026-06-02days on market $108,900 Active 89 DOM
-
2026-06-01days on market $108,900 Active 88 DOM
-
2026-05-31days on market $108,900 Active 87 DOM
-
2026-05-30days on market $108,900 Active 86 DOM
-
2026-05-13price $108,900 459-char remark
Show marketing remark (459 chars)
Great property featuring 2-bedroom, 1-bath home with central AC and heat. The home offers a functional floor plan with a complete remodel in 2023, providing comfortable everyday living and room to make it your own. Enjoy the privacy and peaceful style living while still being conveniently located just 15–20 minutes from Texas Tech University, shopping, dining, and major roadways. Ideal for those seeking space, affordability, and easy access to town.
-
2026-03-05$109,000 Active 459-char remark
Show marketing remark (459 chars)
Great property featuring 2-bedroom, 1-bath home with central AC and heat. The home offers a functional floor plan with a complete remodel in 2023, providing comfortable everyday living and room to make it your own. Enjoy the privacy and peaceful style living while still being conveniently located just 15–20 minutes from Texas Tech University, shopping, dining, and major roadways. Ideal for those seeking space, affordability, and easy access to town.
-
2023-07-27soldstatus
-
2022-05-26soldstatus
-
2011-11-08soldstatus
-
1993-11-01soldstatus
-
1985-10-01soldstatus
ⓘ Source: listings_history table (triggers on properties + properties_extension) + one-shot
backfill from property_details.listing_events for pre-trigger history.
Tax reassessment forecast TX · Resets to sale price
- Current annual tax
- $921 · $77/mo
- Projected year-2 tax
- $1,993 · $166/mo
- Expected delta
- +$1,072/yr (+$89/mo · 116.3%)
ⓘ Screening estimate from a state-policy table — verify with the county assessor before closing.
Climate risk First Street
- Flood 1/10 Low FEMA zone X (unshaded) · 0% chance over 30 yrs
- Wildfire 7/10 Severe
- Heat 5/10 Major 7 d/yr ≥99°F today · 21 d/yr by 30 yrs out
- Wind 2/10 Low
- Air quality 2/10 Low 1 unhealthy d/yr today · 1 by 30 yrs out
Nearby sold comps map
Loading sold comps map…
Walkable amenities ~0.75 mi
Loading nearby amenities…
Taxation est. · year 1
- Rental income
- $17,651
- − Mortgage interest
- −$6,100
- − Property taxes
- −$921
- − Insurance
- −$544
- − Repairs & maintenance
- −$1,412
- − Management
- −$1,412
- − Depreciation
- −$3,168
- Taxable income
- $4,093
- Est. tax owed @ 24.0%
- −$982
- After-tax cash flow
- $4,643/yr
For passive investors: Depreciation is non-cash, so a rental often shows a tax loss while cash-flowing — sheltering income. Rental losses are passive: they offset passive income freely, and up to $25,000/yr can offset ordinary (W-2) income if you actively participate and your MAGI is under $100k (phasing out to $0 by $150k); unused losses carry forward. On sale, claimed depreciation is recaptured at up to 25%, and gains may owe capital-gains tax (a 1031 exchange can defer both). Figures are a year-1 estimate at your 24.0% rate — not tax advice; consult a CPA.
Schools (NCES district)
- District
- Shallowater ISD
- NCES district ID
- 4839870
- Math proficiency
- 73% ▲ 2.00%
- Reading proficiency
- 66% ▲ 9.00%
- Median HH income
- $57,288
- Composite
- 59.69/100
- National rank
- #903
- State rank
- #18 of 826 in TX
Livability — Shallowater
- Score
- 73/100
- State rank
- #207
- US rank
- #5236
Category grades
Schools grade is shown separately in the Schools card above.
Census & demographics
- Census place
- Shallowater, TX
- Population (ZIP)
- 5,831
Population outlook (Lubbock County) Hauer SSP2
- Today (2025)
- 345,960 people
- By 2030
- 371,449 · +7.4%
- By 2040
- 424,539 · +22.7%
- By 2050
- 481,150 · +39.1%
- By 2075
- 633,467 · +83.1%
- By 2100
- 746,853 · +115.9%
Race, ethnicity, and origin ACS 2023
- Neighborhood character
- Predominantly White (69%)
- Race & ethnicity
- White 69% Hispanic / Latino 27% Two or more races 20%
- Hispanic origin (detail)
- Mexican 23%
- Common ancestry
- Lithuanian 5% Slovak 3% Romanian 2%
- Foreign-born
- 3% · Canada
- Languages at home
- 84% English-only · Spanish 16%
Political lean MEDSL · Lubbock
- 2024 margin
- Solid R (+39.5) · D 29.7% · R 69.2% · Other 1.0%
- 2008→2024 swing
- -2.8pp toward R · 2008: -36.7pp · 2024: -39.5pp
- All cycles
- 2024: R+39.5 2020: R+32.2 2016: R+38.4 2012: R+40.9 2008: R+36.7
Not yet ingested
- Civics
- —
Market trends
- HPI YoY
- ▲ 19.76%
- Current HPI
- 289.7445
- Rent YoY
- —
- Metro
- —
- State GDP YoY
- ▲ 3.95%
- F500 in state
- 110
Industry mix (Fortune 500 HQ in TX)
| Industry | F500 HQs | Revenue |
|---|---|---|
| Energy | 16 | $1,198B |
|
||
| Technology | 5 | $198B |
|
||
| Engineering / Construction | 4 | $72B |
|
||
| Energy Services | 3 | $60B |
|
||
| Utilities | 3 | $41B |
|
||
| Healthcare | 2 | $330B |
|
||
Price history
-0.1% since first listed7 events — show timeline
- 2026-05-13 Price Changed $108,900 HARMLS
- 2026-03-05 Listed $109,000 HARMLS
- 2023-07-27 Sold (Public Records) — Public Records
- 2022-05-26 Sold (Public Records) — Public Records
- 2011-11-08 Sold (Public Records) — Public Records
- 1993-11-01 Sold (Public Records) — Public Records
- 1985-10-01 Sold (Public Records) — Public Records
Property tax history
+5.2%/yrLatest (2025): $921 · +0.9% YoY. Source: county tax records.
Cash-flow waterfall
monthlySold comps — $/sqft
last 12 mo · ≤1 miLoading sold comps…