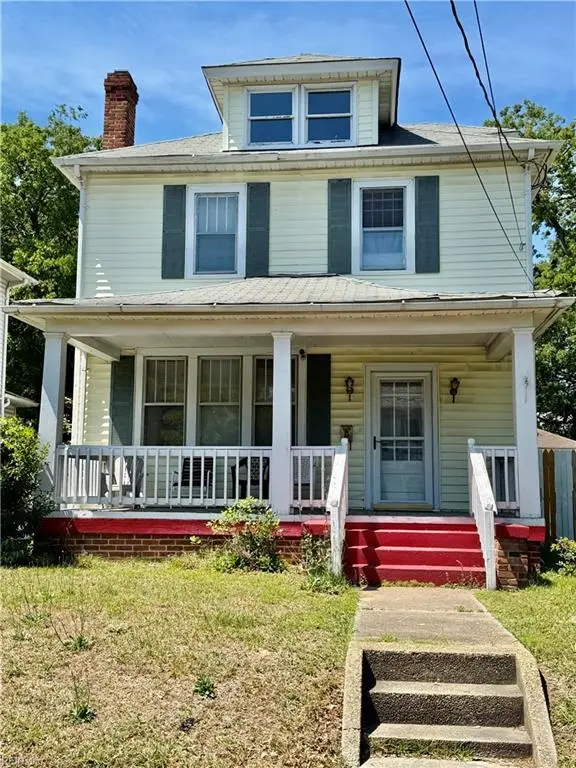
325 63rd St · Newport News, VA
Flood risk 1/10 · Minimal
- FEMA flood zone
- X (unshaded)
- Chance of flooding over 30 yrs
- 0.0%
- Est. flood insurance / yr
- $473 – $860
Fire risk 1/10 · Minimal
- Est. fire insurance / yr
- $666 – $1,236
Heat risk 9/10 · Severe
- Hot days now (above 105°F)
- 7 days/yr
- Hot days in 30 yrs
- 15 days/yr
Wind risk 8/10 · Major
- Chance of severe wind over 30 yrs
- 80.0%
Air-quality risk 2/10 · Minimal
- Unhealthy air days now
- 1 days/yr
- Unhealthy air days in 30 yrs
- 1 days/yr
Risk factors via First Street. Map © Google.
Why this score? — see what drove the D grade
The composite is a weighted blend of 9 inputs, each scored 0–100. Each bar is that input's sub-score; the figure is the points it added to the 100-point composite (weight × sub-score).
- ARV discount +12.2/15.0
- Cash flow +8.1/30.0
- Appreciation +4.6/10.0
- Schools +3.8/10.0
- Livability +3.8/5.0
- Rent growth +3.2/5.0
- Condition / age +2.5/5.0
- DSCR +2.2/10.0
- 1% rule +2.1/10.0
$242,500
🖨 Deal sheet 📄 Offer letter ✓ Due diligence
Listing remarks
Looking for a great home to call your own? This home is blocks away from the Shipyard. Original Harwood floors, amazing front porch, fenced in backyard with a deck, and a detached garage. Looking for one of the few homes in the area with a basement, this one has it! The attic is a walk-in, great to store items, or have a separate office, play room, etc. Check this one out today!
Key facts
- Front porch
- Fenced in backyard
- Basement
Tags
Property features AI
Finance
- HOA & community: No HOA fees
Exterior
- Parking: Detached 1-car garage; Off-street parking; Driveway parking; Street parking
- Utilities: City/County water; City/County sewer; Electric water heater
- Home design: Detached home; Colonial / Traditional style; 2 stories (2 living levels); Basement foundation
- Construction: Vinyl siding; Asphalt shingle roof
- Exterior features: Deck; Back yard fenced; Storage shed
Interior
- Kitchen: Kitchen with pantry; Gas range; Refrigerator; Dishwasher
- Bedrooms: Master bedroom; Additional bedroom; No bedroom with ensuite; No bedroom and full bathroom on first floor
- Flooring: Carpet; Vinyl; Wood
- Bathrooms: 1 full bathroom; 1 half bathroom
- Heating & cooling: Forced hot air heating (natural gas); Central air conditioning
- Interior features: Wood-burning fireplace; Permanent attic stairs with walk-in attic; Attic; Breakfast area; Pantry; Porch; Utility room; 7 total rooms
- Laundry & utility: Washer and dryer present; Washer and dryer hookups; Utility room
Neighborhood map
What this means for you Summary
Snapshot
- This is a 3-bed/1.5-bath single-family listed at $242k.
Deal economics
- At list price, monthly cash flow is $-234 ($-3k/yr) — negative.
- To cash-flow at today's rent, offer at most $201k (17.0% below list).
- To meet the 1% rule (rent ≥ 1% of price), the offer needs to be $172k (29.0% below list).
- Recommended offer: $172k (29.0% below list) — sets the bar for 1% rule.
- Cap rate 5.1% vs local median 4.2% in Newport News — meaningfully above typical; check what's discounted (condition, days-on-market, listing class) to confirm the premium yield is real.
Location & tenants
- Location reads 75/100 on livability (#123 in VA, #4,018 nationally) — a middle-class / working-renter tenant base. Strengths: health & safety A+, cost of living A, housing A; Watch: crime F, commute F.
- Newport News City Public School District (urban): math 34% / reading 54% proficiency, ranked #112 of 131 in VA (top 86%) — families likely to look elsewhere, expect single-tenant / working-renter base with shorter leases.
- Zoned schools: Carver Elementary (math 14% / reading 32%, grade F, #1,066 of 1,108 statewide, top 96%, 600 students, 90% FRL); Heritage High (math 49% / reading 67%, grade C, #262 of 319 statewide, top 82%, 1,111 students, 85% FRL) — zoned schools average 88% FRL vs 55% district-wide (33 pts higher); higher-poverty schools than district average — tighter screening recommended.
- Market conditions: Rents rising (+2.9%/yr); 128 active listings in the ZIP; 16 comparable units currently listed for rent nearby; rentals lingering (median 44d on market — plan ~5-8 weeks vacancy on turnover, expect pricing pressure); 50% of comp listings sitting > 30 days — soft ceiling on asking rent; lower-income renter base — watch delinquency; 522 units permitted in Newport News city in 2024 (458 in 5+ unit buildings).
- At $1,721/mo this rent would consume 49% of the median local household income ($42k/yr) (locally 2008% of renters already pay >50% of income on rent) — very limited rent-growth headroom before tenants either downsize or default.
Forward outlook
- Local home prices are declining (-0.8%/yr); year-one equity from $2k of loan paydown is wiped out by about $2k of value loss. Plan a longer hold.
- Newport News County population projected to shrink 8% by 2050 — rents likely to lag national; underwrite the cash flow, not the appreciation.
Negotiation context
- It's been on market 36 days — a 3% lower offer ($235k) is reasonable based on typical stale-listing flexibility.
- 3 sale attempts since 10y ago with the ask held roughly flat each time — persistent listings suggest the price (not the market) is what's stuck; bring a comps-based counter.
- Current owner paid $127k; list at $242k implies a 91% gain — meaningful room to come down on a strong offer.
Risks & watch-outs
- Watch-outs: built in 1935 — expect roof / HVAC / electrical / plumbing capex.
- Climate carrying-cost: severe wind risk, 80% chance of damaging wind over 30y; extreme-heat days projected 7→15/yr by 2055 (HVAC capex compounding) — expect insurance premiums to compound above CPI over the hold.
Questions for the listing agent
- What do current leases actually rent for vs. the listed asking? Can we see a recent rent roll and the last 12 months of T-12 income?
- It's been on market 36 days. Have you received any prior offers? Is the seller open to a 29% concession, seller financing, or rate buy-down credit?
- Built in 1935 — when were the roof, HVAC, electrical panel, plumbing, and water heater last replaced?
- Is there a deadline driving the sale (1031 exchange, divorce, estate, relocation)? That informs how much negotiation room exists.
- Schools are B-rated — typically a magnet for longer-tenancy family renters. What's the average tenant stay here, and is there a school-zone premium baked into asking?
- Crime grade is F in this area — have there been break-ins, vandalism, or insurance claims at this property in the last 3 years? What carrier currently insures it and at what premium?
- The area grade is low — what's the realistic commute time and amenity access for the typical tenant pool here? Any planned neighborhood developments (good or bad) we should know about?
- What's the average days-on-market for RENTAL listings here right now (not sales)? A rising rental-DOM trend means longer vacancies and softer asking-rent achievability than the comps imply.
- What's the recent tenant-quality profile in this submarket — average credit score on applications, eviction rate, late-payment / NSF rate, and stable-employment percentage? A property-management company in the area should have these aggregated.
- How much new for-sale + rental construction is in the pipeline within 1–3 miles? Heavy new supply typically softens prices + rents 12–24 months out; constrained supply supports both.
Investment metrics
- 1% rule
- 0.71% ✗
- Cap rate
- 5.14%
- Cash-on-cash
- -4.14%
- DSCR
- 0.82
- GRM
- 11.7
CMA / ARV
- ARV (median comp)
- $270,523
- List price
- $242,500
- Delta
- -10.36%
- Verdict
- UNDERPRICED
- Comps
- 20 within 1.0 mi
Show comp detail 12 sales within ~0.75 mi
| Address | Dist | Beds/Ba | Sqft | Sold | Price | $/sf | Match |
|---|---|---|---|---|---|---|---|
| 5815 Greenway Ave | 0.43mi | 4/2.0 (+1) | 1,448 (+2%) | 9mo | $260,000 | $180 | 62 |
| 7307 Madison Ave | 0.68mi | 3/2.0 | 1,382 (-2%) | 5mo | $230,000 | $166 | 58 |
| 4905 Warwick Blvd | 0.68mi | 3/2.5 | 1,380 (-3%) | 2mo | $285,000 | $207 | 58 |
| 702 Highland Ct | 0.57mi | 4/2.0 (+1) | 1,385 (-2%) | 11mo | $293,760 | $212 | 53 |
| 314 69th St | 0.37mi | 2/1.5 (-1) | 1,541 (+9%) | 14mo | $260,000 | $169 | 51 |
| 5933 Madison Ave | 0.57mi | 3/2.0 | 1,320 (-7%) | 12mo | $274,900 | $208 | 50 |
| 327 48th St | 0.74mi | 3/1.5 | 1,292 (-9%) | 1mo | $256,900 | $199 | 50 |
| 5904 Madison Ave | 0.54mi | 3/4.0 | 1,286 (-9%) | 4mo | $220,000 | $171 | 46 |
| 610 Hilton Blvd | 0.49mi | 3/2.5 | 1,585 (+12%) | 10mo | $295,000 | $186 | 45 |
| 667 Ellen Rd | 0.70mi | 3/2.0 | 1,246 (-12%) | 3mo | $254,900 | $205 | 43 |
| 635 Clinton Dr | 0.72mi | 4/2.0 (+1) | 1,500 (+6%) | 11mo | $274,900 | $183 | 41 |
| 611 74th St | 0.74mi | 3/2.0 | 1,265 (-11%) | 11mo | $265,000 | $209 | 37 |
Match score weights: distance 35% · size 25% · config 20% · recency 20%. Top-matched comps best support the ARV.
Projected returns pro-forma
-0.84% appreciation · 2.91% rent growth · sell at horizon
- IRR
- -10.7%
- Equity multiple
- 0.53×
- Total profit
- $-31,591
- Equity at exit
- $60,399
- IRR
- -4.1%
- Equity multiple
- 0.62×
- Total profit
- $-25,864
- Equity at exit
- $65,025
Cash invested: $67,900 (down + closing). Projections, not guarantees.
Landlord ↔ Tenant lean methodology
- Overall (STATE)
- 55 Moderately Landlord-Leaning
- State Virginia
- 55 Moderately Landlord-Leaning · D+2
- County
- — inherits STATE
- City
- — inherits STATE
ZIP-level market 23607
- Home prices YoY
- -0.3%
- Rents YoY
- 2.9%
- Active inventory
- 128
- Price-to-rent
- 11.7×
Monthly cashflow live
- Estimated rent
- $1,721 high interval (Pro) →
- Mortgage (P&I)
- −$1,272
- Tax from tax record
- −$221 /mo · $2,652/yr
- Insurance
- −$101
- HOA
- −$0
- Vacancy / Maint / Mgmt
- −$361
- Net cashflow
- $-234
Break-even live
UW: 25.0% down · 7.5% · 30yr · 1.5% tax · 5.0% vac · 8.0% maint · 8.0% mgmt
Financing live
Cash to close
- Down payment
- $60,625
- Closing costs
- $7,275
- Reserves months
- —
- Total cash needed
- —
Loan-product check · same deal, 3 products live
Conventional
25% down · 7.5% · 30yr
- Down + closing
- —
- Monthly P&I
- —
- Monthly cashflow
- —
- DSCR
- —
- Eligible?
- —
Personal DTI + credit; lowest rate.
DSCR
20% down · 8.5% · 30yr
- Down + closing
- —
- Monthly P&I
- —
- Monthly cashflow
- —
- DSCR
- —
- Eligible?
- —
No personal income docs; deal must DSCR.
Hard money
10% down · 12.0% · 12mo
- Down + closing
- —
- Monthly P&I
- —
- Monthly cashflow
- —
- DSCR
- —
- Eligible?
- —
Short-term bridge; refi at stabilization.
Rent comps 16 comps
| Address | Beds | Baths | Sqft | Rent | $/sqft | DOM | Units | Dist |
|---|---|---|---|---|---|---|---|---|
| 318 61st St Newport News, VA | 2.0 | 1.0 | 950 | $1,500 | $1.58 | 43d | 1 | 0.16mi |
| 325 67th St Newport News, VA | 3.0 | 2.0 | 1595 | $2,095 | $1.31 | 43d | 1 | 0.23mi |
| 6901 Huntington Ave Newport News, VA | 3.0 | 1.5 | 1600 | $1,800 | $1.12 | 43d | 1 | 0.39mi |
| 602 74th St Newport News, VA | 2.0 | 1.0 | 950 | $1,080 | $1.14 | 23d | 1 | 0.64mi |
| 620 73rd St Newport News, VA | 3.0 | 2.0 | 1203 | $1,900 | $1.58 | 2d | 1 | 0.69mi |
| 317 49th St Newport News, VA | 3.0 | 1.5 | 1238 | $1,595 | $1.29 | 23d | 1 | 0.71mi |
| 6010 Jefferson Ave Newport News, VA | 2.0 | 1.0 | 900 | $1,245 | $1.38 | 43d | 2 | 0.86mi |
| 656 49th St Newport News, VA | 3.0 | 1.0 | 946 | $1,500 | $1.59 | 23d | 1 | 0.87mi |
| 902 W Russell Ct Newport News, VA | 3.0 | 1.0 | 984 | $1,450 | $1.47 | 44d | 1 | 0.96mi |
| 635 46th St Newport News, VA | 3.0 | 1.0 | 1097 | $1,400 | $1.28 | 43d | 1 | 0.97mi |
| 646 46th St Unit Na Newport News, VA | 3.0 | 2.0 | 1300 | $1,800 | $1.38 | 43d | 1 | 1.00mi |
| 646 46th St Newport News, VA | 3.0 | 2.0 | 1300 | $1,800 | $1.38 | 4d | 1 | 1.00mi |
| 6206 Hilmar Pl Newport News, VA | 2.0 | 1.0 | 975 | $995 | $1.02 | 43d | 1 | 1.28mi |
| 1112 74th St Newport News, VA | 3.0 | 1.0 | 928 | $1,500 | $1.62 | 21d | 1 | 1.28mi |
| 1115 Briarfield Rd Newport News, VA | 1.0–2.0 | 1.0–2.0 | 1007 | $1,351 | $1.34 | 23d | 1 | 1.34mi |
| 4200 Newsome Dr Newport News, VA | 2.0 | 1.0 | 895 | $795 | $0.89 | 23d | 1 | 1.37mi |
Listing history 23 events
-
2026-06-18days on market $242,500 Active 36 DOM
-
2026-06-17days on market $242,500 Active 35 DOM
-
2026-06-16days on market $242,500 Active 34 DOM
-
2026-06-15days on market $242,500 Active 33 DOM
-
2026-06-09days on market $242,500 Active 27 DOM
-
2026-06-08days on market $242,500 Active 26 DOM
-
2026-06-07days on market $242,500 Active 25 DOM
-
2026-06-03days on market $242,500 Active 21 DOM
-
2026-06-02days on market $242,500 Active 20 DOM
-
2026-06-01days on market $242,500 Active 19 DOM
-
2026-05-31days on market $242,500 Active 18 DOM
-
2026-05-13$242,500 Active 382-char remark
-
2017-08-23soldstatus $127,000
-
2017-08-15status Under Contract
-
2017-08-10$129,000 Active
-
2017-05-25historical
-
2017-02-09price $134,900
-
2016-11-28$139,900 Active
-
2005-03-29soldstatus $129,900
-
1999-05-17soldstatus $81,750
-
1985-09-03soldstatus $68,000
-
1980-08-01soldstatus $40,300
-
1976-04-01soldstatus $28,500
ⓘ Source: listings_history table (triggers on properties + properties_extension) + one-shot
backfill from property_details.listing_events for pre-trigger history.
Tax reassessment forecast VA · Resets to sale price
- Current annual tax
- $2,652 · $221/mo
- Projected year-2 tax
- $2,652 · $221/mo
- Expected delta
- $0/yr ($0/mo · 0.0%)
ⓘ Screening estimate from a state-policy table — verify with the county assessor before closing.
Climate risk First Street
- Flood 1/10 Low FEMA zone X (unshaded) · 0% chance over 30 yrs
- Wildfire 1/10 Low
- Heat 9/10 Extreme 7 d/yr ≥105°F today · 15 d/yr by 30 yrs out
- Wind 8/10 Severe 80% chance of damaging wind over 30 yrs
- Air quality 2/10 Low 1 unhealthy d/yr today · 1 by 30 yrs out
Nearby sold comps map
Loading sold comps map…
Walkable amenities ~0.75 mi
Loading nearby amenities…
Taxation est. · year 1
- Rental income
- $20,655
- − Mortgage interest
- −$13,584
- − Property taxes
- −$2,652
- − Insurance
- −$1,212
- − Repairs & maintenance
- −$1,652
- − Management
- −$1,652
- − Depreciation
- −$7,055
- Taxable loss
- −$7,153
- Est. tax savings @ 24.0%
- +$1,717
- After-tax cash flow
- $-1,091/yr
For passive investors: Depreciation is non-cash, so a rental often shows a tax loss while cash-flowing — sheltering income. Rental losses are passive: they offset passive income freely, and up to $25,000/yr can offset ordinary (W-2) income if you actively participate and your MAGI is under $100k (phasing out to $0 by $150k); unused losses carry forward. On sale, claimed depreciation is recaptured at up to 25%, and gains may owe capital-gains tax (a 1031 exchange can defer both). Figures are a year-1 estimate at your 24.0% rate — not tax advice; consult a CPA.
Schools (NCES district)
- District
- Newport News City Public School District
- NCES district ID
- 5102640
- Math proficiency
- 34% ▼ -37.00%
- Reading proficiency
- 54% ▼ -10.00%
- Median HH income
- $49,644
- Composite
- 37.7/100
- National rank
- #4360
- State rank
- #112 of 131 in VA
Livability — Newport News
- Score
- 75/100
- State rank
- #123
- US rank
- #4018
Category grades
Schools grade is shown separately in the Schools card above.
Census & demographics
- Census place
- Newport News, VA
- County
- Newport News City · 178,950 people
- City population
- 178,950
- Metro
- Virginia Beach-Norfolk-Newport News, VA-NC
- Population (ZIP)
- 23,096
- Household income
- $42,334
- Rent vs Own
- Severe rent burden
- 2008.0
Population outlook (Newport News County) Hauer SSP2
- Today (2025)
- 181,076 people
- By 2030
- 179,683 · -0.8%
- By 2040
- 174,649 · -3.5%
- By 2050
- 167,407 · -7.5%
- By 2075
- 147,597 · -18.5%
- By 2100
- 122,144 · -32.5%
Race, ethnicity, and origin ACS 2023
- Neighborhood character
- Predominantly Black (75%)
- Race & ethnicity
- Black 75% White 13% Two or more races 7% Hispanic / Latino 6% Asian 1%
- Hispanic origin (detail)
- Mexican 1% Puerto Rican 2%
- Foreign-born
- 3% · Canada
- Languages at home
- 96% English-only · Spanish 3%
Political lean MEDSL · Newport News
- 2024 margin
- Strong D (+28.8) · D 63.7% · R 34.9% · Other 1.4%
- 2008→2024 swing
- +0.1pp no change · 2008: 28.7pp · 2024: 28.8pp
- All cycles
- 2024: D+28.8 2020: D+32.9 2016: D+25.4 2012: D+30.0 2008: D+28.7
Not yet ingested
- Civics
- —
Market trends
- HPI YoY
- ▼ -0.84%
- Current HPI
- 312.4039
- Rent YoY
- ▲ 2.91%
- Metro
- Virginia Beach-Norfolk-Newport News, VA-NC
- State GDP YoY
- ▲ 2.40%
- F500 in state
- 50
Industry mix (Fortune 500 HQ in VA)
| Industry | F500 HQs | Revenue |
|---|---|---|
| Aerospace / Defense | 4 | $236B |
|
||
| Technology / Defense | 3 | $32B |
|
||
| Financial Services | 2 | $176B |
|
||
| Utilities | 2 | $27B |
|
||
| Insurance | 2 | $25B |
|
||
| Technology | 2 | $15B |
|
||
Price history
+750.9% since first listed12 events — show timeline
- 2026-05-13 Listed $242,500 REINMLS
- 2017-08-23 Sold (Public Records) $127,000 Public Records
- 2017-08-15 Pending — REINMLS
- 2017-08-10 Listed $129,000 REINMLS
- 2017-05-25 Listing Removed — REINMLS
- 2017-02-09 Price Changed $134,900 REINMLS
- 2016-11-28 Listed $139,900 REINMLS
- 2005-03-29 Sold (Public Records) $129,900 Public Records
- 1999-05-17 Sold (Public Records) $81,750 Public Records
- 1985-09-03 Sold (Public Records) $68,000 Public Records
- 1980-08-01 Sold (Public Records) $40,300 Public Records
- 1976-04-01 Sold (Public Records) $28,500 Public Records
Property tax history
+4.1%/yrLatest (2026): $2,652 · +9.6% YoY. Source: county tax records.
Cash-flow waterfall
monthlySold comps — $/sqft
last 12 mo · ≤1 miLoading sold comps…