45 Vista Gardens Trl · Vero Beach South, FL
Flood risk 9/10 · Severe
- FEMA flood zone
- X (unshaded)
- Chance of flooding over 30 yrs
- 0.99%
- Est. flood insurance / yr
- $507 – $1,088
Fire risk 2/10 · Minimal
- Est. fire insurance / yr
- $947 – $1,759
Heat risk 10/10 · Severe
- Hot days now (above 106°F)
- 7 days/yr
- Hot days in 30 yrs
- 24 days/yr
Wind risk 10/10 · Severe
- Chance of severe wind over 30 yrs
- 99.0%
Air-quality risk 1/10 · Minimal
- Unhealthy air days now
- 0 days/yr
- Unhealthy air days in 30 yrs
- 0 days/yr
Risk factors via First Street. Map © Google.
Why this score? — see what drove the D grade
The composite is a weighted blend of 9 inputs, each scored 0–100. Each bar is that input's sub-score; the figure is the points it added to the 100-point composite (weight × sub-score).
- Cash flow +10.7/30.0
- 1% rule +8.9/10.0
- ARV discount +7.5/15.0
- Schools +4.2/10.0
- Livability +3.9/5.0
- Rent growth +3.5/5.0
- DSCR +3.1/10.0
- Condition / age +2.2/5.0
- Appreciation +0.0/10.0
$109,000
🖨 Deal sheet (PDF) 📄 Offer letter ✓ Due diligence
Listing remarks
comfortable
Key facts
- Built 1984
- Listed 23 days
Neighborhood map
What this means for you Summary
Snapshot
- This is a 1-bed/1.5-bath condo listed at $109k. Condition is rated fair.
Deal economics
- At list price, monthly cash flow is $-119 ($-1k/yr) — negative.
- The deal already cash-flows at list — no discount required.
- Meets the 1% rule at list price ($2k rent vs $109k).
- Recommended offer: $107k (1.5% below list) — sets the bar for market timing.
- Cap rate 5.7% vs local median 4.3% in Vero Beach South — top-decile yield for the area; either an underpriced asset or a hidden risk that comps aren't pricing in. Stress-test before assuming the spread holds.
Location & tenants
- Location reads 78/100 on livability (#163 in FL, #2,445 nationally) — a middle-class / working-renter tenant base. Strengths: commute A+, housing A+, health & safety A; Watch: amenities F.
- Indian River (other): math 48% / reading 52% proficiency, ranked #35 of 73 in FL (top 48%) — acceptable for families but not a draw, mixed tenant base, ~2y average lease.
- Market conditions: Rents rising fast (+4.2%/yr); 348 active listings in the ZIP; 39 comparable units currently listed for rent nearby; rentals at typical pace (median 22d on market — plan ~3-4 weeks tenant-placement turnaround); 564 units permitted in Indian River County in 2024 (281 in 5+ unit buildings).
Forward outlook
- Local home prices are declining (-3.0%/yr); year-one equity from $754 of loan paydown is wiped out by about $3k of value loss. Plan a longer hold.
- Indian River County population projected at +18% by 2050 — long-run rental-demand tailwind backs the buy-and-hold thesis.
Negotiation context
- It's been on market 24 days — a 2% lower offer ($107k) is reasonable based on typical stale-listing flexibility.
- 2 sale attempts since 18y ago with the ask held roughly flat each time — persistent listings suggest the price (not the market) is what's stuck; bring a comps-based counter.
Risks & watch-outs
- Watch-outs: flood insurance adds $66/mo; HOA is 33% of rent.
- Climate carrying-cost: severe flood risk; severe wind risk, 99% chance of damaging wind over 30y; extreme-heat days projected 7→24/yr by 2055 (HVAC capex compounding) — expect insurance premiums to compound above CPI over the hold.
Questions for the listing agent
- What do current leases actually rent for vs. the listed asking? Can we see a recent rent roll and the last 12 months of T-12 income?
- Have any recent inspections been done? Can we get a copy of the seller's disclosures and any deferred-maintenance estimates?
- What's the actual annual flood-insurance premium (NFIP or private), and is the property in a SFHA with mandatory coverage?
- What does the HOA fee cover, when was the last increase, and are there any pending special assessments or reserve-fund shortfalls?
- Any open or pending special assessments — roof, HVAC, plumbing, elevator, façade? What's the per-unit balance and payoff schedule, and is the seller paying it off at close or rolling it to the buyer?
- Is there a deadline driving the sale (1031 exchange, divorce, estate, relocation)? That informs how much negotiation room exists.
- The area grade is low — what's the realistic commute time and amenity access for the typical tenant pool here? Any planned neighborhood developments (good or bad) we should know about?
- What's the average days-on-market for RENTAL listings here right now (not sales)? A rising rental-DOM trend means longer vacancies and softer asking-rent achievability than the comps imply.
- What's the recent tenant-quality profile in this submarket — average credit score on applications, eviction rate, late-payment / NSF rate, and stable-employment percentage? A property-management company in the area should have these aggregated.
- How much new apartment / multifamily construction is in the pipeline within 1–3 miles? Heavy new supply (>2% of stock underway) typically softens rents 12–24 months out; light construction supports rent growth.
Investment metrics
- 1% rule
- 1.39% ✓
- Cap rate
- 5.71%
- Cash-on-cash
- -2.07%
- DSCR
- 0.91
- GRM
- 6.0
CMA / ARV
No comps found within radius.
Projected returns pro-forma
-3.0% appreciation · 4.18% rent growth · sell at horizon
- IRR
- -21.4%
- Equity multiple
- 0.24×
- Total profit
- $-23,066
- Equity at exit
- $16,252
- IRR
- -10.0%
- Equity multiple
- 0.32×
- Total profit
- $-20,716
- Equity at exit
- $9,424
Cash invested: $30,520 (down + closing). Projections, not guarantees.
Landlord ↔ Tenant lean methodology
- Overall (STATE)
- 87 Strongly Landlord-Friendly
- State Florida
- 87 Strongly Landlord-Friendly · R+3
- County
- — inherits STATE
- City
- — inherits STATE
ZIP-level market 32962
- Rents YoY
- 4.2%
- Active inventory
- 348
- Price-to-rent
- 6.0×
Monthly cashflow live
- Estimated rent
- $1,515 high interval (Pro) →
- Mortgage (P&I)
- −$572
- Tax est. 1.5%
- −$136 /mo · $1,635/yr
- Insurance
- −$45
- Flood insurance flood zone
- −$66 /mo · $798/yr
- HOA est. from 2 same-building comps
- −$496
- Vacancy / Maint / Mgmt
- −$318
- Net cashflow
- $-119
Break-even live
Sensitivity live
| Price | -10% $-44 | -5% $-82 | +0% $-119 | +5% $-157 | +10% $-195 |
|---|---|---|---|---|---|
| Rent | -10% $-239 | -5% $-179 | +0% $-119 | +5% $-59 | +10% $0 |
| Rate | -1.0pp $-64 | -0.5pp $-91 | base $-119 | +0.5pp $-147 | +1.0pp $-176 |
UW: 25.0% down · 7.5% · 30yr · 1.5% tax · 5.0% vac · 8.0% maint · 8.0% mgmt
Financing live
Cash to close
- Down payment
- $27,250
- Closing costs
- $3,270
- Reserves months
- —
- Total cash needed
- —
Loan-product check · same deal, 3 products live
Conventional
25% down · 7.5% · 30yr
- Down + closing
- —
- Monthly P&I
- —
- Monthly cashflow
- —
- DSCR
- —
- Eligible?
- —
Personal DTI + credit; lowest rate.
DSCR
20% down · 8.5% · 30yr
- Down + closing
- —
- Monthly P&I
- —
- Monthly cashflow
- —
- DSCR
- —
- Eligible?
- —
No personal income docs; deal must DSCR.
Hard money
10% down · 12.0% · 12mo
- Down + closing
- —
- Monthly P&I
- —
- Monthly cashflow
- —
- DSCR
- —
- Eligible?
- —
Short-term bridge; refi at stabilization.
Rent comps 39 comps
| Address | Beds | Baths | Sqft | Rent | $/sqft | DOM | Units | Dist |
|---|---|---|---|---|---|---|---|---|
| 43 Vista Gardens Trl #205 Vero Beach, FL | 1.0 | 1.5 | 750 | $1,450 | $1.93 | 22d | 1 | 0.08mi |
| 36 Vista Gardens Trl #201 Vero Beach, FL | 2.0 | 2.0 | 1000 | $1,390 | $1.39 | 22d | 1 | 0.24mi |
| 15 Vista Gardens Trl #104 Vero Beach, FL | 1.0 | 1.0 | 630 | $1,300 | $2.06 | 14d | 1 | 0.25mi |
| 4 Vista Gardens Trl #207 Vero Beach, FL | 2.0 | 2.0 | 1000 | $1,550 | $1.55 | 14d | 1 | 0.26mi |
| 11 Vista Gardens Trl #106 Vero Beach, FL | 2.0 | 2.0 | 1000 | $1,600 | $1.60 | 22d | 1 | 0.26mi |
| 34 Vista Gardens Trl #107 Vero Beach, FL | 2.0 | 2.0 | 1000 | $1,350 | $1.35 | 22d | 1 | 0.27mi |
| 35 Vista Gardens Trl #205 Vero Beach, FL | 1.0 | 1.5 | 934 | $1,400 | $1.50 | 22d | 1 | 0.27mi |
| 23 Vista Gardens Trl #203 Vero Beach, FL | 1.0 | 1.5 | 750 | $1,500 | $2.00 | 22d | 1 | 0.29mi |
| 33 Vista Gardens Trl #104 Vero Beach, FL | 1.0 | 1.0 | 630 | $1,500 | $2.38 | 14d | 1 | 0.29mi |
| 102 Royal Oak Dr #105 Vero Beach, FL | 1.0 | 1.5 | 750 | $1,550 | $2.07 | 22d | 1 | 0.35mi |
| 528 7th Sq #102 Vero Beach, FL | 2.0 | 2.0 | 1095 | $3,000 | $2.74 | 22d | 1 | 0.35mi |
| 101 Spring Lake Dr #204 Vero Beach, FL | 1.0 | 1.0 | 630 | $1,275 | $2.02 | 22d | 1 | 0.37mi |
| 95 Spring Lake Dr #103 Vero Beach, FL | 1.0 | 1.5 | 750 | $1,600 | $2.13 | 22d | 1 | 0.37mi |
| 441 7th Pl #441 Vero Beach, FL | 1.0 | 1.0 | 550 | $1,250 | $2.27 | 22d | 1 | 0.37mi |
| 462 7th Pl Vero Beach, FL | 1.0 | 1.0 | 550 | $1,400 | $2.55 | 22d | 1 | 0.40mi |
| 28 Vista Gardens Trl #102 Vero Beach, FL | 2.0 | 2.0 | 1000 | $1,550 | $1.55 | 22d | 1 | 0.41mi |
| 26 Vista Gardens Trl #203 Vero Beach, FL | 1.0 | 1.5 | 750 | $1,350 | $1.80 | 22d | 1 | 0.41mi |
| 103 Royal Oak Dr #106 Vero Beach, FL | 2.0 | 2.0 | 1000 | $1,800 | $1.80 | 14d | 1 | 0.41mi |
| 522 7th Pl Unit 522 Vero Beach, FL | 1.0 | 1.0 | 550 | $1,500 | $2.73 | 22d | 1 | 0.43mi |
| 85 Crooked Tree Ln #203 Vero Beach, FL | 1.0 | 1.5 | 750 | $1,450 | $1.93 | 22d | 1 | 0.50mi |
| 80 Crooked Tree Ln #106 Vero Beach, FL | 2.0 | 2.0 | 1000 | $1,900 | $1.90 | 14d | 1 | 0.51mi |
| 86 Crooked Tree Ln #102 Vero Beach, FL | 2.0 | 2.0 | 1000 | $2,000 | $2.00 | 14d | 1 | 0.52mi |
| 74 Royal Oak Ct #204 Vero Beach, FL | 1.0 | 1.0 | 630 | $1,175 | $1.87 | 22d | 1 | 0.57mi |
| 60 Woodland Dr #204 Vero Beach, FL | 1.0 | 1.0 | 630 | $1,250 | $1.98 | 14d | 1 | 0.62mi |
| 60 Woodland Dr Vero Beach, FL | 1.0 | 1.0 | 630 | $1,125 | $1.79 | 22d | 1 | 0.63mi |
| 65 Woodland Dr #207 Vero Beach, FL | 2.0 | 2.0 | 1000 | $1,600 | $1.60 | 22d | 1 | 0.64mi |
| 58 Woodland Dr #206 Vero Beach, FL | 2.0 | 2.0 | 1000 | $1,800 | $1.80 | 14d | 1 | 0.67mi |
| 50 Woodland Dr #203 Vero Beach, FL | 1.0 | 1.5 | 750 | $1,350 | $1.80 | 14d | 1 | 0.75mi |
| 52 Woodland Dr #204 Vero Beach, FL | 1.0 | 1.0 | 630 | $1,300 | $2.06 | 22d | 1 | 0.75mi |
| 1135 3rd Ave #101 Vero Beach, FL | 2.0 | 2.0 | 906 | $1,800 | $1.99 | 22d | 1 | 0.86mi |
| 5 Vista Palm Ln #203 Vero Beach, FL | 1.0 | 1.5 | 750 | $1,500 | $2.00 | 14d | 1 | 0.94mi |
| 37 Pine Arbor Ln #101 Vero Beach, FL | 2.0 | 2.0 | 1000 | $1,600 | $1.60 | 14d | 1 | 0.98mi |
| 36 Pine Arbor Ln Vero Beach, FL | 2.0 | 2.0 | 1000 | $1,550 | $1.55 | 22d | 2 | 0.99mi |
| 1200 6th Dr Vero Beach, FL | 2.0 | 2.0 | 800 | $1,550 | $1.94 | 14d | 1 | 1.01mi |
| 28 Pine Arbor Ln #103 Vero Beach, FL | 1.0 | 1.5 | 750 | $1,200 | $1.60 | 22d | 1 | 1.13mi |
| 16 Vista Palm Ln Vero Beach, FL | 1.0–2.0 | 1.5–2.0 | 800 | $1,500 | $1.88 | 22d | 2 | 1.15mi |
| 19 Pine Arbor Ln #105 Vero Beach, FL | 1.0 | 1.5 | 750 | $1,800 | $2.40 | 22d | 1 | 1.17mi |
| 1306 12th St Unit B Vero Beach, FL | 2.0 | 1.0 | 1000 | $1,600 | $1.60 | 22d | 1 | 1.44mi |
| 974 14th Ln Vero Beach, FL | 1.0–3.0 | 1.0–3.0 | 1828 | $2,199 | $1.20 | 14d | 32 | 1.45mi |
HOA detail condo
- Monthly dues
- $0 · $0/yr
- Assessments
- None detected in remarks — confirm with the listing agent.
Listing history 19 events
-
2026-06-19days on market $109,000 Active 24 DOM
-
2026-06-18days on market $109,000 Active 23 DOM
-
2026-06-17days on market $109,000 Active 22 DOM
-
2026-06-16days on market $109,000 Active 21 DOM
-
2026-06-15days on market $109,000 Active 20 DOM
-
2026-06-14days on market $109,000 Active 18 DOM
-
2026-06-13days on market $109,000 Active 17 DOM
-
2026-06-10days on market $109,000 Active 15 DOM
-
2026-06-09days on market $109,000 Active 14 DOM
-
2026-06-08days on market $109,000 Active 13 DOM
-
2026-06-07days on market $109,000 Active 12 DOM
-
2026-06-05days on market $109,000 Active 9 DOM
-
2026-06-02days on market $109,000 Active 7 DOM
-
2026-06-01days on market $109,000 Active 6 DOM
-
2026-05-31days on market $109,000 Active 5 DOM
-
2026-05-30days on market $109,000 Active 4 DOM
-
2026-05-27$109,000 Active
-
2016-08-16historical
-
2008-04-10$119,900
ⓘ Source: listings_history table (triggers on properties + properties_extension) + one-shot
backfill from property_details.listing_events for pre-trigger history.
Climate risk First Street
- Flood 9/10 Extreme FEMA zone X (unshaded) · 99% chance over 30 yrs
- Wildfire 2/10 Low
- Heat 10/10 Extreme 7 d/yr ≥106°F today · 24 d/yr by 30 yrs out
- Wind 10/10 Extreme 99% chance of damaging wind over 30 yrs
- Air quality 1/10 Low 0 unhealthy d/yr today · 0 by 30 yrs out
Nearby sold comps map
Loading sold comps map…
Walkable amenities ~0.75 mi
Loading nearby amenities…
Taxation est. · year 1
- Rental income
- $18,175
- − Mortgage interest
- −$6,106
- − Property taxes
- −$1,635
- − Insurance
- −$1,342
- − Repairs & maintenance
- −$1,454
- − Management
- −$1,454
- − HOA
- −$5,952
- − Depreciation
- −$3,171
- Taxable loss
- −$2,939
- Est. tax savings @ 24.0%
- +$705
- After-tax cash flow
- $-725/yr
For passive investors: Depreciation is non-cash, so a rental often shows a tax loss while cash-flowing — sheltering income. Rental losses are passive: they offset passive income freely, and up to $25,000/yr can offset ordinary (W-2) income if you actively participate and your MAGI is under $100k (phasing out to $0 by $150k); unused losses carry forward. On sale, claimed depreciation is recaptured at up to 25%, and gains may owe capital-gains tax (a 1031 exchange can defer both). Figures are a year-1 estimate at your 24.0% rate — not tax advice; consult a CPA.
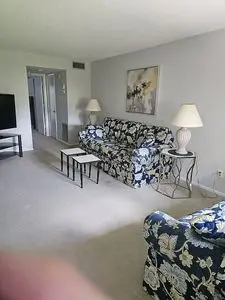
Condition & rehab AI · 2 photos
The property is in fair condition with some cosmetic issues that can be addressed with minor repairs and maintenance. The living room appears lived-in and could benefit from cleaning and touch-ups to improve its appearance.
Repairs flagged
- Major Construction debris removal — Construction cones and debris suggest ongoing work that needs cleanup.
- Minor Paint touch-ups — Paint appears faded in some areas, indicating wear and tear.
- Minor Floor cleaning — Carpeted flooring in the living room may need cleaning to remove dust and debris.
- Minor Interior cleaning — Living room appears lived-in but shows signs of wear and tear, indicating a need for cleaning and possibly minor repairs.
Value-add opportunities
- Both Paint touch-ups — Fresh paint can improve the appearance and value of the property.
- Both Floor cleaning — A clean and well-maintained floor can enhance the overall appeal of the property.
- Both Interior cleaning — A clean and well-maintained interior can improve the overall appeal of the property and make it more attractive to potential buyers or renters.
Renovation cost estimate screening
| Repair item | Severity | Est. cost |
|---|---|---|
| Construction debris removal · Construction cones and debris suggest ongoing work that needs cleanup. | Major | $15,000–50,000 |
| Paint touch-ups · Paint appears faded in some areas, indicating wear and tear. | Minor | $500–3,000 |
| Floor cleaning · Carpeted flooring in the living room may need cleaning to remove dust and debris. | Minor | $500–3,000 |
| Interior cleaning · Living room appears lived-in but shows signs of wear and tear, indicating a need for cleaning and possibly minor repairs. | Minor | $500–3,000 |
| Total estimated repair cost · 4 items | $16,500–59,000 |
Value-add ROI direction
- Both Paint touch-ups — Fresh paint can improve the appearance and value of the property. ↑
- Both Floor cleaning — A clean and well-maintained floor can enhance the overall appeal of the property. ↑
- Both Interior cleaning — A clean and well-maintained interior can improve the overall appeal of the property and make it more attractive to potential buyers or renters. ↑
ⓘ Cost ranges are severity-bucket heuristics (US national rule-of-thumb). Get contractor quotes + a written scope before underwriting a rehab budget.
Schools (NCES district)
- District
- Indian River
- NCES district ID
- 1200930
- Math proficiency
- 48% ▼ -9.00%
- Reading proficiency
- 52% ▼ -3.00%
- Median HH income
- $46,597
- Composite
- 42.45/100
- National rank
- #3218
- State rank
- #35 of 73 in FL
Livability — Vero Beach South
- Score
- 78/100
- State rank
- #163
- US rank
- #2445
Category grades
Schools grade is shown separately in the Schools card above.
Census & demographics
- Census place
- Vero Beach South, FL
- County
- Indian River County · 143,738 people
- Metro
- Sebastian-Vero Beach, FL
- Population (ZIP)
- 25,522
- Household income
- $66,664
- Rent vs Own
- Severe rent burden
- 425.0
Population outlook (Indian River County) Hauer SSP2
- Today (2025)
- 165,104 people
- By 2030
- 172,869 · +4.7%
- By 2040
- 185,640 · +12.4%
- By 2050
- 194,465 · +17.8%
- By 2075
- 211,115 · +27.9%
- By 2100
- 211,781 · +28.3%
Race, ethnicity, and origin ACS 2023
- Neighborhood character
- Predominantly White (70%)
- Race & ethnicity
- White 70% Black 13% Hispanic / Latino 12% Two or more races 5% Native American 1%
- Hispanic origin (detail)
- Mexican 1% Puerto Rican 2% Cuban 1%
- Common ancestry
- Romanian 4% Lithuanian 4% Italian 3%
- Foreign-born
- 12% · Canada, Jamaica, Dominican Republic
- Languages at home
- 85% English-only · Spanish 9% Other Indo-European 2% French/Haitian/Cajun 1%
Political lean MEDSL · Indian River
- 2024 margin
- Strong R (+27.4) · D 36.0% · R 63.4%
- 2008→2024 swing
- -12.5pp toward R · 2008: -14.8pp · 2024: -27.4pp
- All cycles
- 2024: R+27.4 2020: R+21.6 2016: R+24.5 2012: R+22.3 2008: R+14.8
Not yet ingested
- Civics
- —
Market trends
- HPI YoY
- ▼ -182.13%
- Current HPI
- 333.3274
- Rent YoY
- ▲ 4.18%
- Metro
- Sebastian-Vero Beach, FL
- State GDP YoY
- ▲ 3.28%
- F500 in state
- 36
Industry mix (Fortune 500 HQ in FL)
| Industry | F500 HQs | Revenue |
|---|---|---|
| Industrial Technology | 2 | $29B |
|
||
| Insurance | 2 | $17B |
|
||
| Retail | 1 | $60B |
|
||
| Technology Distribution | 1 | $58B |
|
||
| Homebuilding | 1 | $35B |
|
||
| Technology Manufacturing | 1 | $35B |
|
||
Price history
-9.1% since first listed3 events — show timeline
- 2026-05-27 Listed $109,000 FSBO.com
- 2016-08-16 Listing Removed — SCMLS
- 2008-04-10 Listed $119,900 SCMLS
Cash-flow waterfall
monthlySold comps — $/sqft
last 12 mo · ≤1 miLoading sold comps…