814 America Way · Solana Beach, CA
Flood risk 1/10 · Minimal
- FEMA flood zone
- X (unshaded)
- Chance of flooding over 30 yrs
- 0.0%
- Est. flood insurance / yr
- $507 – $1,088
Fire risk 1/10 · Minimal
- Est. fire insurance / yr
- $659 – $1,223
Heat risk 4/10 · Minor
- Hot days now (above 86°F)
- 7 days/yr
- Hot days in 30 yrs
- 19 days/yr
Wind risk 1/10 · Minimal
- Chance of severe wind over 30 yrs
- —
Air-quality risk 4/10 · Minor
- Unhealthy air days now
- 4 days/yr
- Unhealthy air days in 30 yrs
- 4 days/yr
Risk factors via First Street. Map © Google.
Why this score? — see what drove the D+ grade
The composite is a weighted blend of 9 inputs, each scored 0–100. Each bar is that input's sub-score; the figure is the points it added to the 100-point composite (weight × sub-score).
- ARV discount +13.9/15.0
- Schools +7.8/10.0
- Appreciation +7.5/10.0
- Cash flow +5.0/30.0
- Rent growth +5.0/5.0
- Livability +3.9/5.0
- Condition / age +2.5/5.0
- 1% rule +1.1/10.0
- DSCR +0.0/10.0
$949,990
🖨 Deal sheet 📄 Offer letter ✓ Due diligence
Listing remarks MLS
CLICK PHOTO FOR VIEWS. ((NO FREEWAY NOISE)) Secluded private retreat. Escape to a backdrop of trees and solitude. Relax poolside or simply languish in your undisturbed quiet courtyard. Close to exclusive shopping and restaurants. This desirable location is only pared by an equally desirable price. Guaranteed to go fast !!!!!
Key facts
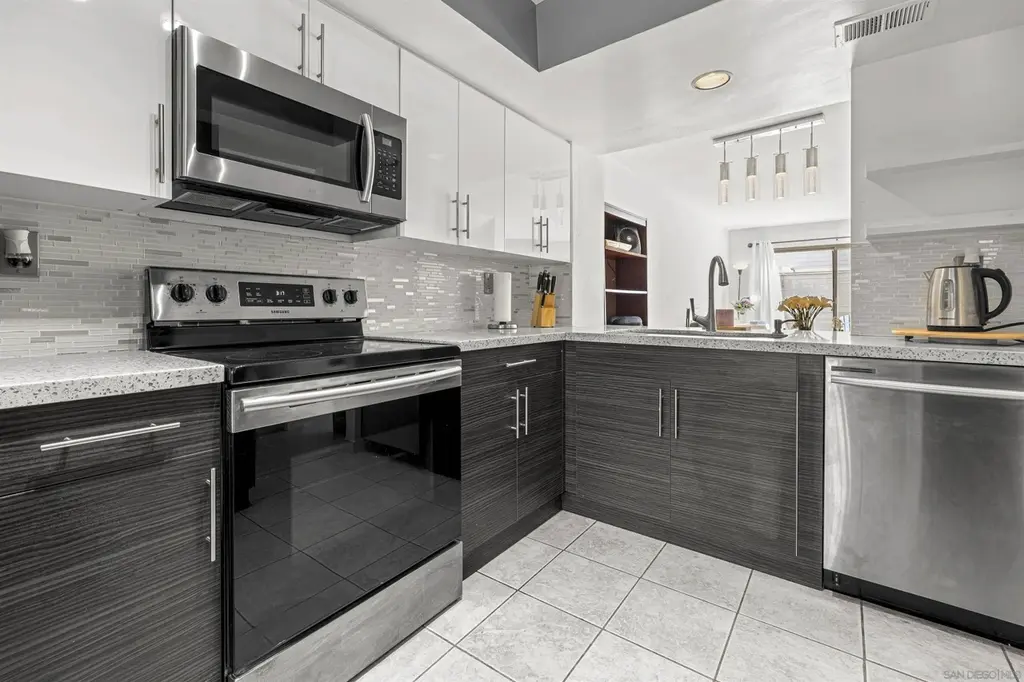
- Extensively updated
- Quartz countertops
- Remodeled townhome
Tags
Property features AI
Finance
- Other: Directions: Front door is on Spindrift; as you go up the hill pass America Way and stay on Spindrift. Property is in the first building on the left.
- HOA & community: Homeowners association; Monthly association fee of $773; HOA covers water, grounds maintenance, and structure maintenance; Association provides trash service; Building name: SPINDRIFT; Subdivision: DEL MAR
Exterior
- Parking: 3 total parking spaces; Attached garage with garage door opener; 1 garage space
- Utilities: Public water; Sewer connected
- Home design: Townhouse; Residential property; Entry level: 2; 3 stories
- Construction: Townhome construction
- Exterior features: Common-interest lot (community grounds)
Interior
- Kitchen: Dishwasher; Disposal; Microwave; Refrigerator; Electric range
- Bedrooms: 2 possible bedrooms
- Bathrooms: 1 full bathroom; 1 half bathroom
- Heating & cooling: Central air conditioning; Forced air heating; Electric heating; Fireplace heating
- Interior features: Fireplace in living room; Community pool
- Laundry & utility: Dryer
Neighborhood map
What this means for you Summary
Snapshot
- This is a 2-bed/2.0-bath townhouse listed at $950k.
Deal economics
- At list price, monthly cash flow is $-2k ($-27k/yr) — negative.
- To cash-flow at today's rent, offer at most $555k (41.5% below list).
- To meet the 1% rule (rent ≥ 1% of price), the offer needs to be $584k (38.5% below list).
- Recommended offer: $555k (41.5% below list) — sets the bar for cash-flow.
- Cap rate 3.5% vs local median 1.6% in Solana Beach — top-decile yield for the area; either an underpriced asset or a hidden risk that comps aren't pricing in. Stress-test before assuming the spread holds.
Location & tenants
- Location reads 77/100 on livability (#81 in CA, #3,100 nationally) — a middle-class / working-renter tenant base. Strengths: schools A+, crime A+, commute A+; Watch: amenities D+, health & safety D, cost of living F.
- Solana Beach Elementary (urban): math 82% / reading 86% proficiency, ranked #23 of 1,400 in CA (top 2%) — strong family-tenant draw, lease renewals of 3-5y typical; only 6% free/reduced lunch — higher-income household profile.
- Market conditions: Rents rising fast (+12.7%/yr); 82 active listings in the ZIP; 25 comparable units currently listed for rent nearby; rentals leasing fast (median 2d on market — plan ~1-2 weeks tenant-placement turnaround); high-income renter base; 11,759 units permitted in San Diego County in 2024 (7,244 in 5+ unit buildings).
- This rent runs 35% of the median local income ($199k/yr) — at the standard rent-burdened threshold; future hikes will face affordability resistance.
Forward outlook
- In year one you build about $54k of equity ($7k loan paydown + $47k appreciation (5.0% local appreciation)).
- San Diego County population projected at +20% by 2050 — long-run rental-demand tailwind backs the buy-and-hold thesis.
- By year 2, paydown + projected appreciation supports a ~$86k cash-out refi (75% LTV) — recoverable capital for the next deal without selling this one.
Negotiation context
- It's been on market 56 days — a 3% lower offer ($921k) is reasonable based on typical stale-listing flexibility.
- 10 sale attempts since 27y ago; this cycle's ask has dropped $100k (10%) from the opening price — seller is motivated, your offer sets the floor, not the list.
- Current owner paid $480k; list at $950k implies a 98% gain — meaningful room to come down on a strong offer.
Questions for the listing agent
- What do current leases actually rent for vs. the listed asking? Can we see a recent rent roll and the last 12 months of T-12 income?
- It's been on market 56 days. Have you received any prior offers? Is the seller open to a 42% concession, seller financing, or rate buy-down credit?
- What does the HOA fee cover, when was the last increase, and are there any pending special assessments or reserve-fund shortfalls?
- Is there a deadline driving the sale (1031 exchange, divorce, estate, relocation)? That informs how much negotiation room exists.
- Schools are A-rated — typically a magnet for longer-tenancy family renters. What's the average tenant stay here, and is there a school-zone premium baked into asking?
- The area grade is low — what's the realistic commute time and amenity access for the typical tenant pool here? Any planned neighborhood developments (good or bad) we should know about?
- What's the average days-on-market for RENTAL listings here right now (not sales)? A rising rental-DOM trend means longer vacancies and softer asking-rent achievability than the comps imply.
- What's the recent tenant-quality profile in this submarket — average credit score on applications, eviction rate, late-payment / NSF rate, and stable-employment percentage? A property-management company in the area should have these aggregated.
- How much new for-sale + rental construction is in the pipeline within 1–3 miles? Heavy new supply typically softens prices + rents 12–24 months out; constrained supply supports both.
Investment metrics
- 1% rule
- 0.61% ✗
- Cap rate
- 3.47%
- Cash-on-cash
- -10.08%
- DSCR
- 0.55
- GRM
- 13.6
CMA / ARV
- ARV (on-the-fly)
- $1,106,528
- Comps found
- 12
Show comp detail 12 sales within ~0.75 mi
| Address | Dist | Beds/Ba | Sqft | Sold | Price | $/sf | Match |
|---|---|---|---|---|---|---|---|
| 959 Intrepid Ct | 0.00mi | 2/2.0 | 1,208 (0%) | 4mo | $1,050,000 | $869 | 97 |
| 847 America Way | 0.04mi | 2/1.5 | 1,208 (0%) | 15mo | $819,000 | $678 | 84 |
| 960 Intrepid Ct | 0.00mi | 2/2.5 | 1,298 (+8%) | 4mo | $1,175,000 | $905 | 82 |
| 542 Via de la Valle Unit J | 0.45mi | 2/2.0 | 1,208 (0%) | 4mo | $970,494 | $803 | 76 |
| 532 1/2 Via de la Valle H Unit H | 0.42mi | 2/2.0 | 1,208 (0%) | 14mo | $1,100,000 | $911 | 69 |
| 473 Bay Meadows Way | 0.49mi | 3/2.0 (+1) | 1,173 (-3%) | 12mo | $1,075,000 | $916 | 57 |
| 465 Bay Meadows Way | 0.52mi | 3/2.5 (+1) | 1,173 (-3%) | 8mo | $1,200,000 | $1,023 | 57 |
| 831 Valley Ave | 0.37mi | 2/1.5 | 1,092 (-10%) | 14mo | $965,000 | $884 | 54 |
| 369 Longden Ln | 0.63mi | 2/3.0 | 1,293 (+7%) | 15mo | $1,559,000 | $1,206 | 43 |
| 827 Del Mar Downs Rd Unit E | 0.62mi | 3/2.5 (+1) | 1,344 (+11%) | 7mo | $1,535,816 | $1,143 | 40 |
| 351 Shoemaker Ln | 0.71mi | 2/2.5 | 1,339 (+11%) | 12mo | $1,692,000 | $1,264 | 37 |
| 648 E Solana Cir | 0.72mi | 2/1.5 | 1,044 (-14%) | 15mo | $1,105,500 | $1,059 | 30 |
Match score weights: distance 35% · size 25% · config 20% · recency 20%. Top-matched comps best support the ARV.
Projected returns pro-forma
4.95% appreciation · 8.0% rent growth · sell at horizon
- IRR
- 6.0%
- Equity multiple
- 1.40×
- Total profit
- $105,271
- Equity at exit
- $535,642
- IRR
- 10.0%
- Equity multiple
- 2.94×
- Total profit
- $517,217
- Equity at exit
- $922,216
Cash invested: $265,997 (down + closing). Projections, not guarantees.
Landlord ↔ Tenant lean methodology
- Overall (STATE)
- 18 Strongly Tenant-Friendly
- State California
- 18 Strongly Tenant-Friendly · D+13
- County
- — inherits STATE
- City
- — inherits STATE
ZIP-level market 92014
- Home prices YoY
- 1.1%
- Rents YoY
- 12.7%
- Active inventory
- 82
- Price-to-rent
- 13.6×
Monthly cashflow live
- Estimated rent
- $5,842 high interval (Pro) →
- Mortgage (P&I)
- −$4,982
- Tax from tax record
- −$698 /mo · $8,381/yr
- Insurance
- −$396
- HOA
- −$773
- Vacancy / Maint / Mgmt
- −$1,227
- Net cashflow
- $-2,234
Break-even live
UW: 25.0% down · 7.5% · 30yr · 1.5% tax · 5.0% vac · 8.0% maint · 8.0% mgmt
Financing live
Cash to close
- Down payment
- $237,498
- Closing costs
- $28,500
- Reserves months
- —
- Total cash needed
- —
Loan-product check · same deal, 3 products live
Conventional
25% down · 7.5% · 30yr
- Down + closing
- —
- Monthly P&I
- —
- Monthly cashflow
- —
- DSCR
- —
- Eligible?
- —
Personal DTI + credit; lowest rate.
DSCR
20% down · 8.5% · 30yr
- Down + closing
- —
- Monthly P&I
- —
- Monthly cashflow
- —
- DSCR
- —
- Eligible?
- —
No personal income docs; deal must DSCR.
Hard money
10% down · 12.0% · 12mo
- Down + closing
- —
- Monthly P&I
- —
- Monthly cashflow
- —
- DSCR
- —
- Eligible?
- —
Short-term bridge; refi at stabilization.
Rent comps 25 comps
| Address | Beds | Baths | Sqft | Rent | $/sqft | DOM | Units | Dist |
|---|---|---|---|---|---|---|---|---|
| 873 Stevens Ave Solana Beach, CA | 2.0 | 1.0–2.0 | 945 | $3,180 | $3.37 | 2d | 1 | 0.39mi |
| 766 S Nardo Ave Solana Beach, CA | 1.0 | 1.0 | 730 | $2,745 | $3.76 | 3d | 1 | 0.53mi |
| 701 S Nardo Ave Solana Beach, CA | 1.0–2.0 | 1.0–2.0 | 963 | $7,620 | $7.91 | 2d | 23 | 0.58mi |
| 735 Genevieve St Unit B Solana Beach, CA | 2.0 | 1.0 | 750 | $2,995 | $3.99 | 20d | 1 | 0.59mi |
| 851 Del Mar Downs Rd Unit E Solana Beach, CA | 2.0 | 1.5 | 1116 | $4,700 | $4.21 | 8d | 1 | 0.64mi |
| 823 Sea Turf Cir Solana Beach, CA | 2.0 | 2.0 | 1218 | $4,995 | $4.10 | 4d | 1 | 0.81mi |
| 930 Via Mil Cumbres #185 Solana Beach, CA | 2.0 | 2.0 | 1300 | $3,995 | $3.07 | 2d | 1 | 0.94mi |
| 833 S Cedros Ave Solana Beach, CA | 1.0 | 1.0 | 525 | $3,195 | $6.09 | 4d | 1 | 0.96mi |
| 930 Via Mil Cumbres Solana Beach, CA | 2.0 | 2.0 | 1263 | $3,595 | $2.85 | 19d | 1 | 0.96mi |
| 880 S Sierra Ave Solana Beach, CA | 3.0 | 3.0 | 1382 | $6,500 | $4.70 | 3d | 1 | 1.05mi |
| 806 S Sierra Ave Solana Beach, CA | 3.0 | 2.0 | 1382 | $5,950 | $4.31 | 16d | 1 | 1.05mi |
| 806 S Sierra Ave Unit 1 Solana Beach, CA | 3.0 | 2.5 | 1382 | $5,950 | $4.31 | 22d | 1 | 1.05mi |
| 152 S Shore Dr Solana Beach, CA | 2.0 | 2.0 | 1210 | $5,400 | $4.46 | 2d | 1 | 1.15mi |
| 190 Del Mar Shores Ter #11 Solana Beach, CA | 1.0 | 1.0 | 838 | $8,800 | $10.50 | 2d | 1 | 1.17mi |
| 675 S Sierra Ave #29 Solana Beach, CA | 2.0 | 2.5 | 1210 | $5,990 | $4.95 | 2d | 1 | 1.17mi |
| 120 Dahlia Dr Solana Beach, CA | 1.0–2.0 | 1.0–2.0 | 976 | $7,500 | $7.68 | 2d | 2 | 1.18mi |
| 2821 Camino Del Mar Del Mar, CA | 1.0–2.0 | 1.0–1.5 | 747 | $4,763 | $6.37 | 2d | 2 | 1.19mi |
| 429 S Sierra Ave Solana Beach, CA | 2.0 | 2.0–2.5 | 1294 | $10,650 | $8.23 | 2d | 2 | 1.25mi |
| 429 S Sierra Ave #331 Solana Beach, CA | 2.0 | 2.5 | 1422 | $12,500 | $8.79 | 10d | 1 | 1.26mi |
| 242 S Helix Ave Solana Beach, CA | 2.0 | 1.0 | 850 | $3,995 | $4.70 | 19d | 1 | 1.27mi |
| 239 S Helix Ave #25 Solana Beach, CA | 2.0 | 2.0 | 1425 | $13,000 | $9.12 | 2d | 1 | 1.31mi |
| 215 N Rios Ave Solana Beach, CA | 2.0 | 1.0 | 936 | $15,000 | $16.03 | 2d | 1 | 1.31mi |
| 233 S Helix Ave Unit K Solana Beach, CA | 2.0 | 2.0 | 1425 | $15,000 | $10.53 | 2d | 1 | 1.31mi |
| 219 24th St Del Mar, CA | 2.0 | 1.5 | 1040 | $18,500 | $17.79 | 2d | 1 | 1.31mi |
| 2001 Ocean Front Del Mar, CA | 2.0 | 2.0 | 1166 | $10,000 | $8.58 | 2d | 1 | 1.50mi |
HOA detail
- Monthly dues
- $773 · $9,276/yr
- Likely covers
- pool
Listing history 40 events
-
2026-06-18days on market $949,990 Active 56 DOM
-
2026-06-17days on market $949,990 Active 55 DOM
-
2026-06-16days on market $949,990 Active 54 DOM
-
2026-06-15days on market $949,990 Active 53 DOM
-
2026-06-13days on market $949,990 Active 51 DOM
-
2026-06-13pricedays on market $949,990 Active 50 DOM
-
2026-06-09days on market $999,990 Active 47 DOM
-
2026-06-08remarks 699-char remark
-
2026-06-08days on market $999,990 Active 46 DOM
-
2026-06-07days on market $999,990 Active 45 DOM
-
2026-06-04days on market $999,990 Active 42 DOM
-
2026-06-03days on market $999,990 Active 41 DOM
-
2026-06-02days on market $999,990 Active 40 DOM
-
2026-06-01days on market $999,990 Active 39 DOM
-
2026-05-31days on market $999,990 Active 38 DOM
-
2026-05-12price $999,990
-
2026-04-20$1,050,000 Active
-
2015-12-28soldstatus $480,000
-
2006-09-30historical
-
2006-01-04$520,000
-
2002-04-16soldstatus $299,000 326-char remark
Show marketing remark (326 chars)
CLICK PHOTO FOR VIEWS. ((NO FREEWAY NOISE)) Secluded private retreat. Escape to a backdrop of trees and solitude. Relax poolside or simply languish in your undisturbed quiet courtyard. Close to exclusive shopping and restaurants. This desirable location is only pared by an equally desirable price. Guaranteed to go fast !!!!!
-
2002-04-16soldstatus $299,000
Show marketing remark (326 chars)
CLICK PHOTO FOR VIEWS. ((NO FREEWAY NOISE)) Secluded private retreat. Escape to a backdrop of trees and solitude. Relax poolside or simply languish in your undisturbed quiet courtyard. Close to exclusive shopping and restaurants. This desirable location is only pared by an equally desirable price. Guaranteed to go fast !!!!!
-
2002-02-25$299,950 326-char remark
Show marketing remark (326 chars)
CLICK PHOTO FOR VIEWS. ((NO FREEWAY NOISE)) Secluded private retreat. Escape to a backdrop of trees and solitude. Relax poolside or simply languish in your undisturbed quiet courtyard. Close to exclusive shopping and restaurants. This desirable location is only pared by an equally desirable price. Guaranteed to go fast !!!!!
-
2002-02-14historical
-
2002-02-14historical
-
1999-10-29soldstatus $220,000
-
1999-10-28soldstatus $220,000
-
1999-09-09historical
-
1999-09-09historical
-
1999-04-29$225,000
-
1999-04-06$1,400
-
1999-04-06$1,400
-
1999-01-07$1,000
-
1999-01-07$1,000
-
1999-01-07$1,400
-
1999-01-07historical
-
1999-01-07historical
-
1999-01-07$1,400
-
1988-10-03soldstatus $156,000
-
1987-04-02soldstatus $145,900
ⓘ Source: listings_history table (triggers on properties + properties_extension) + one-shot
backfill from property_details.listing_events for pre-trigger history.
Tax reassessment forecast CA · Resets to sale price
- Current annual tax
- $8,381 · $698/mo
- Projected year-2 tax
- $8,381 · $698/mo
- Expected delta
- $0/yr ($0/mo · 0.0%)
ⓘ Screening estimate from a state-policy table — verify with the county assessor before closing.
Climate risk First Street
- Flood 1/10 Low FEMA zone X (unshaded) · 0% chance over 30 yrs
- Wildfire 1/10 Low
- Heat 4/10 Moderate 7 d/yr ≥86°F today · 19 d/yr by 30 yrs out
- Wind 1/10 Low
- Air quality 4/10 Moderate 4 unhealthy d/yr today · 4 by 30 yrs out
Nearby sold comps map
Loading sold comps map…
Walkable amenities ~0.75 mi
Loading nearby amenities…
Taxation est. · year 1
- Rental income
- $70,103
- − Mortgage interest
- −$53,214
- − Property taxes
- −$8,381
- − Insurance
- −$4,750
- − Repairs & maintenance
- −$5,608
- − Management
- −$5,608
- − HOA
- −$9,276
- − Depreciation
- −$27,636
- Taxable loss
- −$44,370
- Est. tax savings @ 24.0%
- +$10,649
- After-tax cash flow
- $-16,158/yr
For passive investors: Depreciation is non-cash, so a rental often shows a tax loss while cash-flowing — sheltering income. Rental losses are passive: they offset passive income freely, and up to $25,000/yr can offset ordinary (W-2) income if you actively participate and your MAGI is under $100k (phasing out to $0 by $150k); unused losses carry forward. On sale, claimed depreciation is recaptured at up to 25%, and gains may owe capital-gains tax (a 1031 exchange can defer both). Figures are a year-1 estimate at your 24.0% rate — not tax advice; consult a CPA.
Schools (NCES district)
- District
- Solana Beach Elementary
- NCES district ID
- 0636990
- Math proficiency
- 82% ▲ 1.00%
- Reading proficiency
- 86% ▲ 1.00%
- Median HH income
- $113,696
- Composite
- 77.67/100
- National rank
- #152
- State rank
- #23 of 1400 in CA
Livability — Solana Beach
- Score
- 77/100
- State rank
- #81
- US rank
- #3100
Category grades
Schools grade is shown separately in the Schools card above.
Census & demographics
- Census place
- Solana Beach, CA
- County
- San Diego County · 3,178,799 people
- City population
- 11,944
- Metro
- San Diego-Chula Vista-Carlsbad, CA
- Population (ZIP)
- 13,105
- Household income
- $198,823
- Rent vs Own
- Severe rent burden
- 343.0
Population outlook (San Diego County) Hauer SSP2
- Today (2025)
- 3,678,185 people
- By 2030
- 3,856,546 · +4.8%
- By 2040
- 4,171,407 · +13.4%
- By 2050
- 4,421,607 · +20.2%
- By 2075
- 4,831,599 · +31.4%
- By 2100
- 4,832,502 · +31.4%
Race, ethnicity, and origin ACS 2023
- Neighborhood character
- Predominantly White (76%)
- Race & ethnicity
- White 76% Hispanic / Latino 10% Two or more races 9% Asian 6% Black 1%
- Hispanic origin (detail)
- Mexican 6%
- Common ancestry
- Italian 5% Scotch-Irish 4% Romanian 4%
- Foreign-born
- 16% · Canada, China, South Korea
- Languages at home
- 88% English-only · Spanish 4% Other Indo-European 2% Other Asian/Pacific 1%
Political lean MEDSL · San Diego
- 2024 margin
- D (+16.8) · D 56.9% · R 40.1% · Other 2.9%
- 2008→2024 swing
- +6.6pp toward D · 2008: 10.2pp · 2024: 16.8pp
- All cycles
- 2024: D+16.8 2020: D+22.8 2016: D+17.8 2012: D+5.1 2008: D+10.2
Not yet ingested
- Civics
- —
Market trends
- HPI YoY
- ▲ 4.95%
- Current HPI
- 445.7503
- Rent YoY
- ▲ 12.74%
- Metro
- San Diego-Chula Vista-Carlsbad, CA
- State GDP YoY
- ▲ 3.21%
- F500 in state
- 116
Industry mix (Fortune 500 HQ in CA)
| Industry | F500 HQs | Revenue |
|---|---|---|
| Technology | 27 | $1,492B |
|
||
| Financial Services | 3 | $174B |
|
||
| Retail | 3 | $44B |
|
||
| Insurance | 3 | $26B |
|
||
| Media / Entertainment | 2 | $115B |
|
||
| Pharmaceuticals / Biotech | 2 | $62B |
|
||
Price history
+585.4% since first listed25 events — show timeline
- 2026-05-12 Price Changed $999,990 SDMLS
- 2026-04-20 Listed $1,050,000 SDMLS
- 2015-12-28 Sold (Public Records) $480,000 Public Records
- 2006-09-30 Listing Removed — SDMLS
- 2006-01-04 Listed $520,000 SDMLS
- 2002-04-16 Sold (Public Records) $299,000 Public Records
- 2002-04-16 Sold (MLS) $299,000 CRMLS
- 2002-02-25 Listed $299,950 CRMLS
- 2002-02-14 Listing Removed — SDMLS
- 2002-02-14 Listing Removed — CRMLS
- 1999-10-29 Sold (Public Records) $220,000 Public Records
- 1999-10-28 Sold (MLS) $220,000 CRMLS
- 1999-09-09 Listing Removed — SDMLS
- 1999-09-09 Listing Removed — CRMLS
- 1999-04-29 Listed $225,000 CRMLS
- 1999-04-06 Listed $1,400 SDMLS
- 1999-04-06 Listed $1,400 CRMLS
- 1999-01-07 Listed $1,400 SDMLS
- 1999-01-07 Listing Removed — SDMLS
- 1999-01-07 Listing Removed — CRMLS
- 1999-01-07 Listed $1,400 CRMLS
- 1999-01-07 Listed $1,000 SDMLS
- 1999-01-07 Listed $1,000 CRMLS
- 1988-10-03 Sold (Public Records) $156,000 Public Records
- 1987-04-02 Sold (Public Records) $145,900 Public Records
Property tax history
+4.5%/yrLatest (2025): $8,381 · +2.5% YoY. Source: county tax records.
Cash-flow waterfall
monthlySold comps — $/sqft
last 12 mo · ≤1 miLoading sold comps…