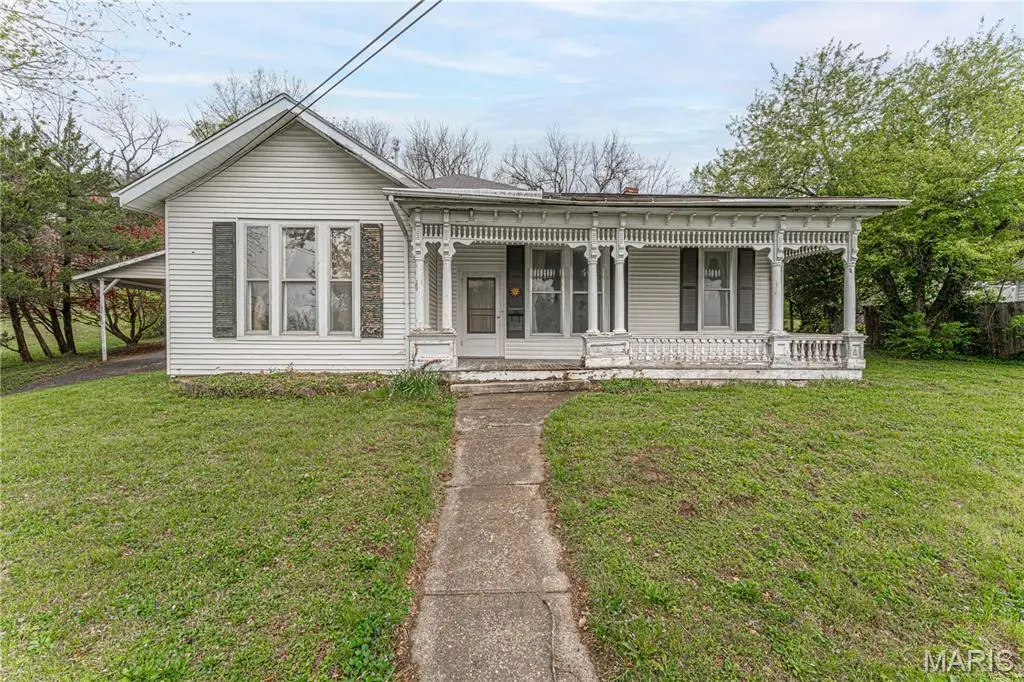
1413 Tennessee St · Louisiana, MO
Flood risk 1/10 · Minimal
- FEMA flood zone
- X (unshaded)
- Chance of flooding over 30 yrs
- 0.0%
- Est. flood insurance / yr
- $473 – $860
Fire risk 1/10 · Minimal
- Est. fire insurance / yr
- $1,054 – $1,958
Heat risk 4/10 · Minor
- Hot days now (above 106°F)
- 7 days/yr
- Hot days in 30 yrs
- 19 days/yr
Wind risk 2/10 · Minimal
- Chance of severe wind over 30 yrs
- 1.0%
Air-quality risk 2/10 · Minimal
- Unhealthy air days now
- 1 days/yr
- Unhealthy air days in 30 yrs
- 2 days/yr
Risk factors via First Street. Map © Google.
Why this score? — see what drove the B- grade
The composite is a weighted blend of 9 inputs, each scored 0–100. Each bar is that input's sub-score; the figure is the points it added to the 100-point composite (weight × sub-score).
- Cash flow +30.0/30.0
- 1% rule +10.0/10.0
- DSCR +10.0/10.0
- ARV discount +7.5/15.0
- Livability +3.6/5.0
- Schools +2.9/10.0
- Rent growth +2.5/5.0
- Condition / age +2.5/5.0
- Appreciation +0.3/10.0
$70,000
🖨 Deal sheet (PDF) 📄 Offer letter ✓ Due diligence
Listing remarks
Investor Opportunity! Don't miss this 3-bedroom, 1-bath home in Louisiana with endless potential. Whether you're looking to add to your rental portfolio, complete your next fix-and-flip project, or find an affordable place to call home, this property offers a great opportunity to build equity. The home is currently vacant and ready for its next chapter, making for a smooth and convenient transition for the new owner. Spacious living areas, a functional layout, and plenty of possibilities await your vision and updates. Some of the features are a triple lot, a birds-eye maple fireplace surround, real wood floors throughout most of the home and over 2,000 SF to enjoy! Schedule your appointment
Key facts
- 0.66 acre lot
- 2 parking spots
- Built 1890
Property features AI
Finance
- Other: Above-grade living area approximately 2,093 (assessor)
- Financial info: Lease not considered
Exterior
- Parking: Two covered carport spaces (total parking for 2)
- Utilities: Public water; Public sewer; Electric service by Ameren; Electricity, water, and sewer available
- Home design: Single family residence; Residential property; One story; Entry facing front
- Construction: Frame construction
- Exterior features: Covered front porch; Level lot with few trees and front yard
Interior
- Bedrooms: Three bedrooms on the main level
- Bathrooms: One full bathroom on the main level
- Heating & cooling: Forced air heating; Central air conditioning
- Interior features: One-level living; Basement with block construction and other features; Dining room fireplace (1)
Neighborhood map
What this means for you Summary
Snapshot
- This is a 3-bed/1.0-bath other listed at $70k.
Deal economics
- At list price, monthly cash flow is $493 ($6k/yr) — positive.
- The deal already cash-flows at list — no discount required.
- Meets the 1% rule at list price ($1k rent vs $70k).
- Recommended offer: $69k (1.5% below list) — sets the bar for market timing.
- Cap rate 14.7% vs local median 8.4% in Louisiana — top-decile yield for the area; either an underpriced asset or a hidden risk that comps aren't pricing in. Stress-test before assuming the spread holds.
Location & tenants
- Location reads 71/100 on livability (#105 in MO) — a middle-class / working-renter tenant base. Strengths: cost of living A+, housing A+, crime A; Watch: amenities F, commute F, employment D-.
- Louisiana R-II (town): math 31% / reading 39% proficiency, ranked #227 of 324 in MO (top 70%) — families likely to look elsewhere, expect single-tenant / working-renter base with shorter leases.
- Zoned schools: Louisiana Elem. (math 27% / reading 37%, grade F, #761 of 1,115 statewide, top 72%, 322 students, 74% FRL); Louisiana High (math 17% / reading 44%, grade F, #373 of 521 statewide, top 72%, 226 students, 62% FRL).
- Market conditions: 32 active listings in the ZIP; 1 comparable units currently listed for rent nearby; 38 units permitted in Pike County in 2024 (0 in 5+ unit buildings).
Forward outlook
- Local home prices are declining (-3.0%/yr); year-one equity from $484 of loan paydown is wiped out by about $2k of value loss. Plan a longer hold.
- Pike County population projected to shrink 7% by 2050 — rents likely to lag national; underwrite the cash flow, not the appreciation.
- At projected returns (-3.0% appreciation + 3.0% rent growth), your $20k cash investment doubles in ~4 years — after that, you're playing with house money.
Negotiation context
- It's been on market 17 days — a 2% lower offer ($69k) is reasonable based on typical stale-listing flexibility.
- 2 sale attempts; this cycle's ask has dropped $25k (26%) from the opening price — seller is motivated, your offer sets the floor, not the list.
Risks & watch-outs
- Watch-outs: built in 1890 — expect roof / HVAC / electrical / plumbing capex.
Questions for the listing agent
- Built in 1890 — when were the roof, HVAC, electrical panel, plumbing, and water heater last replaced?
- Is there a deadline driving the sale (1031 exchange, divorce, estate, relocation)? That informs how much negotiation room exists.
- Schools are D-rated, which usually means shorter tenancies and higher turnover. Who's the typical renter profile here, and what's been the actual vacancy rate?
- What's the average days-on-market for RENTAL listings here right now (not sales)? A rising rental-DOM trend means longer vacancies and softer asking-rent achievability than the comps imply.
- What's the recent tenant-quality profile in this submarket — average credit score on applications, eviction rate, late-payment / NSF rate, and stable-employment percentage? A property-management company in the area should have these aggregated.
- How much new for-sale + rental construction is in the pipeline within 1–3 miles? Heavy new supply typically softens prices + rents 12–24 months out; constrained supply supports both.
Investment metrics
- 1% rule
- 1.71% ✓
- Cap rate
- 14.74%
- Cash-on-cash
- 30.16%
- DSCR
- 2.34
- GRM
- 4.9
CMA / ARV
No comps found within radius.
Projected returns pro-forma
-3.0% appreciation · 3.0% rent growth · sell at horizon
- IRR
- 24.8%
- Equity multiple
- 2.02×
- Total profit
- $20,032
- Equity at exit
- $10,437
- IRR
- 32.6%
- Equity multiple
- 3.95×
- Total profit
- $57,846
- Equity at exit
- $6,052
Cash invested: $19,600 (down + closing). Projections, not guarantees.
Landlord ↔ Tenant lean methodology
- Overall (STATE)
- 81 Strongly Landlord-Friendly
- State Missouri
- 81 Strongly Landlord-Friendly · R+10
- County
- — inherits STATE
- City
- — inherits STATE
ZIP-level market 63353
- Home prices YoY
- -5.0%
- Active inventory
- 32
- Price-to-rent
- 4.9×
Monthly cashflow live
- Estimated rent
- $1,200 medium interval (Pro) →
- Mortgage (P&I)
- −$367
- Tax from tax record
- −$59 /mo · $710/yr
- Insurance
- −$29
- HOA
- −$0
- Vacancy / Maint / Mgmt
- −$252
- Net cashflow
- $493
Break-even live
Sensitivity live
| Price | -10% $532 | -5% $512 | +0% $493 | +5% $473 | +10% $453 |
|---|---|---|---|---|---|
| Rent | -10% $398 | -5% $445 | +0% $493 | +5% $540 | +10% $587 |
| Rate | -1.0pp $528 | -0.5pp $510 | base $493 | +0.5pp $474 | +1.0pp $456 |
UW: 25.0% down · 7.5% · 30yr · 1.5% tax · 5.0% vac · 8.0% maint · 8.0% mgmt
Financing live
Cash to close
- Down payment
- $17,500
- Closing costs
- $2,100
- Reserves months
- —
- Total cash needed
- —
Loan-product check · same deal, 3 products live
Conventional
25% down · 7.5% · 30yr
- Down + closing
- —
- Monthly P&I
- —
- Monthly cashflow
- —
- DSCR
- —
- Eligible?
- —
Personal DTI + credit; lowest rate.
DSCR
20% down · 8.5% · 30yr
- Down + closing
- —
- Monthly P&I
- —
- Monthly cashflow
- —
- DSCR
- —
- Eligible?
- —
No personal income docs; deal must DSCR.
Hard money
10% down · 12.0% · 12mo
- Down + closing
- —
- Monthly P&I
- —
- Monthly cashflow
- —
- DSCR
- —
- Eligible?
- —
Short-term bridge; refi at stabilization.
Rent comps 1 comps
| Address | Beds | Baths | Sqft | Rent | $/sqft | DOM | Units | Dist |
|---|---|---|---|---|---|---|---|---|
| 500 Frankford Rd Louisiana, MO | 3.0 | 1.0 | 1481 | $1,200 | $0.81 | 44d | 1 | 0.62mi |
Listing history 15 events
-
2026-06-21days on market $70,000 Active 17 DOM
-
2026-06-18days on market $70,000 Active 15 DOM
-
2026-06-17days on market $70,000 Active 14 DOM
-
2026-06-16days on market $70,000 Active 13 DOM
-
2026-06-15days on market $70,000 Active 12 DOM
-
2026-06-13days on market $70,000 Active 10 DOM
-
2026-06-12days on market $70,000 Active 9 DOM
-
2026-06-09days on market $70,000 Active 6 DOM
-
2026-06-08days on market $70,000 Active 5 DOM
-
2026-06-07days on market $70,000 Active 4 DOM
-
2026-06-07days on market $70,000 Active 3 DOM
-
2026-06-04remarks 699-char remark
-
2026-06-04status $70,000 Active 1 DOM
-
2026-06-03remarks 693-char remark
-
2026-06-03$70,000 Coming Soon 1 DOM
ⓘ Source: listings_history table (triggers on properties + properties_extension) + one-shot
backfill from property_details.listing_events for pre-trigger history.
Tax reassessment forecast MO · Resets to sale price
- Current annual tax
- $710 · $59/mo
- Projected year-2 tax
- $710 · $59/mo
- Expected delta
- $0/yr ($0/mo · 0.0%)
ⓘ Screening estimate from a state-policy table — verify with the county assessor before closing.
Climate risk First Street
- Flood 1/10 Low FEMA zone X (unshaded) · 0% chance over 30 yrs
- Wildfire 1/10 Low
- Heat 4/10 Moderate 7 d/yr ≥106°F today · 19 d/yr by 30 yrs out
- Wind 2/10 Low 100% chance of damaging wind over 30 yrs
- Air quality 2/10 Low 1 unhealthy d/yr today · 2 by 30 yrs out
Nearby sold comps map
Loading sold comps map…
Walkable amenities ~0.75 mi
Loading nearby amenities…
Taxation est. · year 1
- Rental income
- $14,400
- − Mortgage interest
- −$3,921
- − Property taxes
- −$710
- − Insurance
- −$350
- − Repairs & maintenance
- −$1,152
- − Management
- −$1,152
- − Depreciation
- −$2,036
- Taxable income
- $5,079
- Est. tax owed @ 24.0%
- −$1,219
- After-tax cash flow
- $4,692/yr
For passive investors: Depreciation is non-cash, so a rental often shows a tax loss while cash-flowing — sheltering income. Rental losses are passive: they offset passive income freely, and up to $25,000/yr can offset ordinary (W-2) income if you actively participate and your MAGI is under $100k (phasing out to $0 by $150k); unused losses carry forward. On sale, claimed depreciation is recaptured at up to 25%, and gains may owe capital-gains tax (a 1031 exchange can defer both). Figures are a year-1 estimate at your 24.0% rate — not tax advice; consult a CPA.
Schools (NCES district)
- District
- Louisiana R-II
- NCES district ID
- 2919260
- Math proficiency
- 31% ▲ 1.00%
- Reading proficiency
- 39% ▬ 0.00%
- Median HH income
- $37,149
- Composite
- 29.1/100
- National rank
- #6595
- State rank
- #227 of 324 in MO
Livability — Louisiana
- Score
- 71/100
- State rank
- #105
- US rank
- #6899
Category grades
Schools grade is shown separately in the Schools card above.
Census & demographics
- Census place
- Louisiana, MO
- Population (ZIP)
- 4,935
Population outlook (Pike County) Hauer SSP2
- Today (2025)
- 17,895 people
- By 2030
- 17,591 · -1.7%
- By 2040
- 17,080 · -4.6%
- By 2050
- 16,589 · -7.3%
- By 2075
- 14,761 · -17.5%
- By 2100
- 11,606 · -35.1%
Race, ethnicity, and origin ACS 2023
- Neighborhood character
- Predominantly White (90%)
- Race & ethnicity
- White 90% Two or more races 6% Hispanic / Latino 3% Black 2%
- Common ancestry
- Romanian 3% Iranian 2% Lithuanian 1%
- Foreign-born
- 1% · Canada, China
- Languages at home
- 96% English-only · Spanish 3%
Political lean MEDSL · Pike
- 2024 margin
- Solid R (+57.9) · D 20.7% · R 78.6%
- 2008→2024 swing
- -48.0pp toward R · 2008: -9.9pp · 2024: -57.9pp
- All cycles
- 2024: R+57.9 2020: R+53.9 2016: R+47.0 2012: R+27.3 2008: R+9.9
Not yet ingested
- Civics
- —
Market trends
- HPI YoY
- ▼ -9.40%
- Current HPI
- 180.6084
- Rent YoY
- —
- Metro
- —
- State GDP YoY
- ▲ 1.84%
- F500 in state
- 20
Industry mix (Fortune 500 HQ in MO)
| Industry | F500 HQs | Revenue |
|---|---|---|
| Healthcare | 1 | $163B |
|
||
| Insurance | 1 | $21B |
|
||
| Industrial Technology | 1 | $17B |
|
||
| Retail | 1 | $16B |
|
||
| Industrial Distribution | 1 | $10B |
|
||
| Utilities | 1 | $9B |
|
||
Price history
+0.0% since first listed8 events — show timeline
- 2026-06-02 Coming Soon $70,000 MARIS as Distributed by MLS Grid
- 2025-09-03 Price Changed $65,000 MARIS as Distributed by MLS Grid
- 2025-08-19 Price Changed $75,000 MARIS as Distributed by MLS Grid
- 2025-07-26 Relisted — MARIS as Distributed by MLS Grid
- 2025-06-23 Pending — MARIS as Distributed by MLS Grid
- 2025-04-11 Listed $95,000 MARIS as Distributed by MLS Grid
- 2010-02-01 Sold (Public Records) $70,000 Public Records
- 1956-03-01 Sold (Public Records) — Public Records
Property tax history
+1.5%/yrLatest (2025): $710 · +0.1% YoY. Source: county tax records.
Cash-flow waterfall
monthlySold comps — $/sqft
last 12 mo · ≤1 miLoading sold comps…