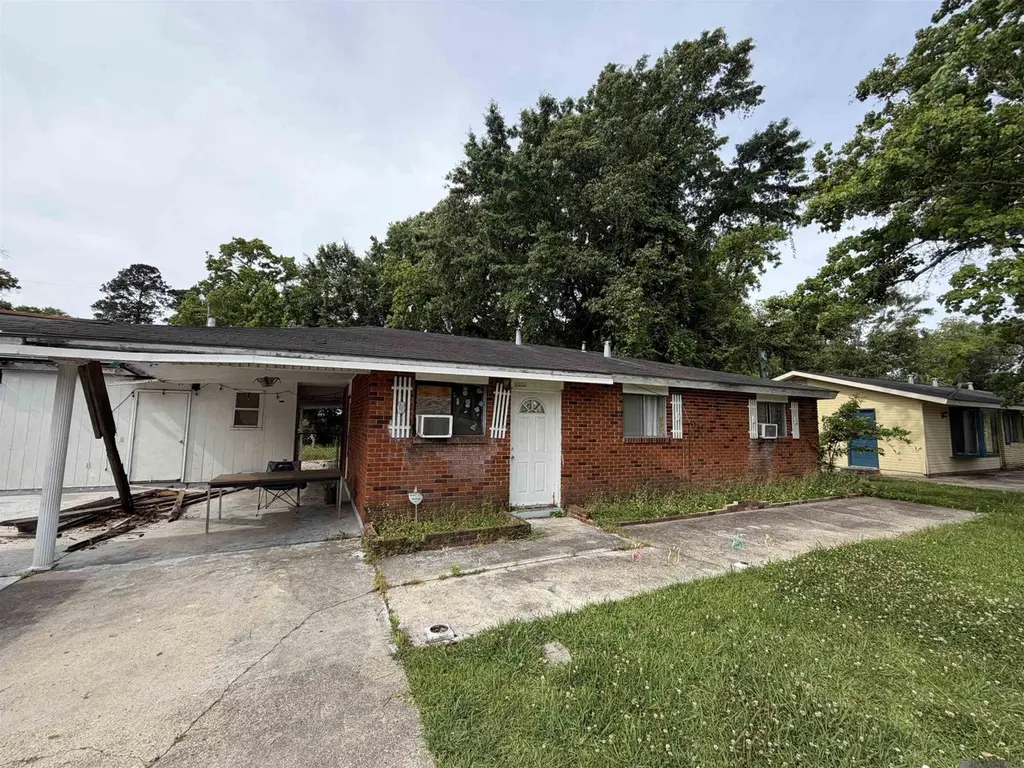
6006 Groom Rd · Baker, LA
Flood risk 1/10 · Minimal
- FEMA flood zone
- X (unshaded)
- Chance of flooding over 30 yrs
- 0.0%
- Est. flood insurance / yr
- $507 – $1,088
Fire risk 1/10 · Minimal
- Est. fire insurance / yr
- $1,269 – $2,357
Heat risk 8/10 · Major
- Hot days now (above 108°F)
- 7 days/yr
- Hot days in 30 yrs
- 21 days/yr
Wind risk 9/10 · Severe
- Chance of severe wind over 30 yrs
- 99.0%
Air-quality risk 3/10 · Minor
- Unhealthy air days now
- 2 days/yr
- Unhealthy air days in 30 yrs
- 3 days/yr
Risk factors via First Street. Map © Google.
Why this score? — see what drove the B- grade
The composite is a weighted blend of 9 inputs, each scored 0–100. Each bar is that input's sub-score; the figure is the points it added to the 100-point composite (weight × sub-score).
- Cash flow +30.0/30.0
- DSCR +10.0/10.0
- 1% rule +8.7/10.0
- ARV discount +7.5/15.0
- Livability +3.3/5.0
- Rent growth +2.5/5.0
- Condition / age +2.5/5.0
- Schools +0.9/10.0
- Appreciation +0.0/10.0
$75,000
🖨 Deal sheet 📄 Offer letter ✓ Due diligence
Listing remarks MLS
3-bedroom, 1-bath home conveniently located on Groom Road with easy access to nearby amenities. This property offers great potential and is ready for the right buyer to bring it back to life. Ideal investment opportunity for those looking to renovate and add value. Property is being sold as a short sale. Property being sold "As Is", no repairs will be made.
Key facts
- 0.25 acre lot
- 4 parking spots
- Built 1960
Property features AI
Exterior
- Parking: 4 parking spaces
- Utilities: Public water; Public sewer
- Home design: Single-family detached residence; Single-story
- Construction: Slab foundation
- Exterior features: Vinyl siding and brick exterior; Lot roughly 75 x 140 (0.25 acre)
Interior
- Bathrooms: 1 full bathroom
- Heating & cooling: Window unit cooling; Space heater for heating
- Interior features: Window cooling units; Space heater
Neighborhood map
What this means for you Summary
Snapshot
- This is a 3-bed/1.0-bath single-family listed at $75k.
Deal economics
- At list price, monthly cash flow is $287 ($3k/yr) — positive.
- The deal already cash-flows at list — no discount required.
- Meets the 1% rule at list price ($1k rent vs $75k).
- Recommended offer: $73k (3.0% below list) — sets the bar for market timing.
- Cap rate 10.9% vs local median 4.5% in Baker — top-decile yield for the area; either an underpriced asset or a hidden risk that comps aren't pricing in. Stress-test before assuming the spread holds.
Location & tenants
- Location reads 66/100 on livability (#131 in LA) — a middle-class / working-renter tenant base. Strengths: cost of living A+, housing A; Watch: schools C-, crime D+, amenities F.
- City Of Baker School District (suburban): math 5% / reading 15% proficiency, ranked #89 of 98 in LA (top 91%) — low school quality limits family demand, transient renter base, plan for 1-2y turnover; 82% free/reduced lunch — lower-income household profile, screen leases tightly.
- Market conditions: 141 active listings in the ZIP; 10 comparable units currently listed for rent nearby; rentals at typical pace (median 14d on market — plan ~3-4 weeks tenant-placement turnaround); 2,252 units permitted in East Baton Rouge Parish in 2024 (440 in 5+ unit buildings).
Forward outlook
- Local home prices are declining (-3.0%/yr); year-one equity from $519 of loan paydown is wiped out by about $2k of value loss. Plan a longer hold.
- East Baton Rouge County population projected at +4% by 2050 — modest demand growth; plan on rents tracking national, not racing it.
- At projected returns (-3.0% appreciation + 3.0% rent growth), your $21k cash investment doubles in ~8 years — after that, you're playing with house money.
Negotiation context
- It's been on market 56 days — a 3% lower offer ($73k) is reasonable based on typical stale-listing flexibility.
- 16 sale attempts since 28y ago with the ask held roughly flat each time — persistent listings suggest the price (not the market) is what's stuck; bring a comps-based counter.
Risks & watch-outs
- Climate carrying-cost: severe wind risk, 99% chance of damaging wind over 30y; extreme-heat days projected 7→21/yr by 2055 (HVAC capex compounding) — expect insurance premiums to compound above CPI over the hold.
Questions for the listing agent
- It's been on market 56 days. Have you received any prior offers? Is the seller open to a 3% concession, seller financing, or rate buy-down credit?
- Built in 1960 — when were the roof, HVAC, electrical panel, plumbing, and water heater last replaced?
- Is there a deadline driving the sale (1031 exchange, divorce, estate, relocation)? That informs how much negotiation room exists.
- Crime grade is D in this area — have there been break-ins, vandalism, or insurance claims at this property in the last 3 years? What carrier currently insures it and at what premium?
- What's the average days-on-market for RENTAL listings here right now (not sales)? A rising rental-DOM trend means longer vacancies and softer asking-rent achievability than the comps imply.
- What's the recent tenant-quality profile in this submarket — average credit score on applications, eviction rate, late-payment / NSF rate, and stable-employment percentage? A property-management company in the area should have these aggregated.
- How much new for-sale + rental construction is in the pipeline within 1–3 miles? Heavy new supply typically softens prices + rents 12–24 months out; constrained supply supports both.
Investment metrics
- 1% rule
- 1.37% ✓
- Cap rate
- 10.89%
- Cash-on-cash
- 16.42%
- DSCR
- 1.73
- GRM
- 6.1
CMA / ARV
- ARV (on-the-fly)
- $155,100
- Comps found
- 4
Show comp detail 4 sales within ~0.75 mi
| Address | Dist | Beds/Ba | Sqft | Sold | Price | $/sf | Match |
|---|---|---|---|---|---|---|---|
| 6204 Molino Dr | 0.29mi | 3/1.5 | 1,054 (+2%) | 7mo | $60,000 | $57 | 75 |
| 6408 E Myrtle Ave | 0.40mi | 3/1.5 | 1,089 (+5%) | 17mo | $165,500 | $152 | 56 |
| 1265 Dr Mlk Jr Ln | 0.45mi | 3/2.0 | 1,144 (+11%) | 21mo | $172,000 | $150 | 40 |
| 2124 Toledo St | 0.74mi | 2/1.5 (-1) | 1,161 (+12%) | 19mo | $124,900 | $108 | 22 |
Match score weights: distance 35% · size 25% · config 20% · recency 20%. Top-matched comps best support the ARV.
Projected returns pro-forma
-3.0% appreciation · 3.0% rent growth · sell at horizon
- IRR
- 7.5%
- Equity multiple
- 1.29×
- Total profit
- $6,163
- Equity at exit
- $11,183
- IRR
- 16.8%
- Equity multiple
- 2.38×
- Total profit
- $29,005
- Equity at exit
- $6,485
Cash invested: $21,000 (down + closing). Projections, not guarantees.
Landlord ↔ Tenant lean methodology
- Overall (STATE)
- 90 Strongly Landlord-Friendly
- State Louisiana
- 90 Strongly Landlord-Friendly · R+12
- County
- — inherits STATE
- City
- — inherits STATE
ZIP-level market 70714
- Home prices YoY
- -33.7%
- Active inventory
- 141
- Price-to-rent
- 6.1×
Monthly cashflow live
- Estimated rent
- $1,027 high interval (Pro) →
- Mortgage (P&I)
- −$393
- Tax from tax record
- −$99 /mo · $1,191/yr
- Insurance
- −$31
- HOA
- −$0
- Vacancy / Maint / Mgmt
- −$216
- Net cashflow
- $287
Break-even live
UW: 25.0% down · 7.5% · 30yr · 1.5% tax · 5.0% vac · 8.0% maint · 8.0% mgmt
Financing live
Cash to close
- Down payment
- $18,750
- Closing costs
- $2,250
- Reserves months
- —
- Total cash needed
- —
Loan-product check · same deal, 3 products live
Conventional
25% down · 7.5% · 30yr
- Down + closing
- —
- Monthly P&I
- —
- Monthly cashflow
- —
- DSCR
- —
- Eligible?
- —
Personal DTI + credit; lowest rate.
DSCR
20% down · 8.5% · 30yr
- Down + closing
- —
- Monthly P&I
- —
- Monthly cashflow
- —
- DSCR
- —
- Eligible?
- —
No personal income docs; deal must DSCR.
Hard money
10% down · 12.0% · 12mo
- Down + closing
- —
- Monthly P&I
- —
- Monthly cashflow
- —
- DSCR
- —
- Eligible?
- —
Short-term bridge; refi at stabilization.
Rent comps 10 comps
| Address | Beds | Baths | Sqft | Rent | $/sqft | DOM | Units | Dist |
|---|---|---|---|---|---|---|---|---|
| 5245 Kimberlin Dr Apt C Baker, LA | 2.0 | 2.0 | 850 | $850 | $1.00 | 14d | 1 | 0.51mi |
| 5350 Groom Rd Baker, LA | 1.0–2.0 | 1.0–2.0 | 768 | $961 | $1.25 | 14d | 7 | 0.53mi |
| 1110 Shilo St Apt D Baker, LA | 2.0 | 2.0 | 850 | $850 | $1.00 | 14d | 1 | 0.56mi |
| 1007 Shilo St Apt C Baker, LA | 2.0 | 1.0 | 800 | $800 | $1.00 | 14d | 1 | 0.58mi |
| 1120 Sherron Ave Unit 4 Baker, LA | 2.0 | 1.0 | 850 | $850 | $1.00 | 14d | 1 | 0.78mi |
| 1011 Seville Ave Clinton, LA | 3.0 | 2.0 | 1008 | $1,150 | $1.14 | 14d | 1 | 0.94mi |
| 1013 Seville Unit B Baker, LA | 3.0 | 2.0 | 1008 | $1,150 | $1.14 | 14d | 1 | 0.95mi |
| 5159 Baker Blvd Unit B Baker, LA | 2.0 | 1.0 | 700 | $825 | $1.18 | 14d | 1 | 1.10mi |
| 5071 Baker Blvd Unit A Baker, LA | 3.0 | 1.0 | 900 | $950 | $1.06 | 43d | 1 | 1.12mi |
| 13191 Sunshine Rd Baton Rouge, LA | 2.0 | 1.0 | 900 | $850 | $0.94 | 14d | 1 | 1.25mi |
Listing history 36 events
-
2026-06-18days on market $75,000 Active 56 DOM
-
2026-06-17days on market $75,000 Active 55 DOM
-
2026-06-16days on market $75,000 Active 54 DOM
-
2026-06-15days on market $75,000 Active 53 DOM
-
2026-06-14days on market $75,000 Active 51 DOM
-
2026-06-13days on market $75,000 Active 50 DOM
-
2026-06-10days on market $75,000 Active 48 DOM
-
2026-06-09days on market $75,000 Active 47 DOM
-
2026-06-08days on market $75,000 Active 46 DOM
-
2026-06-07days on market $75,000 Active 45 DOM
-
2026-06-03days on market $75,000 Active 41 DOM
-
2026-06-02days on market $75,000 Active 40 DOM
-
2026-06-01days on market $75,000 Active 39 DOM
-
2026-05-31days on market $75,000 Active 38 DOM
-
2026-05-31days on market $75,000 Active 37 DOM
-
2026-04-23$75,000 Active
Show marketing remark (369 chars)
3-bedroom, 1-bath home conveniently located on Groom Road with easy access to nearby amenities. This property offers great potential and is ready for the right buyer to bring it back to life. Ideal investment opportunity for those looking to renovate and add value. Property is being sold as a short sale. Property being sold "As Is", no repairs will be made.
-
2026-04-23$75,000 Active 369-char remark
Show marketing remark (369 chars)
3-bedroom, 1-bath home conveniently located on Groom Road with easy access to nearby amenities. This property offers great potential and is ready for the right buyer to bring it back to life. Ideal investment opportunity for those looking to renovate and add value. Property is being sold as a short sale. Property being sold "As Is", no repairs will be made.
-
2008-03-12soldstatus $100,000
-
2008-03-11soldstatus
-
2007-12-27$100,000
-
2007-12-27$100,000
-
2007-10-25$102,000
-
2007-10-25$102,000
-
2007-08-29$105,000
-
2007-08-29$105,000
-
2004-10-11$86,000
-
2004-10-11$86,000
-
2004-04-01$79,900
-
2004-04-01$79,900
-
1998-11-02soldstatus
-
1998-10-30soldstatus
-
1998-10-30soldstatus
-
1998-03-03$64,900
-
1998-03-03$64,900
-
1998-03-03$64,900
-
1998-03-03$64,900
ⓘ Source: listings_history table (triggers on properties + properties_extension) + one-shot
backfill from property_details.listing_events for pre-trigger history.
Tax reassessment forecast LA · Resets to sale price
- Current annual tax
- $1,191 · $99/mo
- Projected year-2 tax
- $1,191 · $99/mo
- Expected delta
- $0/yr ($0/mo · 0.0%)
ⓘ Screening estimate from a state-policy table — verify with the county assessor before closing.
Climate risk First Street
- Flood 1/10 Low FEMA zone X (unshaded) · 0% chance over 30 yrs
- Wildfire 1/10 Low
- Heat 8/10 Severe 7 d/yr ≥108°F today · 21 d/yr by 30 yrs out
- Wind 9/10 Extreme 99% chance of damaging wind over 30 yrs
- Air quality 3/10 Moderate 2 unhealthy d/yr today · 3 by 30 yrs out
Nearby sold comps map
Loading sold comps map…
Walkable amenities ~0.75 mi
Loading nearby amenities…
Taxation est. · year 1
- Rental income
- $12,320
- − Mortgage interest
- −$4,201
- − Property taxes
- −$1,191
- − Insurance
- −$375
- − Repairs & maintenance
- −$986
- − Management
- −$986
- − Depreciation
- −$2,182
- Taxable income
- $2,400
- Est. tax owed @ 24.0%
- −$576
- After-tax cash flow
- $2,871/yr
For passive investors: Depreciation is non-cash, so a rental often shows a tax loss while cash-flowing — sheltering income. Rental losses are passive: they offset passive income freely, and up to $25,000/yr can offset ordinary (W-2) income if you actively participate and your MAGI is under $100k (phasing out to $0 by $150k); unused losses carry forward. On sale, claimed depreciation is recaptured at up to 25%, and gains may owe capital-gains tax (a 1031 exchange can defer both). Figures are a year-1 estimate at your 24.0% rate — not tax advice; consult a CPA.
Schools (NCES district)
- District
- City Of Baker School District
- NCES district ID
- 2200040
- Math proficiency
- 5% ▼ -32.00%
- Reading proficiency
- 15% ▼ -28.00%
- Median HH income
- $41,765
- Composite
- 8.8/100
- National rank
- #9891
- State rank
- #89 of 98 in LA
Livability — Baker
- Score
- 66/100
- State rank
- #131
- US rank
- #12021
Category grades
Schools grade is shown separately in the Schools card above.
Census & demographics
- Census place
- Baker, LA
- County
- East Baton Rouge Parish · 399,686 people
- City population
- 17,433
- Metro
- Baton Rouge, LA
- Population (ZIP)
- 17,433
- Household income
- $57,608
- Rent vs Own
- Severe rent burden
- 417.0
Population outlook (East Baton Rouge County) Hauer SSP2
- Today (2025)
- 464,810 people
- By 2030
- 472,137 · +1.6%
- By 2040
- 480,243 · +3.3%
- By 2050
- 484,422 · +4.2%
- By 2075
- 492,069 · +5.9%
- By 2100
- 476,347 · +2.5%
Race, ethnicity, and origin ACS 2023
- Neighborhood character
- Predominantly Black (70%)
- Race & ethnicity
- Black 70% White 25% Two or more races 4% Hispanic / Latino 2%
- Common ancestry
- Lithuanian 4%
- Foreign-born
- 1% · Canada
- Languages at home
- 98% English-only · Arabic 1%
Political lean MEDSL · East Baton Rouge
- 2024 margin
- D (+11.1) · D 54.5% · R 43.4% · Other 2.1%
- 2008→2024 swing
- +8.9pp toward D · 2008: 2.2pp · 2024: 11.1pp
- All cycles
- 2024: D+11.1 2020: D+13.1 2016: D+9.2 2012: D+5.2 2008: D+2.2
Not yet ingested
- Civics
- —
Market trends
- HPI YoY
- ▼ -80.50%
- Current HPI
- 158.1876
- Rent YoY
- —
- Metro
- Baton Rouge, LA
- State GDP YoY
- ▲ 3.29%
- F500 in state
- 10
Industry mix (Fortune 500 HQ in LA)
| Industry | F500 HQs | Revenue |
|---|---|---|
| Telecommunications | 2 | $23B |
|
||
| Utilities | 1 | $12B |
|
||
| Wholesale / Distribution | 1 | $5B |
|
||
| Advertising | 1 | $2B |
|
||
Price history
+15.6% since first listed21 events — show timeline
- 2026-04-23 Listed $75,000 AcadianaMLS
- 2026-04-23 Listed $75,000 GBRMLS
- 2008-03-12 Sold (Public Records) $100,000 Public Records
- 2008-03-11 Sold (MLS) — GBRMLS
- 2007-12-27 Listed $100,000 GBRMLS
- 2007-12-27 Listed $100,000 AcadianaMLS
- 2007-10-25 Listed $102,000 AcadianaMLS
- 2007-10-25 Listed $102,000 GBRMLS
- 2007-08-29 Listed $105,000 AcadianaMLS
- 2007-08-29 Listed $105,000 GBRMLS
- 2004-10-11 Listed $86,000 AcadianaMLS
- 2004-10-11 Listed $86,000 GBRMLS
- 2004-04-01 Listed $79,900 AcadianaMLS
- 2004-04-01 Listed $79,900 GBRMLS
- 1998-11-02 Sold (Public Records) — Public Records
- 1998-10-30 Sold (MLS) — GBRMLS
- 1998-10-30 Sold (MLS) — GBRMLS
- 1998-03-03 Listed $64,900 AcadianaMLS
- 1998-03-03 Listed $64,900 GBRMLS
- 1998-03-03 Listed $64,900 AcadianaMLS
- 1998-03-03 Listed $64,900 GBRMLS
Property tax history
+12.5%/yrLatest (2025): $1,191 · +3.8% YoY. Source: county tax records.
Cash-flow waterfall
monthlySold comps — $/sqft
last 12 mo · ≤1 miLoading sold comps…