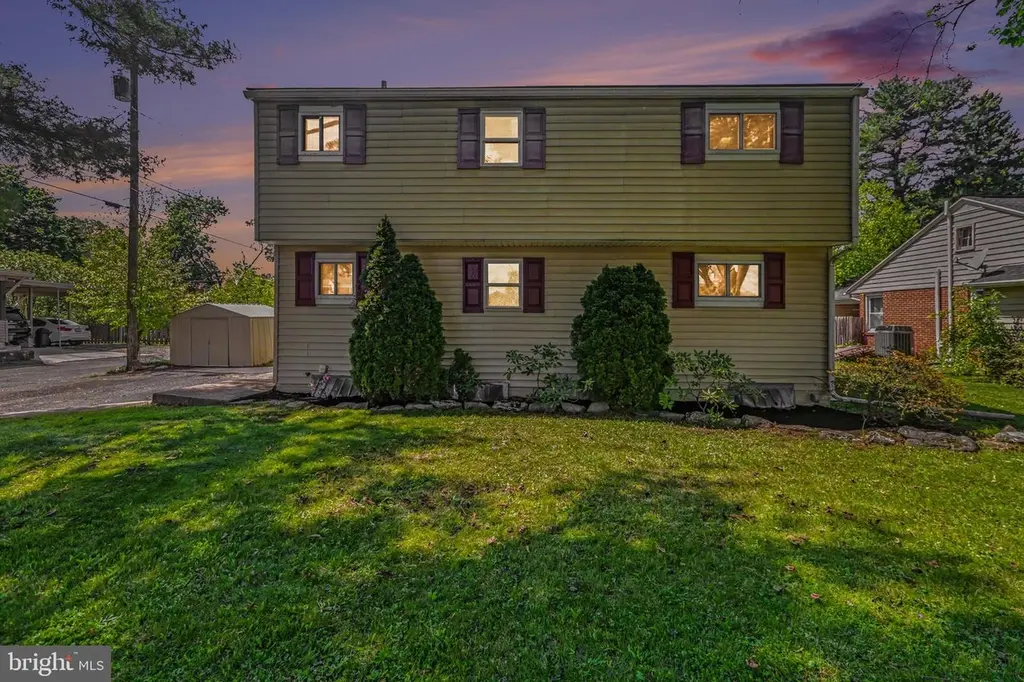
140 Glendale St · Carlisle, PA
Flood risk 6/10 · Moderate
- FEMA flood zone
- X (unshaded)
- Chance of flooding over 30 yrs
- 0.74%
- Est. flood insurance / yr
- $507 – $1,088
Fire risk 1/10 · Minimal
- Est. fire insurance / yr
- $511 – $949
Heat risk 5/10 · Moderate
- Hot days now (above 101°F)
- 7 days/yr
- Hot days in 30 yrs
- 15 days/yr
Wind risk 2/10 · Minimal
- Chance of severe wind over 30 yrs
- 4.0%
Air-quality risk 2/10 · Minimal
- Unhealthy air days now
- 1 days/yr
- Unhealthy air days in 30 yrs
- 3 days/yr
Risk factors via First Street. Map © Google.
Why this score? — see what drove the D grade
The composite is a weighted blend of 9 inputs, each scored 0–100. Each bar is that input's sub-score; the figure is the points it added to the 100-point composite (weight × sub-score).
- ARV discount +15.0/15.0
- Cash flow +9.0/30.0
- Livability +3.9/5.0
- Schools +3.8/10.0
- Rent growth +3.1/5.0
- 1% rule +3.0/10.0
- DSCR +2.5/10.0
- Condition / age +2.5/5.0
- Appreciation +0.0/10.0
$200,000
🖨 Deal sheet (PDF) 📄 Offer letter ✓ Due diligence
Listing remarks MLS
THIS SALTBOX IS WAITING FOR A NEW OWNER TO SPRUCE IT UP AND MAKE IT A GREAT HOME AGAIN. FENCED YARD, 2 SHEDS, 2 FIREPLACES. BANK OWNED - CALL FOR SPECIAL ADDENDUMS. AS IS SALE.
Key facts
- 0.28 acre lot
- Built 1950
- Listed 3 days
Property features AI
Exterior
- Parking: Off-street parking; Driveway
- Utilities: Public water; Public sewer; Electric service
- Home design: Detached single-family home; Asphalt/fiberglass roof; Permanent foundation; Above-grade living space finished (approximately 1,600 finished area)
- Construction: Frame construction; Shingle siding; Built year source: Assessor
- Exterior features: Detached structure; Shingle siding; Screened porch; Not in a federal flood zone; 2+ access exits
Interior
- Kitchen: Kitchen
- Bedrooms: One bedroom on the main level; One bedroom on the first upper level; Master bedroom
- Bathrooms: One full bathroom on the main level; One full bathroom on the first upper level; Two full bathrooms total
- Heating & cooling: Forced air heating (electric); Central air conditioning; Ceiling fans; Electric hot water
- Interior features: Living room; Foyer; Recreation room; Bonus room; Screened porch; Two fireplaces; Fully finished basement with poured concrete foundation; Estimated living area
- Laundry & utility: Utility room
Neighborhood map
What this means for you Summary
Snapshot
- This is a 2-bed/1.5-bath single-family listed at $200k.
Deal economics
- At list price, monthly cash flow is $-157 ($-2k/yr) — negative.
- To cash-flow at today's rent, offer at most $172k (13.9% below list).
- To meet the 1% rule (rent ≥ 1% of price), the offer needs to be $161k (19.6% below list).
- Recommended offer: $161k (19.6% below list) — sets the bar for 1% rule.
- Cap rate 5.3% vs local median 3.7% in Carlisle — top-decile yield for the area; either an underpriced asset or a hidden risk that comps aren't pricing in. Stress-test before assuming the spread holds.
Location & tenants
- Location reads 78/100 on livability (#297 in PA, #2,632 nationally) — a middle-class / working-renter tenant base. Strengths: cost of living A+, housing A+, health & safety A+; Watch: employment C-, amenities D, commute F.
- Carlisle Area SD (urban): math 33% / reading 55% proficiency, ranked #277 of 539 in PA (top 51%) — families likely to look elsewhere, expect single-tenant / working-renter base with shorter leases.
- Zoned schools: Mooreland El Sch (math 52% / reading 72%, grade B, #313 of 1,518 statewide, top 24%, 368 students, 52% FRL); Lamberton Ms (math 25% / reading 56%, grade F, #248 of 512 statewide, top 50%, 543 students, 43% FRL); Carlisle Area Hs (math 70% / reading 75%, grade B+, #37 of 437 statewide, top 8%, 1,578 students, 39% FRL) — zoned schools average 45% FRL vs 30% district-wide (15 pts higher); higher-poverty schools than district average — tighter screening recommended.
- Zoned-school proficiency averages 58% at this address vs 44% district-wide (+14 pts) — the actual schools serving this property are materially stronger than the Carlisle Area SD average implies; a family-tenant draw the district grade alone would hide.
- Market conditions: Rents rising (+2.5%/yr); 312 active listings in the ZIP; 19 comparable units currently listed for rent nearby; rentals at typical pace (median 26d on market — plan ~3-4 weeks tenant-placement turnaround); 1,052 units permitted in Cumberland County in 2024 (310 in 5+ unit buildings).
Forward outlook
- Local home prices are declining (-3.0%/yr); year-one equity from $1k of loan paydown is wiped out by about $6k of value loss. Plan a longer hold.
- Cumberland County population projected at +17% by 2050 — long-run rental-demand tailwind backs the buy-and-hold thesis.
Negotiation context
- Only 3 days on market — expect competitive offers; lowballing is unlikely to land.
- 2 sale attempts since 24y ago with the ask held roughly flat each time — persistent listings suggest the price (not the market) is what's stuck; bring a comps-based counter.
Risks & watch-outs
- Watch-outs: built in 1950 — expect roof / HVAC / electrical / plumbing capex.
- Climate carrying-cost: major flood risk; extreme-heat days projected 7→15/yr by 2055 (HVAC capex compounding) — expect insurance premiums to compound above CPI over the hold.
Questions for the listing agent
- What do current leases actually rent for vs. the listed asking? Can we see a recent rent roll and the last 12 months of T-12 income?
- Built in 1950 — when were the roof, HVAC, electrical panel, plumbing, and water heater last replaced?
- Is there a deadline driving the sale (1031 exchange, divorce, estate, relocation)? That informs how much negotiation room exists.
- Schools are B-rated — typically a magnet for longer-tenancy family renters. What's the average tenant stay here, and is there a school-zone premium baked into asking?
- The area grade is low — what's the realistic commute time and amenity access for the typical tenant pool here? Any planned neighborhood developments (good or bad) we should know about?
- What's the average days-on-market for RENTAL listings here right now (not sales)? A rising rental-DOM trend means longer vacancies and softer asking-rent achievability than the comps imply.
- What's the recent tenant-quality profile in this submarket — average credit score on applications, eviction rate, late-payment / NSF rate, and stable-employment percentage? A property-management company in the area should have these aggregated.
- How much new for-sale + rental construction is in the pipeline within 1–3 miles? Heavy new supply typically softens prices + rents 12–24 months out; constrained supply supports both.
Investment metrics
- 1% rule
- 0.80% ✗
- Cap rate
- 5.35%
- Cash-on-cash
- -3.37%
- DSCR
- 0.85
- GRM
- 10.4
CMA / ARV
- ARV (median comp)
- $272,790
- List price
- $200,000
- Delta
- -26.68%
- Verdict
- UNDERPRICED
- Comps
- 20 within 1.0 mi
Show comp detail 12 sales within ~0.75 mi
| Address | Dist | Beds/Ba | Sqft | Sold | Price | $/sf | Match |
|---|---|---|---|---|---|---|---|
| 140 Glendale St | 0.00mi | 2/2.0 | 1,600 (+14%) | 1mo | $207,000 | $129 | 73 |
| 506 W High St | 0.35mi | 3/2.0 (+1) | 1,361 (-3%) | 10mo | $332,000 | $244 | 64 |
| 232 Cherry St | 0.48mi | 3/2.0 (+1) | 1,450 (+4%) | 7mo | $300,000 | $207 | 59 |
| 25 Wilson St | 0.27mi | 2/1.0 | 1,204 (-14%) | 5mo | $253,000 | $210 | 58 |
| 833 W Louther St | 0.28mi | 3/1.0 (+1) | 1,296 (-7%) | 21mo | $195,000 | $150 | 50 |
| 153 N College St | 0.64mi | 3/1.5 (+1) | 1,384 (-1%) | 17mo | $225,000 | $163 | 50 |
| 910 W Louther St | 0.43mi | 3/1.0 (+1) | 1,209 (-14%) | 4mo | $284,900 | $236 | 47 |
| 18 Meeting House Spring Rd | 0.50mi | 3/1.5 (+1) | 1,438 (+3%) | 24mo | $272,500 | $189 | 47 |
| 160 N Orange St | 0.31mi | 3/2.0 (+1) | 1,599 (+14%) | 11mo | $325,000 | $203 | 45 |
| 404 W Penn St | 0.55mi | 3/1.0 (+1) | 1,528 (+9%) | 8mo | $230,000 | $151 | 45 |
| 423 W Penn St | 0.54mi | 3/2.0 (+1) | 1,218 (-13%) | 4mo | $126,500 | $104 | 43 |
| 459 B St | 0.73mi | 3/2.0 (+1) | 1,510 (+8%) | 20mo | $260,000 | $172 | 29 |
Match score weights: distance 35% · size 25% · config 20% · recency 20%. Top-matched comps best support the ARV.
Projected returns pro-forma
-3.0% appreciation · 2.54% rent growth · sell at horizon
- IRR
- -22.4%
- Equity multiple
- 0.23×
- Total profit
- $-43,119
- Equity at exit
- $29,821
- IRR
- -17.8%
- Equity multiple
- 0.05×
- Total profit
- $-53,252
- Equity at exit
- $17,292
Cash invested: $56,000 (down + closing). Projections, not guarantees.
Landlord ↔ Tenant lean methodology
- Overall (STATE)
- 62 Landlord-Friendly
- State Pennsylvania
- 62 Landlord-Friendly · EVEN
- County
- — inherits STATE
- City
- — inherits STATE
ZIP-level market 17013
- Rents YoY
- 2.5%
- Active inventory
- 312
- Price-to-rent
- 10.4×
Monthly cashflow live
- Estimated rent
- $1,609 high interval (Pro) →
- Mortgage (P&I)
- −$1,049
- Tax from tax record
- −$296 /mo · $3,555/yr
- Insurance
- −$83
- HOA
- −$0
- Vacancy / Maint / Mgmt
- −$338
- Net cashflow
- $-157
Break-even live
Sensitivity live
| Price | -10% $-44 | -5% $-101 | +0% $-157 | +5% $-214 | +10% $-271 |
|---|---|---|---|---|---|
| Rent | -10% $-284 | -5% $-221 | +0% $-157 | +5% $-94 | +10% $-30 |
| Rate | -1.0pp $-57 | -0.5pp $-106 | base $-157 | +0.5pp $-209 | +1.0pp $-262 |
UW: 25.0% down · 7.5% · 30yr · 1.5% tax · 5.0% vac · 8.0% maint · 8.0% mgmt
Financing live
Cash to close
- Down payment
- $50,000
- Closing costs
- $6,000
- Reserves months
- —
- Total cash needed
- —
Loan-product check · same deal, 3 products live
Conventional
25% down · 7.5% · 30yr
- Down + closing
- —
- Monthly P&I
- —
- Monthly cashflow
- —
- DSCR
- —
- Eligible?
- —
Personal DTI + credit; lowest rate.
DSCR
20% down · 8.5% · 30yr
- Down + closing
- —
- Monthly P&I
- —
- Monthly cashflow
- —
- DSCR
- —
- Eligible?
- —
No personal income docs; deal must DSCR.
Hard money
10% down · 12.0% · 12mo
- Down + closing
- —
- Monthly P&I
- —
- Monthly cashflow
- —
- DSCR
- —
- Eligible?
- —
Short-term bridge; refi at stabilization.
Rent comps 19 comps
| Address | Beds | Baths | Sqft | Rent | $/sqft | DOM | Units | Dist |
|---|---|---|---|---|---|---|---|---|
| 525 3rd St Carlisle, PA | 2.0 | 1.0 | 950 | $1,497 | $1.58 | 25d | 1 | 0.68mi |
| 54 W High St Carlisle, PA | 2.0 | 1.0 | 1100 | $2,180 | $1.98 | 25d | 1 | 0.83mi |
| 50 W High St Unit 203 Carlisle, PA | 2.0 | 1.5 | 1100 | $2,180 | $1.98 | 25d | 1 | 0.84mi |
| 270 B St Carlisle, PA | 2.0–3.0 | 1.0 | 1028 | $1,289 | $1.25 | 16d | 3 | 0.87mi |
| 646 N College St Carlisle, PA | 3.0 | 2.5 | 1500 | $1,795 | $1.20 | 16d | 1 | 0.88mi |
| 230 N Pitt St Carlisle, PA | 3.0 | 1.5 | 1408 | $1,300 | $0.92 | 45d | 1 | 0.90mi |
| 131 Nava CT Carlisle, PA | 2.0–3.0 | 2.0 | 1345 | $1,400 | $1.04 | 16d | 1 | 0.92mi |
| 34 S Hanover St Apt 3, Carlisle, PA 17013 Carlisle, PA | 2.0 | 1.0 | 1100 | $1,650 | $1.50 | 25d | 1 | 0.93mi |
| 238 C St Carlisle, PA | 3.0 | 1.0 | 1452 | $1,452 | $1.00 | 16d | 2 | 0.93mi |
| 630 N West St Carlisle, PA | 3.0 | 1.5 | 1686 | $1,675 | $0.99 | 25d | 1 | 0.98mi |
| 457 N Pitt St Carlisle, PA | 3.0 | 1.0 | 1320 | $1,345 | $1.02 | 25d | 1 | 1.00mi |
| 217 N Hanover St Unit 3 Carlisle, PA | 2.0 | 1.5 | 970 | $1,450 | $1.49 | 45d | 1 | 1.02mi |
| 219 N Hanover St Unit 3 Carlisle, PA | 2.0 | 1.0 | 1400 | $1,850 | $1.32 | 25d | 1 | 1.03mi |
| 517 N Pitt St Carlisle, PA | 2.0 | 1.0 | 1290 | $1,550 | $1.20 | 25d | 1 | 1.03mi |
| 1142 Redwood Dr Carlisle, PA | 3.0 | 2.5 | 1344 | $1,495 | $1.11 | 25d | 1 | 1.13mi |
| 423 N Hanover St Apt 1 Carlisle, PA | 2.0 | 1.0 | 950 | $1,250 | $1.32 | 25d | 1 | 1.16mi |
| 5 Northside Village Ln Carlisle, PA | 1.0–2.0 | 1.0–2.0 | 800 | $1,919 | $2.40 | 16d | 6 | 1.18mi |
| 156 E Penn St Carlisle, PA | 3.0 | 3.0 | 1808 | $1,850 | $1.02 | 25d | 1 | 1.22mi |
| 1 Rush Dr Carlisle, PA | 2.0 | 2.0 | 1033 | $1,650 | $1.60 | 16d | 3 | 1.45mi |
Listing history 6 events
-
2026-05-09status Pending 928-char remark
-
2026-05-07$200,000 Active 928-char remark
-
2026-05-05historical $200,000 928-char remark
-
2003-03-26soldstatus $87,500 176-char remark
Show marketing remark (176 chars)
THIS SALTBOX IS WAITING FOR A NEW OWNER TO SPRUCE IT UP AND MAKE IT A GREAT HOME AGAIN. FENCED YARD, 2 SHEDS, 2 FIREPLACES. BANK OWNED - CALL FOR SPECIAL ADDENDUMS. AS IS SALE.
-
2002-10-11$91,900 176-char remark
Show marketing remark (176 chars)
THIS SALTBOX IS WAITING FOR A NEW OWNER TO SPRUCE IT UP AND MAKE IT A GREAT HOME AGAIN. FENCED YARD, 2 SHEDS, 2 FIREPLACES. BANK OWNED - CALL FOR SPECIAL ADDENDUMS. AS IS SALE.
-
1993-04-16soldstatus $86,000
ⓘ Source: listings_history table (triggers on properties + properties_extension) + one-shot
backfill from property_details.listing_events for pre-trigger history.
Tax reassessment forecast PA · Partial reset (capped growth)
- Current annual tax
- $3,555 · $296/mo
- Projected year-2 tax
- $3,555 · $296/mo
- Expected delta
- $0/yr ($0/mo · 0.0%)
ⓘ Screening estimate from a state-policy table — verify with the county assessor before closing.
Climate risk First Street
- Flood 6/10 Major FEMA zone X (unshaded) · 74% chance over 30 yrs
- Wildfire 1/10 Low
- Heat 5/10 Major 7 d/yr ≥101°F today · 15 d/yr by 30 yrs out
- Wind 2/10 Low 4% chance of damaging wind over 30 yrs
- Air quality 2/10 Low 1 unhealthy d/yr today · 3 by 30 yrs out
Nearby sold comps map
Loading sold comps map…
Walkable amenities ~0.75 mi
Loading nearby amenities…
Taxation est. · year 1
- Rental income
- $19,307
- − Mortgage interest
- −$11,203
- − Property taxes
- −$3,555
- − Insurance
- −$1,000
- − Repairs & maintenance
- −$1,545
- − Management
- −$1,545
- − Depreciation
- −$5,818
- Taxable loss
- −$5,358
- Est. tax savings @ 24.0%
- +$1,286
- After-tax cash flow
- $-602/yr
For passive investors: Depreciation is non-cash, so a rental often shows a tax loss while cash-flowing — sheltering income. Rental losses are passive: they offset passive income freely, and up to $25,000/yr can offset ordinary (W-2) income if you actively participate and your MAGI is under $100k (phasing out to $0 by $150k); unused losses carry forward. On sale, claimed depreciation is recaptured at up to 25%, and gains may owe capital-gains tax (a 1031 exchange can defer both). Figures are a year-1 estimate at your 24.0% rate — not tax advice; consult a CPA.
Schools (NCES district)
- District
- Carlisle Area SD
- NCES district ID
- 4205010
- Math proficiency
- 33% ▼ -14.00%
- Reading proficiency
- 55% ▼ -10.00%
- Median HH income
- $55,334
- Composite
- 38.23/100
- National rank
- #4247
- State rank
- #277 of 539 in PA
Livability — Carlisle
- Score
- 78/100
- State rank
- #297
- US rank
- #2632
Category grades
Schools grade is shown separately in the Schools card above.
Census & demographics
- Census place
- Carlisle, PA
- County
- Cumberland County · 257,673 people
- City population
- 62,898
- Metro
- Harrisburg-Carlisle, PA
- Population (ZIP)
- 38,513
- Household income
- $71,042
- Rent vs Own
- Severe rent burden
- 1444.0
Population outlook (Cumberland County) Hauer SSP2
- Today (2025)
- 267,950 people
- By 2030
- 278,105 · +3.8%
- By 2040
- 296,552 · +10.7%
- By 2050
- 312,937 · +16.8%
- By 2075
- 349,233 · +30.3%
- By 2100
- 361,875 · +35.1%
Race, ethnicity, and origin ACS 2023
- Neighborhood character
- Predominantly White (79%)
- Race & ethnicity
- White 79% Black 8% Hispanic / Latino 7% Two or more races 6% Asian 3%
- Hispanic origin (detail)
- Puerto Rican 3% Dominican 1%
- Common ancestry
- Iranian 3% Romanian 3% Lithuanian 2%
- Foreign-born
- 7% · Canada, Vietnam
- Languages at home
- 91% English-only · Spanish 3% Russian/Polish/Slavic 1% Arabic 1%
Political lean MEDSL · Cumberland
- 2024 margin
- Lean R (+9.4) · D 44.6% · R 54.1% · Other 1.3%
- 2008→2024 swing
- +4.2pp toward D · 2008: -13.6pp · 2024: -9.4pp
- All cycles
- 2024: R+9.4 2020: R+10.6 2016: R+18.6 2012: R+18.5 2008: R+13.6
Not yet ingested
- Civics
- —
Market trends
- HPI YoY
- ▼ -140.48%
- Current HPI
- 247.337
- Rent YoY
- ▲ 2.54%
- Metro
- Harrisburg-Carlisle, PA
- State GDP YoY
- ▲ 1.68%
- F500 in state
- 34
Industry mix (Fortune 500 HQ in PA)
| Industry | F500 HQs | Revenue |
|---|---|---|
| Healthcare | 2 | $309B |
|
||
| Insurance | 2 | $27B |
|
||
| Telecommunications / Media | 1 | $124B |
|
||
| Industrial Distribution | 1 | $22B |
|
||
| Financial Services | 1 | $20B |
|
||
| Chemicals / Materials | 1 | $18B |
|
||
Price history
+140.7% since first listed7 events — show timeline
- 2026-05-22 Sold (MLS) $207,000 BRIGHT MLS
- 2026-05-09 Pending — BRIGHT MLS
- 2026-05-07 Listed $200,000 BRIGHT MLS
- 2026-05-05 Coming Soon $200,000 BRIGHT MLS
- 2003-03-26 Sold (MLS) $87,500 BRIGHT MLS
- 2002-10-11 Listed $91,900 BRIGHT MLS
- 1993-04-16 Sold (Public Records) $86,000 Public Records
Property tax history
+2.4%/yrLatest (2026): $3,555 · +2.1% YoY. Source: county tax records.
Cash-flow waterfall
monthlySold comps — $/sqft
last 12 mo · ≤1 miLoading sold comps…