205 Langham Ct · Moncks Corner, SC
Flood risk No data
- FEMA flood zone
- —
- Chance of flooding over 30 yrs
- —
- Est. flood insurance / yr
- —
Fire risk No data
- Est. fire insurance / yr
- —
Heat risk No data
- Hot days now (above threshold)
- —
- Hot days in 30 yrs
- —
Wind risk No data
- Chance of severe wind over 30 yrs
- —
Air-quality risk No data
- Unhealthy air days now
- —
- Unhealthy air days in 30 yrs
- —
Risk factors via First Street. Map © Google.
Why this score? — see what drove the C- grade
The composite is a weighted blend of 9 inputs, each scored 0–100. Each bar is that input's sub-score; the figure is the points it added to the 100-point composite (weight × sub-score).
- Cash flow +22.0/30.0
- ARV discount +7.5/15.0
- DSCR +7.0/10.0
- 1% rule +4.6/10.0
- Schools +3.6/10.0
- Livability +3.4/5.0
- Rent growth +3.2/5.0
- Condition / age +2.5/5.0
- Appreciation +0.0/10.0
$249,444
🖨 Deal sheet (PDF) 📄 Offer letter ✓ Due diligence
Listing remarks
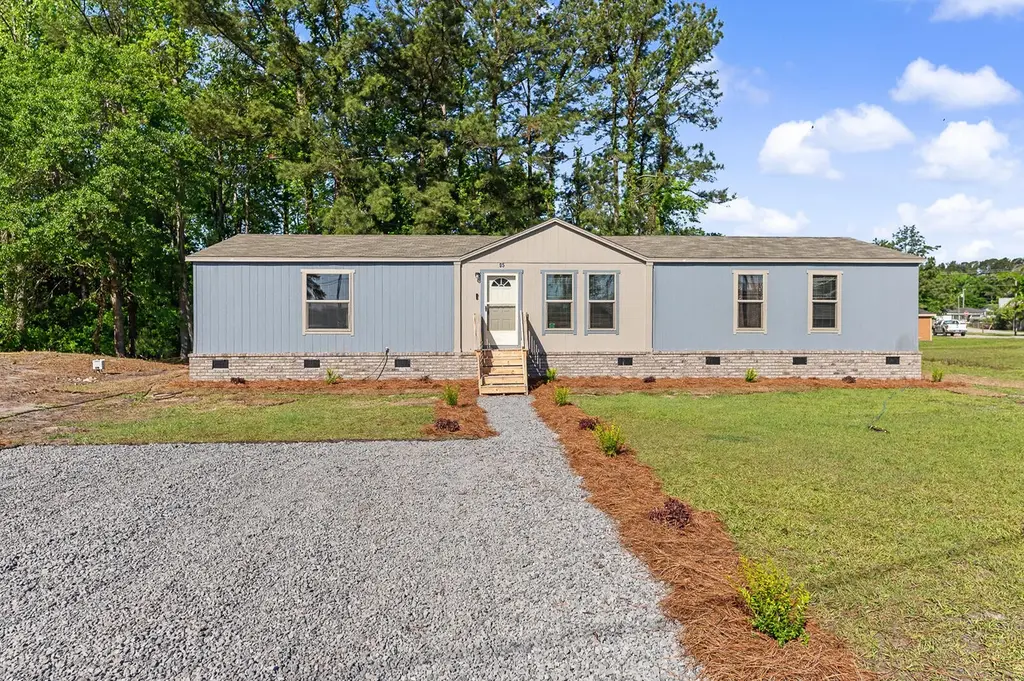
Welcome to your beautiful new 4-bedroom, 2-bath manufactured home in Moncks Corner, conveniently located near Goose Creek and Summerville! This home features an open layout perfect for everyday living and entertaining. The kitchen offers plentiful cabinetry, ample counter space, and a sleek stainless steel sink. Enjoy modern finishes throughout, including durable vinyl flooring, tapeless ceilings with blown texture, and raised panel interior doors with stylish metal hardware. Bathrooms include ceramic sinks, metal faucets, and elongated commodes for added comfort. Don't miss this move-in ready opportunity--schedule your showing today! * * * * * Seller is willing to pay $10,000 towards
Key facts
- 0.52 acre lot
- Built 2024
- Listed 71 days
Property features AI
Exterior
- Parking: Off-street parking
- Utilities: Septic tank; BCW & SA water; Berkeley Electric Co-Op power
- Home design: Manufactured / mobile home; One story; New construction
- Construction: Brick skirting
- Exterior features: Asphalt roof; .5 - 1 acre interior lot
Interior
- Kitchen: Dishwasher; Disposal; Electric range; Microwave; Refrigerator
- Bedrooms: 4 bedrooms; Primary bedroom with ceiling fan and walk-in closet
- Flooring: Luxury vinyl
- Bathrooms: 2 bathrooms
- Heating & cooling: Central heating (electric); Central air conditioning
- Interior features: Ceiling fan(s); Eat-in kitchen; Family room; Pantry; Utility room
- Laundry & utility: Washer hookup; Electric dryer hookup
Neighborhood map
What this means for you Summary
Snapshot
- This is a 4-bed/2.0-bath land listed at $249k.
Deal economics
- At list price, monthly cash flow is $398 ($5k/yr) — positive.
- The deal already cash-flows at list — no discount required.
- To meet the 1% rule (rent ≥ 1% of price), the offer needs to be $240k (3.8% below list).
- Recommended offer: $234k (6.0% below list) — sets the bar for market timing.
- Cap rate 8.2% vs local median 4.6% in Moncks Corner — top-decile yield for the area; either an underpriced asset or a hidden risk that comps aren't pricing in. Stress-test before assuming the spread holds.
Location & tenants
- Location reads 67/100 on livability (#99 in SC) — a middle-class / working-renter tenant base. Strengths: housing A+, health & safety A+, cost of living A; Watch: crime C-, amenities F, commute F.
- Berkeley 01 (suburban): math 35% / reading 48% proficiency, ranked #30 of 80 in SC (top 38%) — families likely to look elsewhere, expect single-tenant / working-renter base with shorter leases.
- Zoned schools: Berkeley Elementary (619 students, 100% FRL); Berkeley Middle (math 19% / reading 32%, grade F, #162 of 229 statewide, top 71%, 1,403 students, 57% FRL); Berkeley High (math 36% / reading 83%, grade C+, #110 of 196 statewide, top 58%, 1,776 students, 50% FRL) — zoned schools average 69% FRL vs 48% district-wide (21 pts higher); higher-poverty schools than district average — tighter screening recommended.
- Market conditions: Rents rising (+2.8%/yr); 644 active listings in the ZIP; solid renter incomes; 3,183 units permitted in Berkeley County in 2024 (580 in 5+ unit buildings).
- This rent runs 35% of the median local income ($83k/yr) — at the standard rent-burdened threshold; future hikes will face affordability resistance.
Forward outlook
- Local home prices are declining (-3.0%/yr); year-one equity from $2k of loan paydown is wiped out by about $7k of value loss. Plan a longer hold.
- Berkeley County population projected at +48% by 2050 — long-run rental-demand tailwind backs the buy-and-hold thesis.
Negotiation context
- It's been on market 72 days — a 6% lower offer ($234k) is reasonable based on typical stale-listing flexibility.
Questions for the listing agent
- It's been on market 72 days. Have you received any prior offers? Is the seller open to a 6% concession, seller financing, or rate buy-down credit?
- Why hasn't it sold? Are there any deal-killer items the seller is aware of (foundation, flood, title, zoning, code violations)?
- Is there a deadline driving the sale (1031 exchange, divorce, estate, relocation)? That informs how much negotiation room exists.
- Schools are D-rated, which usually means shorter tenancies and higher turnover. Who's the typical renter profile here, and what's been the actual vacancy rate?
- What's the average days-on-market for RENTAL listings here right now (not sales)? A rising rental-DOM trend means longer vacancies and softer asking-rent achievability than the comps imply.
- What's the recent tenant-quality profile in this submarket — average credit score on applications, eviction rate, late-payment / NSF rate, and stable-employment percentage? A property-management company in the area should have these aggregated.
- How much new for-sale + rental construction is in the pipeline within 1–3 miles? Heavy new supply typically softens prices + rents 12–24 months out; constrained supply supports both.
Investment metrics
- 1% rule
- 0.96% ✗
- Cap rate
- 8.21%
- Cash-on-cash
- 6.83%
- DSCR
- 1.30
- GRM
- 8.7
CMA / ARV
No comps found within radius.
Projected returns pro-forma
-3.0% appreciation · 2.77% rent growth · sell at horizon
- IRR
- -6.1%
- Equity multiple
- 0.77×
- Total profit
- $-15,740
- Equity at exit
- $37,193
- IRR
- 3.3%
- Equity multiple
- 1.23×
- Total profit
- $16,241
- Equity at exit
- $21,567
Cash invested: $69,844 (down + closing). Projections, not guarantees.
Landlord ↔ Tenant lean methodology
- Overall (STATE)
- 90 Strongly Landlord-Friendly
- State South Carolina
- 90 Strongly Landlord-Friendly · R+6
- County
- — inherits STATE
- City
- — inherits STATE
ZIP-level market 29461
- Home prices YoY
- -13.9%
- Rents YoY
- 2.8%
- Active inventory
- 644
- Price-to-rent
- 8.7×
Monthly cashflow live
- Estimated rent
- $2,401 medium interval (Pro) →
- Mortgage (P&I)
- −$1,308
- Tax from tax record
- −$87 /mo · $1,040/yr
- Insurance
- −$104
- HOA
- −$0
- Vacancy / Maint / Mgmt
- −$504
- Net cashflow
- $398
Break-even live
Sensitivity live
| Price | -10% $539 | -5% $468 | +0% $398 | +5% $327 | +10% $257 |
|---|---|---|---|---|---|
| Rent | -10% $208 | -5% $303 | +0% $398 | +5% $493 | +10% $587 |
| Rate | -1.0pp $523 | -0.5pp $461 | base $398 | +0.5pp $333 | +1.0pp $267 |
UW: 25.0% down · 7.5% · 30yr · 1.5% tax · 5.0% vac · 8.0% maint · 8.0% mgmt
Financing live
Cash to close
- Down payment
- $62,361
- Closing costs
- $7,483
- Reserves months
- —
- Total cash needed
- —
Loan-product check · same deal, 3 products live
Conventional
25% down · 7.5% · 30yr
- Down + closing
- —
- Monthly P&I
- —
- Monthly cashflow
- —
- DSCR
- —
- Eligible?
- —
Personal DTI + credit; lowest rate.
DSCR
20% down · 8.5% · 30yr
- Down + closing
- —
- Monthly P&I
- —
- Monthly cashflow
- —
- DSCR
- —
- Eligible?
- —
No personal income docs; deal must DSCR.
Hard money
10% down · 12.0% · 12mo
- Down + closing
- —
- Monthly P&I
- —
- Monthly cashflow
- —
- DSCR
- —
- Eligible?
- —
Short-term bridge; refi at stabilization.
Listing history 19 events
-
2026-06-21days on market $249,444 Active 72 DOM
-
2026-06-18days on market $249,444 Active 69 DOM
-
2026-06-17days on market $249,444 Active 68 DOM
-
2026-06-16days on market $249,444 Active 67 DOM
-
2026-06-15days on market $249,444 Active 66 DOM
-
2026-06-13days on market $249,444 Active 64 DOM
-
2026-06-13pricedays on market $249,444 Active 63 DOM
-
2026-06-10days on market $269,444 Active 61 DOM
-
2026-06-09days on market $269,444 Active 60 DOM
-
2026-06-08days on market $269,444 Active 59 DOM
-
2026-06-07days on market $269,444 Active 58 DOM
-
2026-06-05days on market $269,444 Active 55 DOM
-
2026-06-03days on market $269,444 Active 54 DOM
-
2026-06-03days on market $269,444 Active 53 DOM
-
2026-06-01days on market $269,444 Active 52 DOM
-
2026-05-31days on market $269,444 Active 51 DOM
-
2026-05-14price $269,444
-
2026-04-20price $278,444
-
2026-04-10$279,444 Active
ⓘ Source: listings_history table (triggers on properties + properties_extension) + one-shot
backfill from property_details.listing_events for pre-trigger history.
Tax reassessment forecast SC · Resets to sale price
- Current annual tax
- $1,040 · $87/mo
- Projected year-2 tax
- $1,422 · $118/mo
- Expected delta
- +$381/yr (+$32/mo · 36.7%)
ⓘ Screening estimate from a state-policy table — verify with the county assessor before closing.
Nearby sold comps map
Loading sold comps map…
Walkable amenities ~0.75 mi
Loading nearby amenities…
Taxation est. · year 1
- Rental income
- $28,809
- − Mortgage interest
- −$13,973
- − Property taxes
- −$1,040
- − Insurance
- −$1,247
- − Repairs & maintenance
- −$2,305
- − Management
- −$2,305
- − Depreciation
- −$7,257
- Taxable income
- $682
- Est. tax owed @ 24.0%
- −$164
- After-tax cash flow
- $4,610/yr
For passive investors: Depreciation is non-cash, so a rental often shows a tax loss while cash-flowing — sheltering income. Rental losses are passive: they offset passive income freely, and up to $25,000/yr can offset ordinary (W-2) income if you actively participate and your MAGI is under $100k (phasing out to $0 by $150k); unused losses carry forward. On sale, claimed depreciation is recaptured at up to 25%, and gains may owe capital-gains tax (a 1031 exchange can defer both). Figures are a year-1 estimate at your 24.0% rate — not tax advice; consult a CPA.
Schools (NCES district)
- District
- Berkeley 01
- NCES district ID
- 4501170
- Math proficiency
- 35% ▼ -8.00%
- Reading proficiency
- 48% ▼ -2.00%
- Median HH income
- $52,724
- Composite
- 35.95/100
- National rank
- #4799
- State rank
- #30 of 80 in SC
Livability — Moncks Corner
- Score
- 67/100
- State rank
- #99
- US rank
- #10812
Category grades
Schools grade is shown separately in the Schools card above.
Census & demographics
- County
- Berkeley County · 198,768 people
- City population
- 43,816
- Metro
- Charleston-North Charleston, SC
- Population (ZIP)
- 43,816
- Household income
- $82,666
- Rent vs Own
- Severe rent burden
- 815.0
Population outlook (Berkeley County) Hauer SSP2
- Today (2025)
- 254,184 people
- By 2030
- 279,677 · +10.0%
- By 2040
- 329,379 · +29.6%
- By 2050
- 375,557 · +47.8%
- By 2075
- 476,740 · +87.6%
- By 2100
- 535,945 · +110.8%
Race, ethnicity, and origin ACS 2023
- Neighborhood character
- Majority White (61%)
- Race & ethnicity
- White 61% Black 29% Hispanic / Latino 6% Two or more races 5%
- Hispanic origin (detail)
- Mexican 2% Puerto Rican 2%
- Common ancestry
- Lithuanian 1% Slovak 1% Romanian 1%
- Foreign-born
- 3% · Canada
- Languages at home
- 96% English-only · Spanish 3%
Political lean MEDSL · Berkeley
- 2024 margin
- R (+16.3) · D 41.1% · R 57.4% · Other 1.4%
- 2008→2024 swing
- -3.2pp toward R · 2008: -13.1pp · 2024: -16.3pp
- All cycles
- 2024: R+16.3 2020: R+11.7 2016: R+17.4 2012: R+18.9 2008: R+13.1
Not yet ingested
- Civics
- —
Market trends
- HPI YoY
- ▼ -52.95%
- Current HPI
- 328.7212
- Rent YoY
- ▲ 2.77%
- Metro
- Charleston-North Charleston, SC
- State GDP YoY
- ▲ 4.51%
- F500 in state
- 2
Industry mix (Fortune 500 HQ in SC)
| Industry | F500 HQs | Revenue |
|---|---|---|
| Packaging | 1 | $7B |
|
||
Price history
-3.6% since first listed3 events — show timeline
- 2026-05-14 Price Changed $269,444 Charleston Trident MLS
- 2026-04-20 Price Changed $278,444 Charleston Trident MLS
- 2026-04-10 Listed $279,444 Charleston Trident MLS
Cash-flow waterfall
monthlySold comps — $/sqft
last 12 mo · ≤1 miLoading sold comps…