 🏷️ Likely Rental
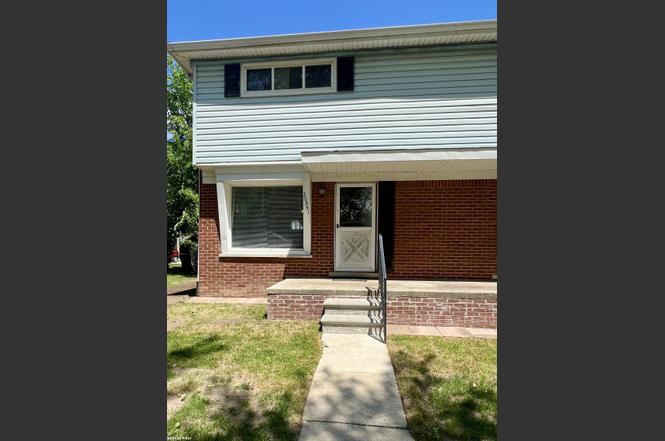
20351 8 Mile Rd · St. Clair Shores, MI
Flood risk 1/10 · Minimal
- FEMA flood zone
- X (unshaded)
- Chance of flooding over 30 yrs
- 0.0%
- Est. flood insurance / yr
- $507 – $1,088
Fire risk 1/10 · Minimal
- Est. fire insurance / yr
- $784 – $1,456
Heat risk 3/10 · Minor
- Hot days now (above 96°F)
- 7 days/yr
- Hot days in 30 yrs
- 15 days/yr
Wind risk 1/10 · Minimal
- Chance of severe wind over 30 yrs
- —
Air-quality risk 4/10 · Minor
- Unhealthy air days now
- 4 days/yr
- Unhealthy air days in 30 yrs
- 5 days/yr
Risk factors via First Street. Map © Google.
Why this score? — see what drove the D grade
The composite is a weighted blend of 9 inputs, each scored 0–100. Each bar is that input's sub-score; the figure is the points it added to the 100-point composite (weight × sub-score).
- Cash flow +15.0/30.0
- ARV discount +7.5/15.0
- 1% rule +5.0/10.0
- DSCR +5.0/10.0
- Rent growth +2.5/5.0
- Livability +2.5/5.0
- Condition / age +2.5/5.0
- Schools +1.7/10.0
- Appreciation +0.0/10.0
$1,400
🖨 Deal sheet 📄 Offer letter ✓ Due diligence
Listing remarks MLS
For Lease! 2 bed, 1 bath, full basement! All appliances are included. Central air, freshly painted, gorgeous hardwood floors, new kitchen, & remodeled bath! Sorry, NO PETS. Lawn care is included in rent. Tenant(s) are responsible for snow/ ice removal. Truly move in condition. Located within walking distance to shopping, dining, parks, schools. Tenant to pay all utilities. 2-year lease is required. 1.5-month security deposit, plus 1st month rent and water security deposit is required to move in. Minimum credit score of 620.
Key facts
- Lawn care included
- New kitchen
- Full basement
Tags
Property features AI
Finance
- Other: Zoning: Residential; Subdivision: DALBY & CAMPBELL MACK PARK # 01; Cross street: 8 Mile / West of I-94; Listing broker: RE/MAX First
- Financial info: No additional financial details provided
- HOA & community: Homeowners association present
Exterior
- Parking: No parking details provided
- Security: No security features listed
- Utilities: Public water; Public sewer
- Home design: Single-family residence; Two levels
- Construction: Brick construction; Block foundation; Above-grade finished area listed as 1,000 square feet
- Exterior features: Front porch; Paved road access; Lot dimensions approximately 71 x 82
Interior
- Kitchen: Microwave; Oven; Range; Refrigerator; Gas water heater
- Bedrooms: Total of 5 rooms (includes bedrooms and living spaces)
- Flooring: Hardwood
- Bathrooms: 1 full bathroom
- Heating & cooling: Central air; Ceiling fan(s); Forced air heating; Natural gas
- Interior features: Window treatments; Block basement
- Laundry & utility: Washer; Dryer
Neighborhood map
What this means for you Summary
Snapshot
- This is a 6-bed/3.0-bath single-family listed at $1k.
Deal economics
- At list price, monthly cash flow is $2k ($21k/yr) — positive.
- The deal already cash-flows at list — no discount required.
- Meets the 1% rule at list price ($2k rent vs $1k).
- Cap rate 1507.7% vs local median 4.2% in St. Clair Shores — top-decile yield for the area; either an underpriced asset or a hidden risk that comps aren't pricing in. Stress-test before assuming the spread holds.
Location & tenants
- Location reads: area grade D — affects rentability + tenant quality, not the cash-flow math above.
- South Lake Schools (suburban): math 11% / reading 26% proficiency, ranked #470 of 540 in MI (top 87%) — low school quality limits family demand, transient renter base, plan for 1-2y turnover.
- Market conditions: 161 active listings in the ZIP; 1,321 units permitted in Macomb County in 2024 (86 in 5+ unit buildings).
- This rent runs 40% of the median local income ($67k/yr) — at the standard rent-burdened threshold; future hikes will face affordability resistance.
Forward outlook
- Local home prices are declining (-3.0%/yr); year-one equity from $10 of loan paydown is wiped out by about $42 of value loss. Plan a longer hold.
- Macomb County population projected at +9% by 2050 — modest demand growth; plan on rents tracking national, not racing it.
- At projected returns (-3.0% appreciation + 3.0% rent growth), your $392 cash investment doubles in ~1 year — after that, you're playing with house money.
Negotiation context
- Only 6 days on market — expect competitive offers; lowballing is unlikely to land.
- 6 sale attempts since 15y ago with the ask held roughly flat each time — persistent listings suggest the price (not the market) is what's stuck; bring a comps-based counter.
Questions for the listing agent
- Built in 1961 — when were the roof, HVAC, electrical panel, plumbing, and water heater last replaced?
- Is there a deadline driving the sale (1031 exchange, divorce, estate, relocation)? That informs how much negotiation room exists.
- The area grade is low — what's the realistic commute time and amenity access for the typical tenant pool here? Any planned neighborhood developments (good or bad) we should know about?
- What's the average days-on-market for RENTAL listings here right now (not sales)? A rising rental-DOM trend means longer vacancies and softer asking-rent achievability than the comps imply.
- What's the recent tenant-quality profile in this submarket — average credit score on applications, eviction rate, late-payment / NSF rate, and stable-employment percentage? A property-management company in the area should have these aggregated.
- How much new for-sale + rental construction is in the pipeline within 1–3 miles? Heavy new supply typically softens prices + rents 12–24 months out; constrained supply supports both.
Investment metrics
- 1% rule
- 159.26% ✓
- Cap rate
- 1507.74%
- Cash-on-cash
- 5362.30%
- DSCR
- 239.59
- GRM
- 0.1
CMA / ARV
No comps found within radius.
Projected returns pro-forma
-3.0% appreciation · 3.0% rent growth · sell at horizon
- IRR
- —
- Equity multiple
- 285.11×
- Total profit
- $111,373
- Equity at exit
- $209
- IRR
- —
- Equity multiple
- 615.23×
- Total profit
- $240,777
- Equity at exit
- $121
Cash invested: $392 (down + closing). Projections, not guarantees.
Landlord ↔ Tenant lean methodology
- Overall (STATE)
- 62 Landlord-Friendly
- State Michigan
- 62 Landlord-Friendly · EVEN
- County
- — inherits STATE
- City
- — inherits STATE
ZIP-level market 48080
- Active inventory
- 161
- Price-to-rent
- 0.1×
Monthly cashflow live
- Estimated rent
- $2,230 medium interval (Pro) →
- Mortgage (P&I)
- −$7
- Tax est. 1.5%
- −$2 /mo · $21/yr
- Insurance
- −$1
- HOA
- −$0
- Vacancy / Maint / Mgmt
- −$468
- Net cashflow
- $1,752
Break-even live
UW: 25.0% down · 7.5% · 30yr · 1.5% tax · 5.0% vac · 8.0% maint · 8.0% mgmt
Financing live
Cash to close
- Down payment
- $350
- Closing costs
- $42
- Reserves months
- —
- Total cash needed
- —
Loan-product check · same deal, 3 products live
Conventional
25% down · 7.5% · 30yr
- Down + closing
- —
- Monthly P&I
- —
- Monthly cashflow
- —
- DSCR
- —
- Eligible?
- —
Personal DTI + credit; lowest rate.
DSCR
20% down · 8.5% · 30yr
- Down + closing
- —
- Monthly P&I
- —
- Monthly cashflow
- —
- DSCR
- —
- Eligible?
- —
No personal income docs; deal must DSCR.
Hard money
10% down · 12.0% · 12mo
- Down + closing
- —
- Monthly P&I
- —
- Monthly cashflow
- —
- DSCR
- —
- Eligible?
- —
Short-term bridge; refi at stabilization.
Listing history 5 events
-
2026-06-16days on market $1,400 Active 6 DOM
-
2026-06-15days on market $1,400 Active 5 DOM
-
2026-06-13days on market $1,400 Active 3 DOM
-
2026-06-13remarks 530-char remark
-
2026-06-13$1,400 Active 2 DOM
ⓘ Source: listings_history table (triggers on properties + properties_extension) + one-shot
backfill from property_details.listing_events for pre-trigger history.
Climate risk First Street
- Flood 1/10 Low FEMA zone X (unshaded) · 0% chance over 30 yrs
- Wildfire 1/10 Low
- Heat 3/10 Moderate 7 d/yr ≥96°F today · 15 d/yr by 30 yrs out
- Wind 1/10 Low
- Air quality 4/10 Moderate 4 unhealthy d/yr today · 5 by 30 yrs out
Nearby sold comps map
Loading sold comps map…
Walkable amenities ~0.75 mi
Loading nearby amenities…
Taxation est. · year 1
- Rental income
- $26,755
- − Mortgage interest
- −$78
- − Property taxes
- −$21
- − Insurance
- −$7
- − Repairs & maintenance
- −$2,140
- − Management
- −$2,140
- − Depreciation
- −$41
- Taxable income
- $22,327
- Est. tax owed @ 24.0%
- −$5,358
- After-tax cash flow
- $15,662/yr
For passive investors: Depreciation is non-cash, so a rental often shows a tax loss while cash-flowing — sheltering income. Rental losses are passive: they offset passive income freely, and up to $25,000/yr can offset ordinary (W-2) income if you actively participate and your MAGI is under $100k (phasing out to $0 by $150k); unused losses carry forward. On sale, claimed depreciation is recaptured at up to 25%, and gains may owe capital-gains tax (a 1031 exchange can defer both). Figures are a year-1 estimate at your 24.0% rate — not tax advice; consult a CPA.
Schools (NCES district)
- District
- South Lake Schools
- NCES district ID
- 2632220
- Math proficiency
- 11% ▼ -10.00%
- Reading proficiency
- 26% ▼ -12.00%
- Median HH income
- $51,594
- Composite
- 16.76/100
- National rank
- #9159
- State rank
- #470 of 540 in MI
Livability — St. Clair Shores
No livability data for this city. (Only ~50 U.S. cities are tracked.)
Census & demographics
- Census place
- St. Clair Shores, MI
- County
- Macomb County · 638,552 people
- City population
- 58,217
- Metro
- Detroit-Warren-Dearborn, MI
- Population (ZIP)
- 21,561
- Household income
- $66,986
- Rent vs Own
- Severe rent burden
- 530.0
Population outlook (Macomb County) Hauer SSP2
- Today (2025)
- 925,296 people
- By 2030
- 948,226 · +2.5%
- By 2040
- 983,961 · +6.3%
- By 2050
- 1,010,200 · +9.2%
- By 2075
- 1,076,222 · +16.3%
- By 2100
- 1,077,065 · +16.4%
Race, ethnicity, and origin ACS 2023
- Neighborhood character
- Predominantly White (83%)
- Race & ethnicity
- White 83% Black 8% Two or more races 6% Hispanic / Latino 4% Asian 2%
- Common ancestry
- Romanian 14% Lithuanian 5% Slovak 2%
- Foreign-born
- 6% · Canada, Jamaica
- Languages at home
- 92% English-only · Other Indo-European 3% Spanish 2% Russian/Polish/Slavic 1%
Political lean MEDSL · Macomb
- 2024 margin
- R (+13.7) · D 42.2% · R 55.9% · Other 1.9%
- 2008→2024 swing
- -22.3pp toward R · 2008: 8.6pp · 2024: -13.7pp
- All cycles
- 2024: R+13.7 2020: R+8.1 2016: R+11.6 2012: D+4.0 2008: D+8.6
Not yet ingested
- Civics
- —
Market trends
- HPI YoY
- ▼ -236.99%
- Current HPI
- 231.507
- Rent YoY
- —
- Metro
- Detroit-Warren-Dearborn, MI
- State GDP YoY
- ▲ 1.37%
- F500 in state
- 28
Industry mix (Fortune 500 HQ in MI)
| Industry | F500 HQs | Revenue |
|---|---|---|
| Automotive Parts | 3 | $48B |
|
||
| Automotive | 2 | $372B |
|
||
| Chemicals | 1 | $45B |
|
||
| Automotive Retail | 1 | $29B |
|
||
| Healthcare / Medical Devices | 1 | $23B |
|
||
| Automotive Technology | 1 | $20B |
|
||
Price history
-98.5% since first listed13 events — show timeline
- 2026-06-08 Listed $1,400 MiRealSource-MiMLS
- 2026-06-08 Listed $1,400 REALCOMP
- 2026-05-04 Sold (Public Records) $250,000 Public Records
- 2026-04-30 Pending — REALCOMP
- 2026-04-30 Pending — MiRealSource-MiMLS
- 2026-04-30 Sold (MLS) $250,000 MiRealSource-MiMLS
- 2026-04-30 Sold (MLS) $250,000 REALCOMP
- 2026-04-08 Listed $269,900 REALCOMP
- 2026-04-08 Listed $269,900 MiRealSource-MiMLS
- 2011-10-01 Listing Removed — MiRealSource-MiMLS
- 2011-10-01 Listing Removed — MiRealSource-MiMLS
- 2011-08-15 Listed $93,500 MiRealSource-MiMLS
- 2011-06-29 Listed $93,500 MiRealSource-MiMLS
Property tax history
+7.8%/yrLatest (2025): $6,035 · -4.0% YoY. Source: county tax records.
Cash-flow waterfall
monthlySold comps — $/sqft
last 12 mo · ≤1 miLoading sold comps…