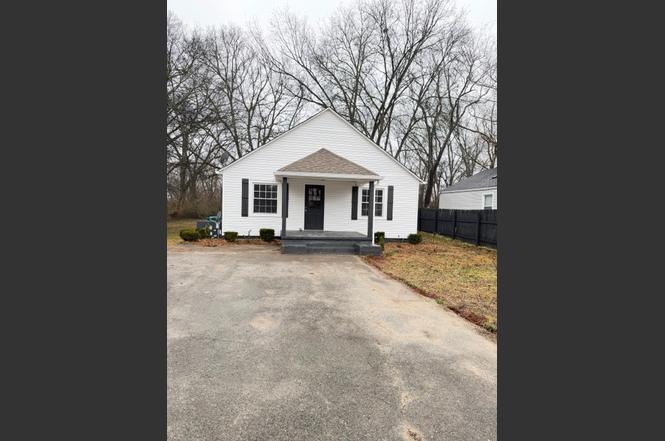
417 Laura Ave · Winchester, TN
Flood risk 6/10 · Moderate
- FEMA flood zone
- X (unshaded)
- Chance of flooding over 30 yrs
- 0.73%
- Est. flood insurance / yr
- $507 – $1,088
Fire risk 1/10 · Minimal
- Est. fire insurance / yr
- $949 – $1,763
Heat risk 5/10 · Moderate
- Hot days now (above 104°F)
- 7 days/yr
- Hot days in 30 yrs
- 20 days/yr
Wind risk 4/10 · Minor
- Chance of severe wind over 30 yrs
- 12.0%
Air-quality risk 2/10 · Minimal
- Unhealthy air days now
- 2 days/yr
- Unhealthy air days in 30 yrs
- 2 days/yr
Risk factors via First Street. Map © Google.
Why this score? — see what drove the C+ grade
The composite is a weighted blend of 9 inputs, each scored 0–100. Each bar is that input's sub-score; the figure is the points it added to the 100-point composite (weight × sub-score).
- Cash flow +26.9/30.0
- DSCR +9.3/10.0
- ARV discount +9.3/15.0
- 1% rule +6.0/10.0
- Livability +3.2/5.0
- Rent growth +2.5/5.0
- Condition / age +2.5/5.0
- Schools +1.7/10.0
- Appreciation +0.0/10.0
$189,000
🖨 Deal sheet (PDF) 📄 Offer letter ✓ Due diligence
Listing remarks
Welcome to this charming starter home that has been completely renovated from top to bottom and is ready for its next lucky owner! Step inside to discover fresh finishes, updated fixtures, and a bright, welcoming layout that makes everyday living feel effortless. Perfectly situated in a convenient location close to shopping/dining. New LVP flooring, SS appliances, replacement windows, fresh paint and so much more. Whether you're a first-time buyer or looking to downsize without sacrificing style, this sweet spot checks all the boxes. Move-in ready!!
Key facts
- Fresh paint
- Ss appliances
- Completely renovated
Tags
Property features AI
Finance
- Financial info: Annual tax amount listed (not included per instructions)
Exterior
- Parking: No covered, carport, or designated parking spaces listed
- Utilities: Public water; Public sewer; Electricity available
- Home design: Single-family residence; One story; Existing (previously built)
- Construction: Vinyl siding exterior
- Exterior features: Lot approximately 0.51 acre (dimensions approx. 100 x 209 irregular); Vinyl siding
Interior
- Kitchen: Electric oven and electric range; Dishwasher; Microwave; Refrigerator
- Bedrooms: Three bedrooms (all on the main level) — approx. 9x13, 9x10, and 9x13
- Bathrooms: One full bathroom
- Heating & cooling: Central electric heating; Central electric air conditioning
- Interior features: Partial basement; Porch (covered)
- Laundry & utility: Utility room (approx. 8x10)
Neighborhood map
What this means for you Summary
Snapshot
- This is a 3-bed/1.0-bath single-family listed at $189k.
Deal economics
- At list price, monthly cash flow is $524 ($6k/yr) — positive.
- The deal already cash-flows at list — no discount required.
- Meets the 1% rule at list price ($2k rent vs $189k).
- Recommended offer: $172k (9.0% below list) — sets the bar for market timing.
- Cap rate 9.6% vs local median 3.2% in Winchester — top-decile yield for the area; either an underpriced asset or a hidden risk that comps aren't pricing in. Stress-test before assuming the spread holds.
Location & tenants
- Location reads 65/100 on livability (#149 in TN) — a middle-class / working-renter tenant base. Strengths: cost of living A+, housing A+; Watch: employment C-, crime D, amenities D-.
- Franklin County (town): math 18% / reading 22% proficiency, ranked #111 of 139 in TN (top 80%) — low school quality limits family demand, transient renter base, plan for 1-2y turnover.
- Zoned schools: Clark Memorial School (math 14% / reading 27%, grade F, #637 of 952 statewide, top 68%, 489 students, 0% FRL); North Middle School (math 13% / reading 19%, grade F, #223 of 333 statewide, top 68%, 587 students, 0% FRL); Franklin Co High School (math 5% / reading 22%, grade F, #255 of 332 statewide, top 77%, 1,180 students, 0% FRL) — zoned schools average 0% FRL vs 48% district-wide (48 pts lower); this property's tenant base skews higher-income than the district average.
- Market conditions: 325 active listings in the ZIP; 422 units permitted in Franklin County in 2024 (5 in 5+ unit buildings).
Forward outlook
- Local home prices are declining (-3.0%/yr); year-one equity from $1k of loan paydown is wiped out by about $6k of value loss. Plan a longer hold.
- Franklin County population projected at +6% by 2050 — modest demand growth; plan on rents tracking national, not racing it.
- At projected returns (-3.0% appreciation + 3.0% rent growth), your $53k cash investment doubles in ~10 years — after that, you're playing with house money.
Negotiation context
- It's been on market 114 days — a 9% lower offer ($172k) is reasonable based on typical stale-listing flexibility.
- Current owner paid $46k; list at $189k implies a 311% gain — meaningful room to come down on a strong offer.
Risks & watch-outs
- Watch-outs: built in 1950 — expect roof / HVAC / electrical / plumbing capex.
- Climate carrying-cost: major flood risk; extreme-heat days projected 7→20/yr by 2055 (HVAC capex compounding) — expect insurance premiums to compound above CPI over the hold.
Questions for the listing agent
- It's been on market 114 days. Have you received any prior offers? Is the seller open to a 9% concession, seller financing, or rate buy-down credit?
- Built in 1950 — when were the roof, HVAC, electrical panel, plumbing, and water heater last replaced?
- Why hasn't it sold? Are there any deal-killer items the seller is aware of (foundation, flood, title, zoning, code violations)?
- Is there a deadline driving the sale (1031 exchange, divorce, estate, relocation)? That informs how much negotiation room exists.
- Schools are F-rated, which usually means shorter tenancies and higher turnover. Who's the typical renter profile here, and what's been the actual vacancy rate?
- Crime grade is D in this area — have there been break-ins, vandalism, or insurance claims at this property in the last 3 years? What carrier currently insures it and at what premium?
- What's the average days-on-market for RENTAL listings here right now (not sales)? A rising rental-DOM trend means longer vacancies and softer asking-rent achievability than the comps imply.
- What's the recent tenant-quality profile in this submarket — average credit score on applications, eviction rate, late-payment / NSF rate, and stable-employment percentage? A property-management company in the area should have these aggregated.
- How much new for-sale + rental construction is in the pipeline within 1–3 miles? Heavy new supply typically softens prices + rents 12–24 months out; constrained supply supports both.
Investment metrics
- 1% rule
- 1.10% ✓
- Cap rate
- 9.62%
- Cash-on-cash
- 11.87%
- DSCR
- 1.53
- GRM
- 7.6
CMA / ARV
- ARV (on-the-fly)
- $196,840
- Comps found
- 12
Show comp detail 12 sales within ~0.75 mi
| Address | Dist | Beds/Ba | Sqft | Sold | Price | $/sf | Match |
|---|---|---|---|---|---|---|---|
| 417 Laura Ave | 0.00mi | 3/1.0 | 1,064 (0%) | 1mo | $186,000 | $175 | 99 |
| 713 Hunt St | 0.16mi | 3/2.0 | 1,064 (0%) | 3mo | $214,900 | $202 | 86 |
| 1019 Old Cowan Rd | 0.33mi | 3/2.0 | 1,036 (-3%) | 2mo | $211,900 | $205 | 75 |
| 711 Hunt St | 0.16mi | 3/2.0 | 1,176 (+10%) | 2mo | $215,975 | $184 | 70 |
| 1015 Old Cowan Rd | 0.32mi | 3/2.0 | 1,032 (-3%) | 12mo | $200,000 | $194 | 66 |
| 707 Hunt St | 0.14mi | 3/2.0 | 1,176 (+10%) | 10mo | $221,400 | $188 | 64 |
| 103 Dalewood Dr | 0.55mi | 3/1.5 | 1,120 (+5%) | 2mo | $188,000 | $168 | 62 |
| 816 S High St | 0.63mi | 3/1.0 | 1,100 (+3%) | 8mo | $170,000 | $155 | 59 |
| 104 3rd Ave NW | 0.54mi | 2/1.0 (-1) | 999 (-6%) | 11mo | $185,000 | $185 | 50 |
| 1506 Old Cowan Rd | 0.68mi | 2/1.0 (-1) | 996 (-6%) | 3mo | $180,000 | $181 | 50 |
| 804 Pleasant View Dr | 0.48mi | 4/2.0 (+1) | 1,148 (+8%) | 6mo | $220,000 | $192 | 50 |
| 100 Mt View Dr | 0.54mi | 3/1.0 | 960 (-10%) | 12mo | $173,500 | $181 | 48 |
Match score weights: distance 35% · size 25% · config 20% · recency 20%. Top-matched comps best support the ARV.
Projected returns pro-forma
-3.0% appreciation · 3.0% rent growth · sell at horizon
- IRR
- 1.3%
- Equity multiple
- 1.05×
- Total profit
- $2,642
- Equity at exit
- $28,181
- IRR
- 10.9%
- Equity multiple
- 1.85×
- Total profit
- $44,900
- Equity at exit
- $16,341
Cash invested: $52,920 (down + closing). Projections, not guarantees.
Landlord ↔ Tenant lean methodology
- Overall (STATE)
- 87 Strongly Landlord-Friendly
- State Tennessee
- 87 Strongly Landlord-Friendly · R+13
- County
- — inherits STATE
- City
- — inherits STATE
ZIP-level market 37398
- Home prices YoY
- -21.1%
- Active inventory
- 325
- Price-to-rent
- 7.6×
Monthly cashflow live
- Estimated rent
- $2,075 medium interval (Pro) →
- Mortgage (P&I)
- −$991
- Tax from tax record
- −$46 /mo · $547/yr
- Insurance
- −$79
- HOA
- −$0
- Vacancy / Maint / Mgmt
- −$436
- Net cashflow
- $524
Break-even live
Sensitivity live
| Price | -10% $631 | -5% $577 | +0% $524 | +5% $470 | +10% $417 |
|---|---|---|---|---|---|
| Rent | -10% $360 | -5% $442 | +0% $524 | +5% $606 | +10% $688 |
| Rate | -1.0pp $619 | -0.5pp $572 | base $524 | +0.5pp $475 | +1.0pp $425 |
UW: 25.0% down · 7.5% · 30yr · 1.5% tax · 5.0% vac · 8.0% maint · 8.0% mgmt
Financing live
Cash to close
- Down payment
- $47,250
- Closing costs
- $5,670
- Reserves months
- —
- Total cash needed
- —
Loan-product check · same deal, 3 products live
Conventional
25% down · 7.5% · 30yr
- Down + closing
- —
- Monthly P&I
- —
- Monthly cashflow
- —
- DSCR
- —
- Eligible?
- —
Personal DTI + credit; lowest rate.
DSCR
20% down · 8.5% · 30yr
- Down + closing
- —
- Monthly P&I
- —
- Monthly cashflow
- —
- DSCR
- —
- Eligible?
- —
No personal income docs; deal must DSCR.
Hard money
10% down · 12.0% · 12mo
- Down + closing
- —
- Monthly P&I
- —
- Monthly cashflow
- —
- DSCR
- —
- Eligible?
- —
Short-term bridge; refi at stabilization.
Listing history 8 events
-
2026-05-03historical Active Under Contract
-
2026-05-02price $189,000
-
2026-04-08price $199,000
-
2026-03-08price $209,900
-
2026-02-25price $214,900
-
2026-02-10price $219,000
-
2026-02-04$224,900 Active
-
2019-07-15soldstatus $46,000
ⓘ Source: listings_history table (triggers on properties + properties_extension) + one-shot
backfill from property_details.listing_events for pre-trigger history.
Tax reassessment forecast TN · Resets to sale price
- Current annual tax
- $547 · $46/mo
- Projected year-2 tax
- $1,342 · $112/mo
- Expected delta
- +$795/yr (+$66/mo · 145.3%)
ⓘ Screening estimate from a state-policy table — verify with the county assessor before closing.
Climate risk First Street
- Flood 6/10 Major FEMA zone X (unshaded) · 73% chance over 30 yrs
- Wildfire 1/10 Low
- Heat 5/10 Major 7 d/yr ≥104°F today · 20 d/yr by 30 yrs out
- Wind 4/10 Moderate 12% chance of damaging wind over 30 yrs
- Air quality 2/10 Low 2 unhealthy d/yr today · 2 by 30 yrs out
Nearby sold comps map
Loading sold comps map…
Walkable amenities ~0.75 mi
Loading nearby amenities…
Taxation est. · year 1
- Rental income
- $24,899
- − Mortgage interest
- −$10,587
- − Property taxes
- −$547
- − Insurance
- −$945
- − Repairs & maintenance
- −$1,992
- − Management
- −$1,992
- − Depreciation
- −$5,498
- Taxable income
- $3,338
- Est. tax owed @ 24.0%
- −$801
- After-tax cash flow
- $5,483/yr
For passive investors: Depreciation is non-cash, so a rental often shows a tax loss while cash-flowing — sheltering income. Rental losses are passive: they offset passive income freely, and up to $25,000/yr can offset ordinary (W-2) income if you actively participate and your MAGI is under $100k (phasing out to $0 by $150k); unused losses carry forward. On sale, claimed depreciation is recaptured at up to 25%, and gains may owe capital-gains tax (a 1031 exchange can defer both). Figures are a year-1 estimate at your 24.0% rate — not tax advice; consult a CPA.
Schools (NCES district)
- District
- Franklin County
- NCES district ID
- 4701290
- Math proficiency
- 18% ▼ -9.00%
- Reading proficiency
- 22% ▼ -8.00%
- Median HH income
- $43,108
- Composite
- 17.24/100
- National rank
- #9094
- State rank
- #111 of 139 in TN
Livability — Winchester
- Score
- 65/100
- State rank
- #149
- US rank
- #13341
Category grades
Schools grade is shown separately in the Schools card above.
Census & demographics
- Census place
- Winchester, TN
- Population (ZIP)
- 15,712
Population outlook (Franklin County) Hauer SSP2
- Today (2025)
- 42,858 people
- By 2030
- 43,540 · +1.6%
- By 2040
- 44,623 · +4.1%
- By 2050
- 45,523 · +6.2%
- By 2075
- 48,954 · +14.2%
- By 2100
- 50,170 · +17.1%
Race, ethnicity, and origin ACS 2023
- Neighborhood character
- Predominantly White (81%)
- Race & ethnicity
- White 81% Hispanic / Latino 7% Black 7% Two or more races 6% Asian 1%
- Hispanic origin (detail)
- Mexican 4%
- Common ancestry
- Serbian 2% Lithuanian 2% Slovak 1%
- Foreign-born
- 4% · Canada
- Languages at home
- 93% English-only · Spanish 5% Other Indo-European 1% German/W. Germanic 1%
Political lean MEDSL · Franklin
- 2024 margin
- Solid R (+53.2) · D 23.0% · R 76.1%
- 2008→2024 swing
- -30.6pp toward R · 2008: -22.5pp · 2024: -53.2pp
- All cycles
- 2024: R+53.2 2020: R+47.7 2016: R+43.7 2012: R+28.9 2008: R+22.5
Not yet ingested
- Civics
- —
Market trends
- HPI YoY
- ▼ -89.03%
- Current HPI
- 333.839
- Rent YoY
- —
- Metro
- —
- State GDP YoY
- ▲ 2.78%
- F500 in state
- 22
Industry mix (Fortune 500 HQ in TN)
| Industry | F500 HQs | Revenue |
|---|---|---|
| Healthcare | 3 | $91B |
|
||
| Retail | 3 | $72B |
|
||
| Transportation / Logistics | 1 | $88B |
|
||
| Paper / Packaging | 1 | $19B |
|
||
| Insurance | 1 | $13B |
|
||
| Energy | 1 | $12B |
|
||
Price history
+310.9% since first listed8 events — show timeline
- 2026-05-03 Contingent — REALTRACS as Distributed by MLS Grid
- 2026-05-02 Price Changed $189,000 REALTRACS as Distributed by MLS Grid
- 2026-04-08 Price Changed $199,000 REALTRACS as Distributed by MLS Grid
- 2026-03-08 Price Changed $209,900 REALTRACS as Distributed by MLS Grid
- 2026-02-25 Price Changed $214,900 REALTRACS as Distributed by MLS Grid
- 2026-02-10 Price Changed $219,000 REALTRACS as Distributed by MLS Grid
- 2026-02-04 Listed $224,900 REALTRACS as Distributed by MLS Grid
- 2019-07-15 Sold (Public Records) $46,000 Public Records
Property tax history
+4.8%/yrLatest (2025): $547 · +0.0% YoY. Source: county tax records.
Cash-flow waterfall
monthlySold comps — $/sqft
last 12 mo · ≤1 miLoading sold comps…