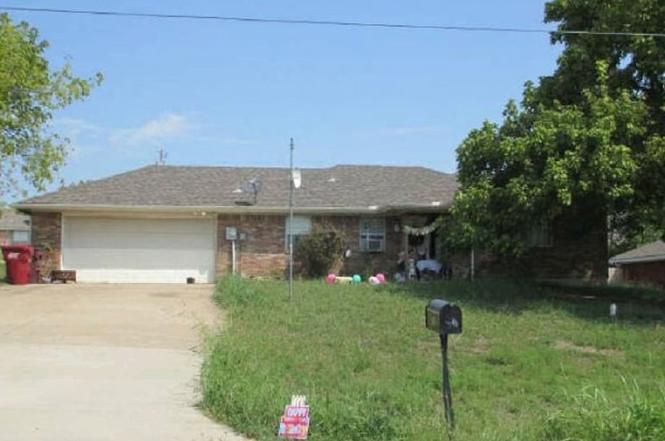
300 Ridgeway Dr · Blue Ridge, TX
Flood risk 1/10 · Minimal
- FEMA flood zone
- X (unshaded)
- Chance of flooding over 30 yrs
- 0.0%
- Est. flood insurance / yr
- $507 – $1,088
Fire risk 7/10 · Major
- Est. fire insurance / yr
- $1,222 – $2,270
Heat risk 7/10 · Major
- Hot days now (above 110°F)
- 7 days/yr
- Hot days in 30 yrs
- 23 days/yr
Wind risk 6/10 · Moderate
- Chance of severe wind over 30 yrs
- 27.0%
Air-quality risk 2/10 · Minimal
- Unhealthy air days now
- 2 days/yr
- Unhealthy air days in 30 yrs
- 2 days/yr
Risk factors via First Street. Map © Google.
Why this score? — see what drove the D+ grade
The composite is a weighted blend of 9 inputs, each scored 0–100. Each bar is that input's sub-score; the figure is the points it added to the 100-point composite (weight × sub-score).
- ARV discount +15.0/15.0
- Appreciation +10.0/10.0
- Cash flow +7.1/30.0
- Schools +4.4/10.0
- 1% rule +3.4/10.0
- Livability +2.8/5.0
- Rent growth +2.5/5.0
- Condition / age +2.5/5.0
- DSCR +1.3/10.0
$167,400
🖨 Deal sheet (PDF) 📄 Offer letter ✓ Due diligence
Listing remarks
Property is a 3 bedroom 2 bathroom home.
Key facts
- 0.26 acre lot
- 2 garage spots
- Built 2000
Property features AI
Exterior
- Parking: Attached garage with 2 parking spaces
- Utilities: Public water
- Home design: Residential property; One-story entry (first-floor living)
- Construction: Built in 2000; Brick and wood siding exterior; Composition roof; Slab foundation
- Exterior features: Located in a subdivision
Interior
- Bedrooms: Primary bedroom on the first floor (11x10); Two additional first-floor bedrooms (12x9; 10x9)
- Bathrooms: 2 full bathrooms
- Heating & cooling: Central electric heating; Central electric cooling (central air)
- Interior features: 3 total rooms
Neighborhood map
What this means for you Summary
Snapshot
- This is a 3-bed/2.0-bath single-family listed at $167k.
Deal economics
- At list price, monthly cash flow is $-236 ($-3k/yr) — negative.
- To cash-flow at today's rent, offer at most $126k (24.9% below list).
- To meet the 1% rule (rent ≥ 1% of price), the offer needs to be $140k (16.1% below list).
- Recommended offer: $126k (24.9% below list) — sets the bar for cash-flow.
- Cap rate 4.6% vs local median 3.5% in Blue Ridge — top-decile yield for the area; either an underpriced asset or a hidden risk that comps aren't pricing in. Stress-test before assuming the spread holds.
Location & tenants
- Location reads 56/100 on livability (#1,305 in TX) — a working-class tenant base; expect higher turnover. Strengths: cost of living A+, housing A+; Watch: crime D+, amenities F, commute F.
- Blue Ridge ISD (rural): math 52% / reading 50% proficiency, ranked #154 of 826 in TX (top 19%) — acceptable for families but not a draw, mixed tenant base, ~2y average lease.
- Zoned schools: Blue Ridge El (math 57% / reading 52%, grade C, #621 of 4,322 statewide, top 15%, 478 students, 51% FRL); Blue Ridge Middle (math 52% / reading 47%, grade C, #356 of 1,662 statewide, top 23%, 213 students, 51% FRL); Blue Ridge H S (math 37% / reading 47%, grade F, #730 of 1,632 statewide, top 47%, 318 students, 50% FRL).
- Market conditions: 207 active listings in the ZIP; 8 comparable units currently listed for rent nearby; rentals leasing fast (median 0d on market — plan ~1-2 weeks tenant-placement turnaround); 19,194 units permitted in Collin County in 2024 (3,988 in 5+ unit buildings).
Forward outlook
- In year one you build about $18k of equity ($1k loan paydown + $17k appreciation (10.0% local appreciation)).
- Collin County population projected at +60% by 2050 — long-run rental-demand tailwind backs the buy-and-hold thesis.
- By year 3, paydown + projected appreciation supports a ~$45k cash-out refi (75% LTV) — recoverable capital for the next deal without selling this one.
Negotiation context
- It's been on market 128 days — a 12% lower offer ($147k) is reasonable based on typical stale-listing flexibility.
- 4 sale attempts since 17y ago; this cycle's ask has dropped $19k (10%) from the opening price — seller is motivated, your offer sets the floor, not the list.
Risks & watch-outs
- Watch-outs: property tax is 2.9% of price.
- Climate carrying-cost: major wind risk, 27% chance of damaging wind over 30y; major wildfire risk; extreme-heat days projected 7→23/yr by 2055 (HVAC capex compounding) — expect insurance premiums to compound above CPI over the hold.
Questions for the listing agent
- What do current leases actually rent for vs. the listed asking? Can we see a recent rent roll and the last 12 months of T-12 income?
- It's been on market 128 days. Have you received any prior offers? Is the seller open to a 25% concession, seller financing, or rate buy-down credit?
- Property tax is high relative to price — has the assessment been appealed recently, and will the sale trigger a re-assessment?
- Why hasn't it sold? Are there any deal-killer items the seller is aware of (foundation, flood, title, zoning, code violations)?
- Is there a deadline driving the sale (1031 exchange, divorce, estate, relocation)? That informs how much negotiation room exists.
- Crime grade is D in this area — have there been break-ins, vandalism, or insurance claims at this property in the last 3 years? What carrier currently insures it and at what premium?
- The area grade is low — what's the realistic commute time and amenity access for the typical tenant pool here? Any planned neighborhood developments (good or bad) we should know about?
- What's the average days-on-market for RENTAL listings here right now (not sales)? A rising rental-DOM trend means longer vacancies and softer asking-rent achievability than the comps imply.
- What's the recent tenant-quality profile in this submarket — average credit score on applications, eviction rate, late-payment / NSF rate, and stable-employment percentage? A property-management company in the area should have these aggregated.
- How much new for-sale + rental construction is in the pipeline within 1–3 miles? Heavy new supply typically softens prices + rents 12–24 months out; constrained supply supports both.
Investment metrics
- 1% rule
- 0.84% ✗
- Cap rate
- 4.60%
- Cash-on-cash
- -6.05%
- DSCR
- 0.73
- GRM
- 9.9
CMA / ARV
- ARV (on-the-fly)
- $236,649
- Comps found
- 7
Show comp detail 7 sales within ~0.75 mi
| Address | Dist | Beds/Ba | Sqft | Sold | Price | $/sf | Match |
|---|---|---|---|---|---|---|---|
| 300 Ridgeway Dr | 0.00mi | 3/2.0 | 1,239 (0%) | 1mo | $167,400 | $135 | 99 |
| 210 S Crestside Dr | 0.13mi | 3/2.0 | 1,267 (+2%) | 12mo | $299,900 | $237 | 80 |
| 203 Hilltop Cir | 0.06mi | 3/2.0 | 1,325 (+7%) | 14mo | $270,000 | $204 | 74 |
| 219 Ridgetop Ct | 0.07mi | 3/2.0 | 1,369 (+10%) | 6mo | $261,500 | $191 | 74 |
| 100 Beryl Ln | 0.37mi | 3/2.0 | 1,200 (-3%) | 9mo | $219,000 | $183 | 70 |
| 399 S Main St | 0.33mi | 3/2.0 | 1,363 (+10%) | 1mo | $300,000 | $220 | 67 |
| 305 N Church St | 0.43mi | 2/1.0 (-1) | 1,056 (-15%) | 1mo | $183,000 | $173 | 46 |
Match score weights: distance 35% · size 25% · config 20% · recency 20%. Top-matched comps best support the ARV.
Projected returns pro-forma
10.0% appreciation · 3.0% rent growth · sell at horizon
- IRR
- 20.0%
- Equity multiple
- 2.63×
- Total profit
- $76,254
- Equity at exit
- $150,807
- IRR
- 18.3%
- Equity multiple
- 6.05×
- Total profit
- $236,667
- Equity at exit
- $325,221
Cash invested: $46,872 (down + closing). Projections, not guarantees.
Landlord ↔ Tenant lean methodology
- Overall (STATE)
- 87 Strongly Landlord-Friendly
- State Texas
- 87 Strongly Landlord-Friendly · R+5
- County
- — inherits STATE
- City
- — inherits STATE
ZIP-level market 75424
- Home prices YoY
- 8.3%
- Active inventory
- 207
- Price-to-rent
- 9.9×
Monthly cashflow live
- Estimated rent
- $1,405 high interval (Pro) →
- Mortgage (P&I)
- −$878
- Tax from tax record
- −$399 /mo · $4,784/yr
- Insurance
- −$70
- HOA
- −$0
- Vacancy / Maint / Mgmt
- −$295
- Net cashflow
- $-236
Break-even live
Sensitivity live
| Price | -10% $-142 | -5% $-189 | +0% $-236 | +5% $-284 | +10% $-331 |
|---|---|---|---|---|---|
| Rent | -10% $-347 | -5% $-292 | +0% $-236 | +5% $-181 | +10% $-125 |
| Rate | -1.0pp $-152 | -0.5pp $-194 | base $-236 | +0.5pp $-280 | +1.0pp $-324 |
UW: 25.0% down · 7.5% · 30yr · 1.5% tax · 5.0% vac · 8.0% maint · 8.0% mgmt
Financing live
Cash to close
- Down payment
- $41,850
- Closing costs
- $5,022
- Reserves months
- —
- Total cash needed
- —
Loan-product check · same deal, 3 products live
Conventional
25% down · 7.5% · 30yr
- Down + closing
- —
- Monthly P&I
- —
- Monthly cashflow
- —
- DSCR
- —
- Eligible?
- —
Personal DTI + credit; lowest rate.
DSCR
20% down · 8.5% · 30yr
- Down + closing
- —
- Monthly P&I
- —
- Monthly cashflow
- —
- DSCR
- —
- Eligible?
- —
No personal income docs; deal must DSCR.
Hard money
10% down · 12.0% · 12mo
- Down + closing
- —
- Monthly P&I
- —
- Monthly cashflow
- —
- DSCR
- —
- Eligible?
- —
Short-term bridge; refi at stabilization.
Rent comps 8 comps
| Address | Beds | Baths | Sqft | Rent | $/sqft | DOM | Units | Dist |
|---|---|---|---|---|---|---|---|---|
| 223 E Pritchard #225 Blue Ridge, TX | 2.0 | 2.0 | 1050 | $1,350 | $1.29 | 45d | 1 | 0.20mi |
| 219 E Pritchard Ln Unit 219 Blue Ridge, TX | 2.0 | 2.0 | 1050 | $1,000 | $0.95 | 26d | 1 | 0.21mi |
| 505 S Texas 78 Business Unit 78 Blue Ridge, TX | 2.0 | 1.0 | 800 | $1,495 | $1.87 | 0d | 1 | 0.31mi |
| 6 Bowling Ln Blue Ridge, TX | 3.0 | 3.0 | 1442 | $1,750 | $1.21 | 0d | 1 | 0.37mi |
| 303 W Davis St Blue Ridge, TX | 2.0 | 1.0 | 828 | $1,400 | $1.69 | 26d | 1 | 0.37mi |
| 303 W Davis St Blue Ridge, TX | 2.0 | 1.0 | 828 | $1,400 | $1.69 | 0d | 1 | 0.37mi |
| 2 Bowling Ln Blue Ridge, TX | 3.0 | 2.5 | 1442 | $1,750 | $1.21 | 0d | 1 | 0.37mi |
| 313 N Church St Blue Ridge, TX | 3.0 | 1.0 | 1114 | $1,475 | $1.32 | 0d | 1 | 0.45mi |
Listing history 16 events
-
2026-04-29status Pending
-
2026-04-10price $167,400
-
2025-12-22$186,300 Active
-
2024-04-26soldstatus
-
2017-12-22soldstatus
-
2016-09-16soldstatus
-
2015-05-04soldstatus
-
2014-12-01soldstatus
-
2014-10-31historical
-
2014-10-06$114,500
-
2014-06-23historical
-
2014-04-18$89,000 Active
-
2009-12-04soldstatus
-
2009-11-19historical
-
2009-10-30$82,900
-
2005-07-08soldstatus
ⓘ Source: listings_history table (triggers on properties + properties_extension) + one-shot
backfill from property_details.listing_events for pre-trigger history.
Tax reassessment forecast TX · Resets to sale price
- Current annual tax
- $4,784 · $399/mo
- Projected year-2 tax
- $4,784 · $399/mo
- Expected delta
- $0/yr ($0/mo · 0.0%)
ⓘ Screening estimate from a state-policy table — verify with the county assessor before closing.
Climate risk First Street
- Flood 1/10 Low FEMA zone X (unshaded) · 0% chance over 30 yrs
- Wildfire 7/10 Severe
- Heat 7/10 Severe 7 d/yr ≥110°F today · 23 d/yr by 30 yrs out
- Wind 6/10 Major 27% chance of damaging wind over 30 yrs
- Air quality 2/10 Low 2 unhealthy d/yr today · 2 by 30 yrs out
Nearby sold comps map
Loading sold comps map…
Walkable amenities ~0.75 mi
Loading nearby amenities…
Taxation est. · year 1
- Rental income
- $16,860
- − Mortgage interest
- −$9,377
- − Property taxes
- −$4,784
- − Insurance
- −$837
- − Repairs & maintenance
- −$1,349
- − Management
- −$1,349
- − Depreciation
- −$4,870
- Taxable loss
- −$5,706
- Est. tax savings @ 24.0%
- +$1,369
- After-tax cash flow
- $-1,467/yr
For passive investors: Depreciation is non-cash, so a rental often shows a tax loss while cash-flowing — sheltering income. Rental losses are passive: they offset passive income freely, and up to $25,000/yr can offset ordinary (W-2) income if you actively participate and your MAGI is under $100k (phasing out to $0 by $150k); unused losses carry forward. On sale, claimed depreciation is recaptured at up to 25%, and gains may owe capital-gains tax (a 1031 exchange can defer both). Figures are a year-1 estimate at your 24.0% rate — not tax advice; consult a CPA.
Schools (NCES district)
- District
- Blue Ridge ISD
- NCES district ID
- 4810590
- Math proficiency
- 52% ▼ -5.00%
- Reading proficiency
- 50% ▬ 0.00%
- Median HH income
- $53,738
- Composite
- 43.99/100
- National rank
- #2894
- State rank
- #154 of 826 in TX
Livability — Blue Ridge
- Score
- 56/100
- State rank
- #1305
- US rank
- #22618
Category grades
Schools grade is shown separately in the Schools card above.
Census & demographics
- Census place
- Blue Ridge, TX
- City population
- 3,908
- Population (ZIP)
- 3,908
Population outlook (Collin County) Hauer SSP2
- Today (2025)
- 1,210,074 people
- By 2030
- 1,358,201 · +12.2%
- By 2040
- 1,654,061 · +36.7%
- By 2050
- 1,937,359 · +60.1%
- By 2075
- 2,567,039 · +112.1%
- By 2100
- 2,952,048 · +144.0%
Race, ethnicity, and origin ACS 2023
- Neighborhood character
- Predominantly White (68%)
- Race & ethnicity
- White 68% Hispanic / Latino 24% Two or more races 10% Asian 3%
- Hispanic origin (detail)
- Mexican 21%
- Common ancestry
- Italian 6% Lithuanian 3% Slovak 2%
- Foreign-born
- 9% · Canada
- Languages at home
- 82% English-only · Spanish 16% Tagalog/Filipino 2%
Political lean MEDSL · Collin
- 2024 margin
- R (+11.1) · D 43.1% · R 54.3% · Other 2.6%
- 2008→2024 swing
- +14.4pp toward D · 2008: -25.6pp · 2024: -11.1pp
- All cycles
- 2024: R+11.1 2020: R+4.3 2016: R+17.0 2012: R+31.6 2008: R+25.6
Not yet ingested
- Civics
- —
Market trends
- HPI YoY
- ▲ 27.07%
- Current HPI
- 354.45
- Rent YoY
- —
- Metro
- —
- State GDP YoY
- ▲ 3.95%
- F500 in state
- 110
Industry mix (Fortune 500 HQ in TX)
| Industry | F500 HQs | Revenue |
|---|---|---|
| Energy | 16 | $1,198B |
|
||
| Technology | 5 | $198B |
|
||
| Engineering / Construction | 4 | $72B |
|
||
| Energy Services | 3 | $60B |
|
||
| Utilities | 3 | $41B |
|
||
| Healthcare | 2 | $330B |
|
||
Price history
+101.9% since first listed16 events — show timeline
- 2026-04-29 Pending — HARMLS
- 2026-04-10 Price Changed $167,400 HARMLS
- 2025-12-22 Listed $186,300 HARMLS
- 2024-04-26 Sold (Public Records) — Public Records
- 2017-12-22 Sold (Public Records) — Public Records
- 2016-09-16 Sold (Public Records) — Public Records
- 2015-05-04 Sold (Public Records) — Public Records
- 2014-12-01 Sold (Public Records) — Public Records
- 2014-10-31 Listing Removed — NTREIS
- 2014-10-06 Listed $114,500 NTREIS
- 2014-06-23 Listing Removed — NTREIS
- 2014-04-18 Listed $89,000 NTREIS
- 2009-12-04 Sold (MLS) — NTREIS
- 2009-11-19 Listing Removed — NTREIS
- 2009-10-30 Listed $82,900 NTREIS
- 2005-07-08 Sold (Public Records) — Public Records
Property tax history
+6.0%/yrLatest (2025): $4,784 · -8.3% YoY. Source: county tax records.
Cash-flow waterfall
monthlySold comps — $/sqft
last 12 mo · ≤1 miLoading sold comps…