 Multi-family
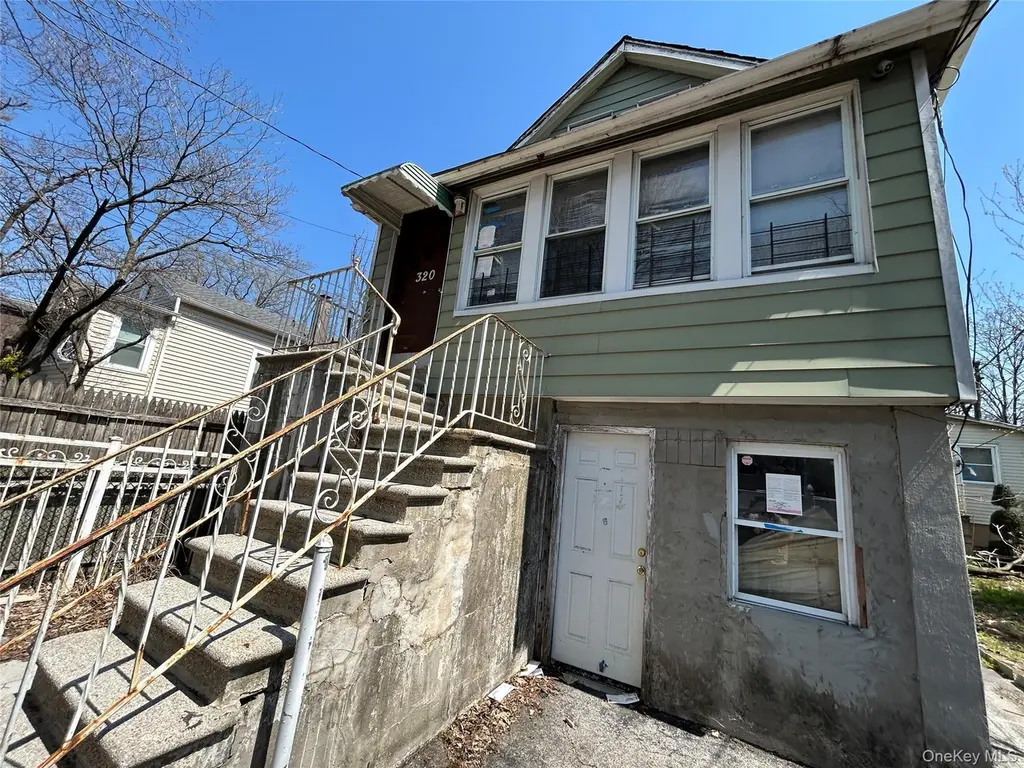
320 Thieriot Ave · New York, NY
Flood risk 8/10 · Major
- FEMA flood zone
- X (shaded)
- Chance of flooding over 30 yrs
- 0.99%
- Est. flood insurance / yr
- $507 – $1,088
Fire risk 1/10 · Minimal
- Est. fire insurance / yr
- $691 – $1,283
Heat risk 7/10 · Major
- Hot days now (above 99°F)
- 7 days/yr
- Hot days in 30 yrs
- 15 days/yr
Wind risk 6/10 · Moderate
- Chance of severe wind over 30 yrs
- 27.0%
Air-quality risk 4/10 · Minor
- Unhealthy air days now
- 5 days/yr
- Unhealthy air days in 30 yrs
- 6 days/yr
Risk factors via First Street. Map © Google.
Why this score? — see what drove the B- grade
The composite is a weighted blend of 9 inputs, each scored 0–100. Each bar is that input's sub-score; the figure is the points it added to the 100-point composite (weight × sub-score).
- Cash flow +25.0/30.0
- ARV discount +15.0/15.0
- DSCR +8.1/10.0
- 1% rule +6.1/10.0
- Schools +5.0/10.0
- Livability +3.8/5.0
- Rent growth +2.5/5.0
- Condition / age +2.5/5.0
- Appreciation +0.0/10.0
$600,000
🖨 Deal sheet (PDF) 📄 Offer letter ✓ Due diligence
Multi-family units
County records classify this as Multi-Family (2-4 Unit). Listing-text estimate: 1 unit. estimate disagrees with records
Listing remarks
Short sale subject to bank approval
Key facts
- 5,000 sq ft lot
- Built 1930
- Listed 62 days
Property features AI
Exterior
- Parking: On-street parking
- Utilities: Public sewer; No listed utilities
- Home design: Quadruplex
- Construction: Frame construction
- Exterior features: Frame construction; Not waterfront
Interior
- Heating & cooling: Electric cooling; Oil heating
- Interior features: First-floor bedroom; First-floor full bathroom; Unfinished basement
Neighborhood map
What this means for you Summary
Snapshot
- This is a multifamily listed at $600k.
Deal economics
- At list price, monthly cash flow is $1k ($15k/yr) — positive.
- The deal already cash-flows at list — no discount required.
- Meets the 1% rule at list price ($7k rent vs $600k).
- Recommended offer: $564k (6.0% below list) — sets the bar for market timing.
- Cap rate 8.9% vs local median 2.6% in New York — top-decile yield for the area; either an underpriced asset or a hidden risk that comps aren't pricing in. Stress-test before assuming the spread holds.
Location & tenants
- Location reads 75/100 on livability (#268 in NY, #4,188 nationally) — a middle-class / working-renter tenant base. Strengths: amenities A+, commute A+, health & safety A; Watch: crime F, cost of living F.
- Market conditions: 141 active listings in the ZIP; 6,929 units permitted in Bronx County in 2024 (6,829 in 5+ unit buildings).
- At $6,665/mo this rent would consume 152% of the median local household income ($52k/yr) (locally 3913% of renters already pay >50% of income on rent) — very limited rent-growth headroom before tenants either downsize or default.
Forward outlook
- Local home prices are declining (-3.0%/yr); year-one equity from $4k of loan paydown is wiped out by about $18k of value loss. Plan a longer hold.
- Bronx County population projected at +21% by 2050 — long-run rental-demand tailwind backs the buy-and-hold thesis.
Negotiation context
- It's been on market 62 days — a 6% lower offer ($564k) is reasonable based on typical stale-listing flexibility.
- Current owner paid $150k; list at $600k implies a 300% gain — meaningful room to come down on a strong offer.
Risks & watch-outs
- Watch-outs: flood insurance adds $66/mo; built in 1930 — expect roof / HVAC / electrical / plumbing capex.
- Climate carrying-cost: severe flood risk; major wind risk, 27% chance of damaging wind over 30y; extreme-heat days projected 7→15/yr by 2055 (HVAC capex compounding) — expect insurance premiums to compound above CPI over the hold.
Questions for the listing agent
- It's been on market 62 days. Have you received any prior offers? Is the seller open to a 6% concession, seller financing, or rate buy-down credit?
- Built in 1930 — when were the roof, HVAC, electrical panel, plumbing, and water heater last replaced?
- What's the actual annual flood-insurance premium (NFIP or private), and is the property in a SFHA with mandatory coverage?
- Why hasn't it sold? Are there any deal-killer items the seller is aware of (foundation, flood, title, zoning, code violations)?
- Is there a deadline driving the sale (1031 exchange, divorce, estate, relocation)? That informs how much negotiation room exists.
- Schools are B-rated — typically a magnet for longer-tenancy family renters. What's the average tenant stay here, and is there a school-zone premium baked into asking?
- Crime grade is F in this area — have there been break-ins, vandalism, or insurance claims at this property in the last 3 years? What carrier currently insures it and at what premium?
- What's the average days-on-market for RENTAL listings here right now (not sales)? A rising rental-DOM trend means longer vacancies and softer asking-rent achievability than the comps imply.
- What's the recent tenant-quality profile in this submarket — average credit score on applications, eviction rate, late-payment / NSF rate, and stable-employment percentage? A property-management company in the area should have these aggregated.
- How much new apartment / multifamily construction is in the pipeline within 1–3 miles? Heavy new supply (>2% of stock underway) typically softens rents 12–24 months out; light construction supports rent growth.
Investment metrics
- 1% rule
- 1.11% ✓
- Cap rate
- 8.89%
- Cash-on-cash
- 9.29%
- DSCR
- 1.41
- GRM
- 7.5
CMA / ARV
- ARV (on-the-fly)
- $966,850
- Comps found
- 12
Show comp detail 12 sales within ~0.75 mi
| Address | Dist | Beds/Ba | Sqft | Sold | Price | $/sf | Match |
|---|---|---|---|---|---|---|---|
| 410 Thieriot Ave | 0.13mi | 7/3.0 | 3,110 (+2%) | 6mo | $925,000 | $297 | 86 |
| 1815 Patterson Ave | 0.14mi | 5/2.0 | 2,625 (-14%) | 2mo | $752,200 | $287 | 68 |
| 622 Rosedale Ave | 0.51mi | —/— | 3,075 (+1%) | 12mo | $873,000 | $284 | 65 |
| 454 Commonwealth Ave | 0.24mi | 7/3.0 | 2,730 (-10%) | 10mo | $920,000 | $337 | 63 |
| 535 Saint Lawrence Ave | 0.37mi | 3/— | 2,760 (-10%) | 10mo | $999,000 | $362 | 58 |
| 1754 Seward Ave | 0.57mi | 8/4.0 | 3,218 (+6%) | 7mo | $1,035,000 | $322 | 58 |
| 566 Bolton Ave | 0.40mi | 6/2.0 | 2,800 (-8%) | 13mo | $900,000 | $321 | 56 |
| 643 Underhill Ave | 0.49mi | 3/3.0 | 2,748 (-10%) | 6mo | $855,000 | $311 | 56 |
| 485 Commonwealth Ave | 0.31mi | 7/3.0 | 2,650 (-13%) | 10mo | $840,000 | $317 | 56 |
| 422 Screvin Ave | 0.51mi | 8/3.0 | 2,795 (-8%) | 10mo | $999,999 | $358 | 54 |
| 1894 Seward Ave | 0.55mi | 5/3.0 | 2,748 (-10%) | 8mo | $850,000 | $309 | 52 |
| 2067 Seward Ave | 0.73mi | 6/2.0 | 2,680 (-12%) | 5mo | $850,000 | $317 | 42 |
Match score weights: distance 35% · size 25% · config 20% · recency 20%. Top-matched comps best support the ARV.
Projected returns pro-forma
-3.0% appreciation · 3.0% rent growth · sell at horizon
- IRR
- -2.9%
- Equity multiple
- 0.89×
- Total profit
- $-18,597
- Equity at exit
- $89,462
- IRR
- 6.8%
- Equity multiple
- 1.51×
- Total profit
- $85,135
- Equity at exit
- $51,877
Cash invested: $168,000 (down + closing). Projections, not guarantees.
Landlord ↔ Tenant lean methodology
- Overall (CITY)
- 0 Strongly Tenant-Friendly
- State New York
- 15 Strongly Tenant-Friendly · D+10
- County
- — inherits STATE
- City New York
- 0 Strongly Tenant-Friendly · D+34
ZIP-level market 10473
- Active inventory
- 141
- Price-to-rent
- 15.0×
Monthly cashflow live
- Estimated rent
- $6,665 medium interval (Pro) →
- Mortgage (P&I)
- −$3,146
- Tax from tax record
- −$568 /mo · $6,820/yr
- Insurance
- −$250
- Flood insurance flood zone
- −$66 /mo · $798/yr
- HOA
- −$0
- Vacancy / Maint / Mgmt
- −$1,400
- Net cashflow
- $1,234
Break-even live
Sensitivity live
| Price | -10% $1,574 | -5% $1,404 | +0% $1,234 | +5% $1,064 | +10% $894 |
|---|---|---|---|---|---|
| Rent | -10% $708 | -5% $971 | +0% $1,234 | +5% $1,497 | +10% $1,761 |
| Rate | -1.0pp $1,536 | -0.5pp $1,387 | base $1,234 | +0.5pp $1,079 | +1.0pp $920 |
2-unit breakdown (identical units grouped — click to expand)
| Units | Beds | Baths | Est. rent |
|---|---|---|---|
| 2× units | 2 | 1 | $6,666 |
| #1 | 2 | 1 | $3,333 |
| #2 | 2 | 1 | $3,333 |
| Total (2 units) | $6,665 | ||
UW: 25.0% down · 7.5% · 30yr · 1.5% tax · 5.0% vac · 8.0% maint · 8.0% mgmt
Financing live
Cash to close
- Down payment
- $150,000
- Closing costs
- $18,000
- Reserves months
- —
- Total cash needed
- —
Loan-product check · same deal, 3 products live
Conventional
25% down · 7.5% · 30yr
- Down + closing
- —
- Monthly P&I
- —
- Monthly cashflow
- —
- DSCR
- —
- Eligible?
- —
Personal DTI + credit; lowest rate.
DSCR
20% down · 8.5% · 30yr
- Down + closing
- —
- Monthly P&I
- —
- Monthly cashflow
- —
- DSCR
- —
- Eligible?
- —
No personal income docs; deal must DSCR.
Hard money
10% down · 12.0% · 12mo
- Down + closing
- —
- Monthly P&I
- —
- Monthly cashflow
- —
- DSCR
- —
- Eligible?
- —
Short-term bridge; refi at stabilization.
Listing history 15 events
-
2026-06-21days on market $600,000 Active 62 DOM
-
2026-06-18days on market $600,000 Active 59 DOM
-
2026-06-17days on market $600,000 Active 58 DOM
-
2026-06-16days on market $600,000 Active 57 DOM
-
2026-06-15days on market $600,000 Active 56 DOM
-
2026-06-13days on market $600,000 Active 54 DOM
-
2026-06-10days on market $600,000 Active 50 DOM
-
2026-06-08days on market $600,000 Active 49 DOM
-
2026-06-08days on market $600,000 Active 48 DOM
-
2026-06-04days on market $600,000 Active 45 DOM
-
2026-06-03days on market $600,000 Active 44 DOM
-
2026-06-01days on market $600,000 Active 42 DOM
-
2026-05-31days on market $600,000 Active 41 DOM
-
2026-04-16$600,000 Active
-
1994-05-13soldstatus $150,000
ⓘ Source: listings_history table (triggers on properties + properties_extension) + one-shot
backfill from property_details.listing_events for pre-trigger history.
Tax reassessment forecast NY · Partial reset (capped growth)
- Current annual tax
- $6,820 · $568/mo
- Projected year-2 tax
- $8,480 · $707/mo
- Expected delta
- +$1,660/yr (+$138/mo · 24.3%)
ⓘ Screening estimate from a state-policy table — verify with the county assessor before closing.
Climate risk First Street
- Flood 8/10 Severe FEMA zone X (shaded) · 99% chance over 30 yrs
- Wildfire 1/10 Low
- Heat 7/10 Severe 7 d/yr ≥99°F today · 15 d/yr by 30 yrs out
- Wind 6/10 Major 27% chance of damaging wind over 30 yrs
- Air quality 4/10 Moderate 5 unhealthy d/yr today · 6 by 30 yrs out
Nearby sold comps map
Loading sold comps map…
Walkable amenities ~0.75 mi
Loading nearby amenities…
Taxation est. · year 1
- Rental income
- $79,980
- − Mortgage interest
- −$33,609
- − Property taxes
- −$6,820
- − Insurance
- −$3,798
- − Repairs & maintenance
- −$6,398
- − Management
- −$6,398
- − Depreciation
- −$17,455
- Taxable income
- $5,502
- Est. tax owed @ 24.0%
- −$1,320
- After-tax cash flow
- $13,488/yr
For passive investors: Depreciation is non-cash, so a rental often shows a tax loss while cash-flowing — sheltering income. Rental losses are passive: they offset passive income freely, and up to $25,000/yr can offset ordinary (W-2) income if you actively participate and your MAGI is under $100k (phasing out to $0 by $150k); unused losses carry forward. On sale, claimed depreciation is recaptured at up to 25%, and gains may owe capital-gains tax (a 1031 exchange can defer both). Figures are a year-1 estimate at your 24.0% rate — not tax advice; consult a CPA.
Schools (NCES district)
No district data.
Livability — New York
- Score
- 75/100
- State rank
- #268
- US rank
- #4188
Category grades
Schools grade is shown separately in the Schools card above.
Census & demographics
- Census place
- New York, NY
- County
- Bronx County · 1,197,324 people
- City population
- 7,731,280
- Metro
- New York-Newark-Jersey City, NY-NJ-PA
- Population (ZIP)
- 58,855
- Household income
- $52,462
- Rent vs Own
- Severe rent burden
- 3913.0
Population outlook (Bronx County) Hauer SSP2
- Today (2025)
- 1,607,353 people
- By 2030
- 1,681,852 · +4.6%
- By 2040
- 1,824,421 · +13.5%
- By 2050
- 1,945,470 · +21.0%
- By 2075
- 2,187,887 · +36.1%
- By 2100
- 2,244,136 · +39.6%
Race, ethnicity, and origin ACS 2023
- Neighborhood character
- Majority Hispanic (59%)
- Race & ethnicity
- Hispanic / Latino 59% Black 34% Two or more races 12% Asian 2% White 2%
- Hispanic origin (detail)
- Puerto Rican 31% Dominican 20%
- Common ancestry
- British 1%
- Foreign-born
- 23% · Canada, Jamaica
- Languages at home
- 51% English-only · Spanish 45% Other Indo-European 1% French/Haitian/Cajun 1%
Political lean MEDSL · Bronx
- 2024 margin
- Solid D (+45.4) · D 72.7% · R 27.3%
- 2008→2024 swing
- -32.3pp toward R · 2008: 77.8pp · 2024: 45.4pp
- All cycles
- 2024: D+45.4 2020: D+67.6 2016: D+79.1 2012: D+82.9 2008: D+77.8
Not yet ingested
- Civics
- —
Market trends
- HPI YoY
- ▼ -212.70%
- Current HPI
- 276.2941
- Rent YoY
- —
- Metro
- New York-Newark-Jersey City, NY-NJ-PA
- State GDP YoY
- ▲ 2.60%
- F500 in state
- 92
Industry mix (Fortune 500 HQ in NY)
| Industry | F500 HQs | Revenue |
|---|---|---|
| Financial Services | 10 | $950B |
|
||
| Consumer Goods | 9 | $162B |
|
||
| Insurance | 4 | $225B |
|
||
| Telecommunications | 2 | $144B |
|
||
| Pharmaceuticals | 2 | $112B |
|
||
| Media / Entertainment | 2 | $69B |
|
||
Price history
+300.0% since first listed2 events — show timeline
- 2026-04-16 Listed $600,000 OneKey® MLS as Distributed by MLS Grid
- 1994-05-13 Sold (Public Records) $150,000 Public Records
Property tax history
+5.5%/yrLatest (2025): $6,820 · +8.0% YoY. Source: county tax records.
Cash-flow waterfall
monthlySold comps — $/sqft
last 12 mo · ≤1 miLoading sold comps…