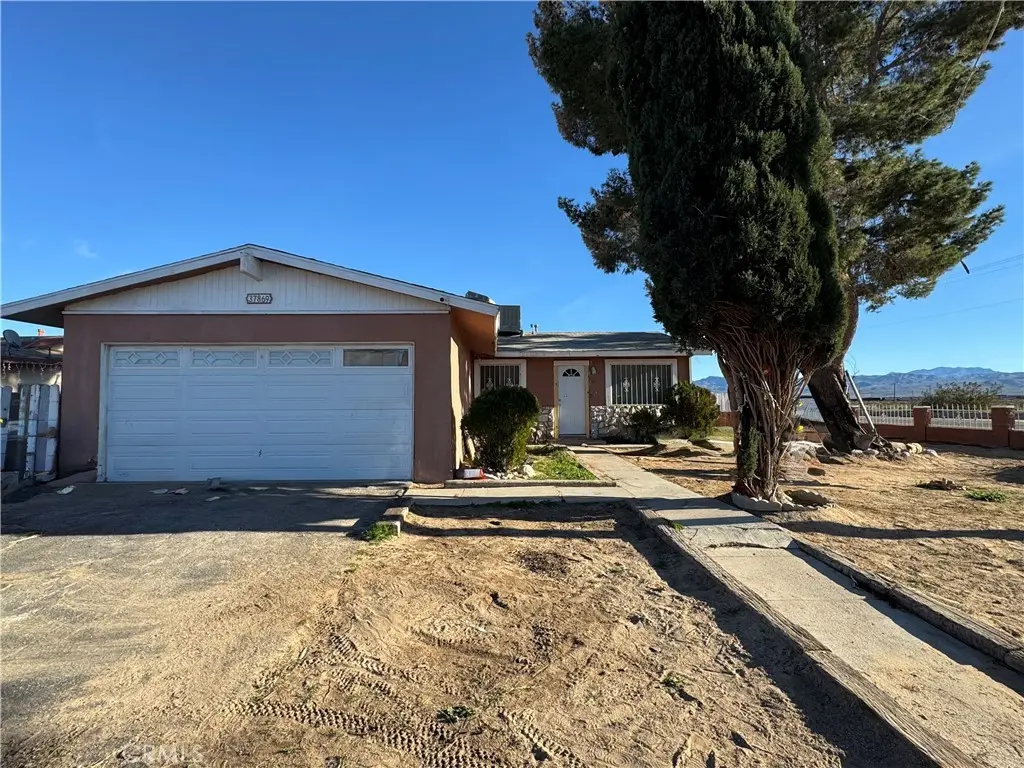
37869 Grandview Ave · Yermo, CA
Flood risk 1/10 · Minimal
- FEMA flood zone
- X (unshaded)
- Chance of flooding over 30 yrs
- 0.0%
- Est. flood insurance / yr
- $507 – $1,088
Fire risk 3/10 · Minor
- Est. fire insurance / yr
- $659 – $1,223
Heat risk 8/10 · Major
- Hot days now (above 106°F)
- 6 days/yr
- Hot days in 30 yrs
- 17 days/yr
Wind risk 1/10 · Minimal
- Chance of severe wind over 30 yrs
- —
Air-quality risk 6/10 · Moderate
- Unhealthy air days now
- 10 days/yr
- Unhealthy air days in 30 yrs
- 14 days/yr
Risk factors via First Street. Map © Google.
Why this score? — see what drove the D grade
The composite is a weighted blend of 9 inputs, each scored 0–100. Each bar is that input's sub-score; the figure is the points it added to the 100-point composite (weight × sub-score).
- Cash flow +12.3/30.0
- ARV discount +7.4/15.0
- Appreciation +5.1/10.0
- DSCR +3.6/10.0
- Schools +2.7/10.0
- 1% rule +2.5/10.0
- Rent growth +2.5/5.0
- Livability +2.5/5.0
- Condition / age +2.5/5.0
$190,000
🖨 Deal sheet 📄 Offer letter ✓ Due diligence
Listing remarks MLS
Great opportunity to own an Affordable Home on a Corner Lot located in the community of Yermo. This Single-Story property offers 3 Bedrooms and 2 Bathrooms on a spacious lot, providing a Functional Layout and room for future potential. The home features a Roof approximately 15+ Years Old and a Recently Updated Evaporative (Swamp) Cooler. Well-suited for Investors or First-Time Buyers looking for value and long-term potential in today’s market. Conveniently located with Easy Access to I-15 and just a Short Drive to Barstow, offering nearby shopping, dining, and services. Don’t miss this great opportunity to own a well-located property with strong potential at an Attainable Price.
Key facts
- Single-story
- Easy access to i-15
- Corner lot
Tags
Neighborhood map
What this means for you Summary
Snapshot
- This is a 3-bed/2.0-bath single-family listed at $190k.
Deal economics
- At list price, monthly cash flow is $-35 ($-425/yr) — negative.
- To cash-flow at today's rent, offer at most $184k (3.3% below list).
- To meet the 1% rule (rent ≥ 1% of price), the offer needs to be $142k (25.4% below list).
- Recommended offer: $142k (25.4% below list) — sets the bar for 1% rule.
Location & tenants
- Location reads: area grade D — affects rentability + tenant quality, not the cash-flow math above.
- Silver Valley Unified (town): math 23% / reading 39% proficiency, ranked #323 of 517 in CA (top 62%) — families likely to look elsewhere, expect single-tenant / working-renter base with shorter leases.
- Market conditions: 31 active listings in the ZIP; 5,458 units permitted in San Bernardino County in 2024 (1,500 in 5+ unit buildings).
Forward outlook
- In year one you build about $2k of equity ($1k loan paydown + $477 appreciation (0.2% local appreciation)).
- San Bernardino County population projected at +15% by 2050 — modest demand growth; plan on rents tracking national, not racing it.
Negotiation context
- It's been on market 149 days — a 12% lower offer ($167k) is reasonable based on typical stale-listing flexibility.
- 2 sale attempts since 19y ago with the ask held roughly flat each time — persistent listings suggest the price (not the market) is what's stuck; bring a comps-based counter.
- Current owner paid $47k; list at $190k implies a 304% gain — meaningful room to come down on a strong offer.
Risks & watch-outs
- Climate carrying-cost: extreme-heat days projected 6→17/yr by 2055 (HVAC capex compounding) — expect insurance premiums to compound above CPI over the hold.
Questions for the listing agent
- What do current leases actually rent for vs. the listed asking? Can we see a recent rent roll and the last 12 months of T-12 income?
- It's been on market 149 days. Have you received any prior offers? Is the seller open to a 25% concession, seller financing, or rate buy-down credit?
- Built in 1964 — when were the roof, HVAC, electrical panel, plumbing, and water heater last replaced?
- Why hasn't it sold? Are there any deal-killer items the seller is aware of (foundation, flood, title, zoning, code violations)?
- Is there a deadline driving the sale (1031 exchange, divorce, estate, relocation)? That informs how much negotiation room exists.
- The area grade is low — what's the realistic commute time and amenity access for the typical tenant pool here? Any planned neighborhood developments (good or bad) we should know about?
- What's the average days-on-market for RENTAL listings here right now (not sales)? A rising rental-DOM trend means longer vacancies and softer asking-rent achievability than the comps imply.
- What's the recent tenant-quality profile in this submarket — average credit score on applications, eviction rate, late-payment / NSF rate, and stable-employment percentage? A property-management company in the area should have these aggregated.
- How much new for-sale + rental construction is in the pipeline within 1–3 miles? Heavy new supply typically softens prices + rents 12–24 months out; constrained supply supports both.
Investment metrics
- 1% rule
- 0.75% ✗
- Cap rate
- 6.07%
- Cash-on-cash
- -0.80%
- DSCR
- 0.96
- GRM
- 11.2
CMA / ARV
- ARV (median comp)
- $189,372
- List price
- $190,000
- Delta
- 0.33%
- Verdict
- FAIR
- Comps
- 15 within 1.0 mi
Show comp detail 1 sale within ~0.75 mi
| Address | Dist | Beds/Ba | Sqft | Sold | Price | $/sf | Match |
|---|---|---|---|---|---|---|---|
| 35764 Frontier Ave | 0.61mi | 3/2.0 | 1,092 (-5%) | 5mo | $216,500 | $198 | 60 |
Match score weights: distance 35% · size 25% · config 20% · recency 20%. Top-matched comps best support the ARV.
Projected returns pro-forma
0.25% appreciation · 3.0% rent growth · sell at horizon
- IRR
- -2.2%
- Equity multiple
- 0.89×
- Total profit
- $-5,639
- Equity at exit
- $57,566
- IRR
- 3.3%
- Equity multiple
- 1.36×
- Total profit
- $19,373
- Equity at exit
- $71,138
Cash invested: $53,200 (down + closing). Projections, not guarantees.
Landlord ↔ Tenant lean methodology
- Overall (STATE)
- 18 Strongly Tenant-Friendly
- State California
- 18 Strongly Tenant-Friendly · D+13
- County
- — inherits STATE
- City
- — inherits STATE
ZIP-level market 92398
- Home prices YoY
- 0.1%
- Active inventory
- 31
- Price-to-rent
- 11.2×
Monthly cashflow live
- Estimated rent
- $1,417 medium interval (Pro) →
- Mortgage (P&I)
- −$996
- Tax from tax record
- −$79 /mo · $952/yr
- Insurance
- −$79
- HOA
- −$0
- Vacancy / Maint / Mgmt
- −$298
- Net cashflow
- $-35
Break-even live
UW: 25.0% down · 7.5% · 30yr · 1.5% tax · 5.0% vac · 8.0% maint · 8.0% mgmt
Financing live
Cash to close
- Down payment
- $47,500
- Closing costs
- $5,700
- Reserves months
- —
- Total cash needed
- —
Loan-product check · same deal, 3 products live
Conventional
25% down · 7.5% · 30yr
- Down + closing
- —
- Monthly P&I
- —
- Monthly cashflow
- —
- DSCR
- —
- Eligible?
- —
Personal DTI + credit; lowest rate.
DSCR
20% down · 8.5% · 30yr
- Down + closing
- —
- Monthly P&I
- —
- Monthly cashflow
- —
- DSCR
- —
- Eligible?
- —
No personal income docs; deal must DSCR.
Hard money
10% down · 12.0% · 12mo
- Down + closing
- —
- Monthly P&I
- —
- Monthly cashflow
- —
- DSCR
- —
- Eligible?
- —
Short-term bridge; refi at stabilization.
Listing history 20 events
-
2026-06-18days on market $190,000 Active 149 DOM
-
2026-06-17days on market $190,000 Active 148 DOM
-
2026-06-16days on market $190,000 Active 147 DOM
-
2026-06-15days on market $190,000 Active 146 DOM
-
2026-06-13days on market $190,000 Active 144 DOM
-
2026-06-13days on market $190,000 Active 143 DOM
-
2026-06-09days on market $190,000 Active 140 DOM
-
2026-06-08days on market $190,000 Active 139 DOM
-
2026-06-07days on market $190,000 Active 138 DOM
-
2026-06-04days on market $190,000 Active 135 DOM
-
2026-06-03days on market $190,000 Active 134 DOM
-
2026-06-02days on market $190,000 Active 133 DOM
-
2026-06-01days on market $190,000 Active 132 DOM
-
2026-05-31days on market $190,000 Active 131 DOM
-
2026-01-20$190,000 Active 699-char remark
Show marketing remark (699 chars)
Great opportunity to own an Affordable Home on a Corner Lot located in the community of Yermo. This Single-Story property offers 3 Bedrooms and 2 Bathrooms on a spacious lot, providing a Functional Layout and room for future potential. The home features a Roof approximately 15+ Years Old and a Recently Updated Evaporative (Swamp) Cooler. Well-suited for Investors or First-Time Buyers looking for value and long-term potential in today’s market. Conveniently located with Easy Access to I-15 and just a Short Drive to Barstow, offering nearby shopping, dining, and services. Don’t miss this great opportunity to own a well-located property with strong potential at an Attainable Price.
-
2007-11-17historical
-
2007-07-01price $169,000
-
2007-05-18$179,900
-
1999-07-01soldstatus $47,000
-
1994-11-30soldstatus $32,500
ⓘ Source: listings_history table (triggers on properties + properties_extension) + one-shot
backfill from property_details.listing_events for pre-trigger history.
Tax reassessment forecast CA · Resets to sale price
- Current annual tax
- $952 · $79/mo
- Projected year-2 tax
- $1,444 · $120/mo
- Expected delta
- +$492/yr (+$41/mo · 51.6%)
ⓘ Screening estimate from a state-policy table — verify with the county assessor before closing.
Climate risk First Street
- Flood 1/10 Low FEMA zone X (unshaded) · 0% chance over 30 yrs
- Wildfire 3/10 Moderate
- Heat 8/10 Severe 6 d/yr ≥106°F today · 17 d/yr by 30 yrs out
- Wind 1/10 Low
- Air quality 6/10 Major 10 unhealthy d/yr today · 14 by 30 yrs out
Nearby sold comps map
Loading sold comps map…
Walkable amenities ~0.75 mi
Loading nearby amenities…
Taxation est. · year 1
- Rental income
- $17,005
- − Mortgage interest
- −$10,643
- − Property taxes
- −$952
- − Insurance
- −$950
- − Repairs & maintenance
- −$1,360
- − Management
- −$1,360
- − Depreciation
- −$5,527
- Taxable loss
- −$3,789
- Est. tax savings @ 24.0%
- +$909
- After-tax cash flow
- $484/yr
For passive investors: Depreciation is non-cash, so a rental often shows a tax loss while cash-flowing — sheltering income. Rental losses are passive: they offset passive income freely, and up to $25,000/yr can offset ordinary (W-2) income if you actively participate and your MAGI is under $100k (phasing out to $0 by $150k); unused losses carry forward. On sale, claimed depreciation is recaptured at up to 25%, and gains may owe capital-gains tax (a 1031 exchange can defer both). Figures are a year-1 estimate at your 24.0% rate — not tax advice; consult a CPA.
Schools (NCES district)
- District
- Silver Valley Unified
- NCES district ID
- 0636820
- Math proficiency
- 23% ▼ -12.00%
- Reading proficiency
- 39% ▼ -12.00%
- Median HH income
- $48,754
- Composite
- 26.85/100
- National rank
- #7105
- State rank
- #323 of 517 in CA
Livability — Yermo
No livability data for this city. (Only ~50 U.S. cities are tracked.)
Census & demographics
- Census place
- Yermo, CA
- Population (ZIP)
- 1,657
Population outlook (San Bernardino County) Hauer SSP2
- Today (2025)
- 2,300,329 people
- By 2030
- 2,378,907 · +3.4%
- By 2040
- 2,523,137 · +9.7%
- By 2050
- 2,642,388 · +14.9%
- By 2075
- 2,880,769 · +25.2%
- By 2100
- 2,909,436 · +26.5%
Race, ethnicity, and origin ACS 2023
- Neighborhood character
- Predominantly White (69%)
- Race & ethnicity
- White 69% Hispanic / Latino 22% Two or more races 17% Asian 8%
- Hispanic origin (detail)
- Mexican 22%
- Common ancestry
- German 3% Italian 2% Iranian 1%
- Foreign-born
- 19% · Canada
- Languages at home
- 75% English-only · Arabic 12% Spanish 11% Tagalog/Filipino 1%
Political lean MEDSL · San Bernardino
- 2024 margin
- Toss-up / Even · D 47.5% · R 49.7% · Other 2.8%
- 2008→2024 swing
- -8.5pp toward R · 2008: 6.3pp · 2024: -2.1pp
- All cycles
- 2024: R+2.1 2020: D+10.7 2016: D+9.8 2012: D+5.4 2008: D+6.3
Not yet ingested
- Civics
- —
Market trends
- HPI YoY
- ▲ 0.25%
- Current HPI
- 306.9731
- Rent YoY
- —
- Metro
- —
- State GDP YoY
- ▲ 3.21%
- F500 in state
- 116
Industry mix (Fortune 500 HQ in CA)
| Industry | F500 HQs | Revenue |
|---|---|---|
| Technology | 27 | $1,492B |
|
||
| Financial Services | 3 | $174B |
|
||
| Retail | 3 | $44B |
|
||
| Insurance | 3 | $26B |
|
||
| Media / Entertainment | 2 | $115B |
|
||
| Pharmaceuticals / Biotech | 2 | $62B |
|
||
Price history
+484.6% since first listed6 events — show timeline
- 2026-01-20 Listed $190,000 CRMLS
- 2007-11-17 Listing Removed — CRMLS
- 2007-07-01 Price Changed $169,000 CRMLS
- 2007-05-18 Listed $179,900 CRMLS
- 1999-07-01 Sold (Public Records) $47,000 Public Records
- 1994-11-30 Sold (Public Records) $32,500 Public Records
Property tax history
+2.0%/yrLatest (2025): $952 · +1.8% YoY. Source: county tax records.
Cash-flow waterfall
monthlySold comps — $/sqft
last 12 mo · ≤1 miLoading sold comps…