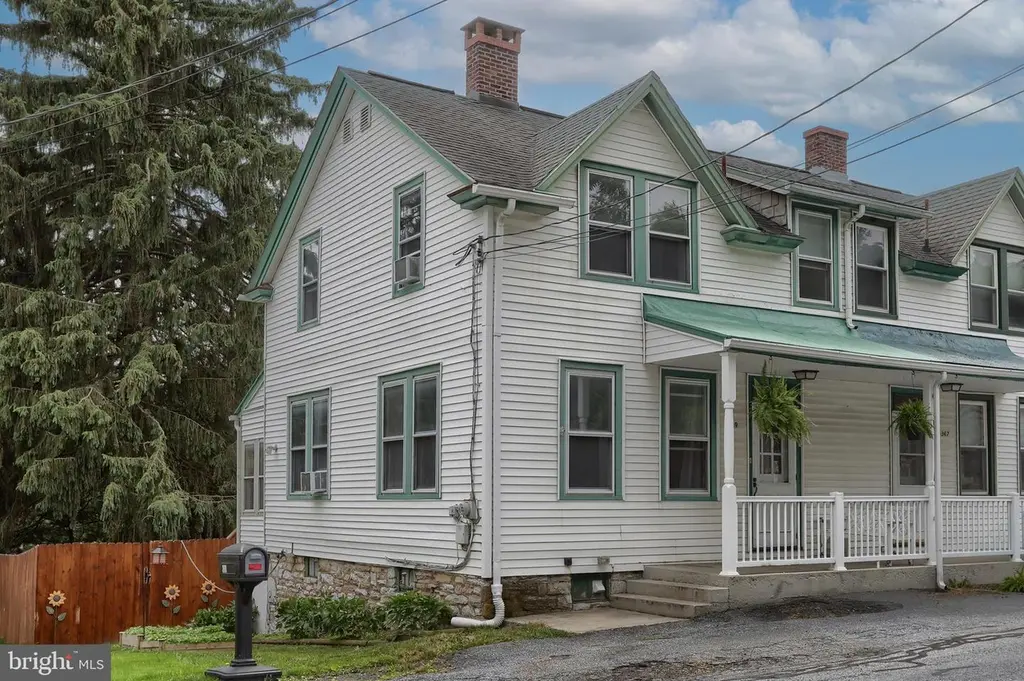
369 Boyd St · Cornwall, PA
Flood risk 1/10 · Minimal
- FEMA flood zone
- X (unshaded)
- Chance of flooding over 30 yrs
- 0.0%
- Est. flood insurance / yr
- $473 – $860
Fire risk 4/10 · Minor
- Est. fire insurance / yr
- $511 – $949
Heat risk 5/10 · Moderate
- Hot days now (above 99°F)
- 7 days/yr
- Hot days in 30 yrs
- 15 days/yr
Wind risk 4/10 · Minor
- Chance of severe wind over 30 yrs
- 10.0%
Air-quality risk 3/10 · Minor
- Unhealthy air days now
- 3 days/yr
- Unhealthy air days in 30 yrs
- 4 days/yr
Risk factors via First Street. Map © Google.
Why this score? — see what drove the D- grade
The composite is a weighted blend of 9 inputs, each scored 0–100. Each bar is that input's sub-score; the figure is the points it added to the 100-point composite (weight × sub-score).
- Cash flow +15.3/30.0
- DSCR +4.7/10.0
- Schools +4.1/10.0
- 1% rule +4.0/10.0
- Livability +3.5/5.0
- Rent growth +3.4/5.0
- Condition / age +2.5/5.0
- ARV discount +1.8/15.0
- Appreciation +0.0/10.0
$200,000
🖨 Deal sheet (PDF) 📄 Offer letter ✓ Due diligence
Listing remarks MLS
Located in quaint Miners Village this three bedroom, one and a half bath, semi-detached home, is ready for its new owner. On the first floor, you will find a spacious living room, formal dining room, mudroom and kitchen featuring exposed brick. Off the mudroom, is a rear deck with a patio underneath, a walkout door from the basement and a shed area for additional storage. Two off-street parking spaces in front of the home.
Key facts
- Elevated deck
- Covered patio
- Walk-out basement
Tags
Property features AI
Finance
- Other: Fee simple ownership
Exterior
- Parking: Asphalt driveway; Off-street parking and on-street parking available
- Utilities: Public water; Public sewer
- Home design: Semi-detached home; Vinyl siding; Architectural shingle roof
- Construction: Block foundation
- Exterior features: Not in a federal flood zone; Property located in Miner’s Village neighborhood (directions: From 322, turn onto Boyd Street; property is on the left)
Interior
- Kitchen: Kitchen (appliances not specified)
- Bedrooms: Three bedrooms on the upper level
- Bathrooms: One full bathroom (upper level); One half bathroom (main level)
- Heating & cooling: Forced air heating (oil); Window air conditioning units; 100 Amp electrical service; Electric hot water
- Interior features: Unfinished basement; Living Room; Family Room
- Laundry & utility: Laundry room
Neighborhood map
What this means for you Summary
Snapshot
- This is a 3-bed/1.0-bath townhouse listed at $200k.
Deal economics
- At list price, monthly cash flow is $72 ($869/yr) — positive.
- The deal already cash-flows at list — no discount required.
- To meet the 1% rule (rent ≥ 1% of price), the offer needs to be $180k (10.0% below list).
- Recommended offer: $180k (10.0% below list) — sets the bar for 1% rule.
- Cap rate 6.7% vs local median 0.9% in Cornwall — top-decile yield for the area; either an underpriced asset or a hidden risk that comps aren't pricing in. Stress-test before assuming the spread holds.
Location & tenants
- Location reads 70/100 on livability (#740 in PA) — a middle-class / working-renter tenant base. Strengths: crime A+, employment A+, housing A+; Watch: amenities F, commute F, health & safety F.
- Cornwall-Lebanon SD (suburban): math 37% / reading 56% proficiency, ranked #219 of 539 in PA (top 41%) — families likely to look elsewhere, expect single-tenant / working-renter base with shorter leases.
- Zoned schools: Cornwall El Sch (math 46% / reading 70%, grade C+, #430 of 1,518 statewide, top 29%, 534 students, 33% FRL); Cedar Crest Ms (math 24% / reading 59%, grade F, #234 of 512 statewide, top 47%, 1,302 students, 44% FRL); Cedar Crest Hs (math 77% / reading 34%, grade C, #93 of 437 statewide, top 22%, 1,633 students, 34% FRL).
- Market conditions: Rents rising (+3.5%/yr); 267 active listings in the ZIP; 315 units permitted in Lebanon County in 2024 (36 in 5+ unit buildings).
Forward outlook
- Local home prices are declining (-3.0%/yr); year-one equity from $1k of loan paydown is wiped out by about $6k of value loss. Plan a longer hold.
- Lebanon County population projected at +10% by 2050 — modest demand growth; plan on rents tracking national, not racing it.
Negotiation context
- Only 5 days on market — expect competitive offers; lowballing is unlikely to land.
- 6 sale attempts since 12y ago with the ask held roughly flat each time — persistent listings suggest the price (not the market) is what's stuck; bring a comps-based counter.
- Current owner paid $146k; 37% above their basis — modest negotiation headroom, anchor on the comps not their cost.
Risks & watch-outs
- Watch-outs: built in 1890 — expect roof / HVAC / electrical / plumbing capex.
- Climate carrying-cost: extreme-heat days projected 7→15/yr by 2055 (HVAC capex compounding) — expect insurance premiums to compound above CPI over the hold.
Questions for the listing agent
- Built in 1890 — when were the roof, HVAC, electrical panel, plumbing, and water heater last replaced?
- Is there a deadline driving the sale (1031 exchange, divorce, estate, relocation)? That informs how much negotiation room exists.
- Schools are A-rated — typically a magnet for longer-tenancy family renters. What's the average tenant stay here, and is there a school-zone premium baked into asking?
- The area grade is low — what's the realistic commute time and amenity access for the typical tenant pool here? Any planned neighborhood developments (good or bad) we should know about?
- What's the average days-on-market for RENTAL listings here right now (not sales)? A rising rental-DOM trend means longer vacancies and softer asking-rent achievability than the comps imply.
- What's the recent tenant-quality profile in this submarket — average credit score on applications, eviction rate, late-payment / NSF rate, and stable-employment percentage? A property-management company in the area should have these aggregated.
- How much new for-sale + rental construction is in the pipeline within 1–3 miles? Heavy new supply typically softens prices + rents 12–24 months out; constrained supply supports both.
Investment metrics
- 1% rule
- 0.90% ✗
- Cap rate
- 6.73%
- Cash-on-cash
- 1.55%
- DSCR
- 1.07
- GRM
- 9.3
CMA / ARV
- ARV (on-the-fly)
- $177,480
- Comps found
- 9
Show comp detail 9 sales within ~0.75 mi
| Address | Dist | Beds/Ba | Sqft | Sold | Price | $/sf | Match |
|---|---|---|---|---|---|---|---|
| 79 Silver Rd | 0.08mi | 3/1.0 | 992 (-14%) | 1mo | $105,000 | $106 | 71 |
| 339 Boyd St | 0.10mi | 3/1.0 | 1,260 (+9%) | 20mo | $228,500 | $181 | 64 |
| 311 Boyd St | 0.22mi | 2/1.0 (-1) | 1,330 (+15%) | 1mo | $180,000 | $135 | 59 |
| 318 Boyd St | 0.16mi | 3/1.0 | 1,330 (+15%) | 13mo | $229,000 | $172 | 58 |
| 313 Boyd St | 0.21mi | 3/1.0 | 1,330 (+15%) | 13mo | $108,000 | $81 | 55 |
| 323 Boyd St | 0.16mi | 3/1.5 | 1,330 (+15%) | 22mo | $224,900 | $169 | 48 |
| 128 Anthracite Rd | 0.58mi | 3/1.0 | 1,256 (+8%) | 15mo | $230,000 | $183 | 47 |
| 2 Palmer St | 0.63mi | 2/1.5 (-1) | 1,275 (+10%) | 14mo | $195,000 | $153 | 35 |
| 222 Rexmont Rd | 0.61mi | 2/1.5 (-1) | 1,304 (+12%) | 11mo | $190,000 | $146 | 35 |
Match score weights: distance 35% · size 25% · config 20% · recency 20%. Top-matched comps best support the ARV.
Projected returns pro-forma
-3.0% appreciation · 3.53% rent growth · sell at horizon
- IRR
- -13.2%
- Equity multiple
- 0.52×
- Total profit
- $-26,824
- Equity at exit
- $29,821
- IRR
- -3.5%
- Equity multiple
- 0.76×
- Total profit
- $-13,387
- Equity at exit
- $17,292
Cash invested: $56,000 (down + closing). Projections, not guarantees.
Landlord ↔ Tenant lean methodology
- Overall (STATE)
- 62 Landlord-Friendly
- State Pennsylvania
- 62 Landlord-Friendly · EVEN
- County
- — inherits STATE
- City
- — inherits STATE
ZIP-level market 17042
- Rents YoY
- 3.5%
- Active inventory
- 267
- Price-to-rent
- 9.3×
Monthly cashflow live
- Estimated rent
- $1,800 medium interval (Pro) →
- Mortgage (P&I)
- −$1,049
- Tax from tax record
- −$218 /mo · $2,611/yr
- Insurance
- −$83
- HOA
- −$0
- Vacancy / Maint / Mgmt
- −$378
- Net cashflow
- $72
Break-even live
Sensitivity live
| Price | -10% $186 | -5% $129 | +0% $72 | +5% $16 | +10% $-41 |
|---|---|---|---|---|---|
| Rent | -10% $-70 | -5% $1 | +0% $72 | +5% $144 | +10% $215 |
| Rate | -1.0pp $173 | -0.5pp $123 | base $72 | +0.5pp $21 | +1.0pp $-32 |
UW: 25.0% down · 7.5% · 30yr · 1.5% tax · 5.0% vac · 8.0% maint · 8.0% mgmt
Financing live
Cash to close
- Down payment
- $50,000
- Closing costs
- $6,000
- Reserves months
- —
- Total cash needed
- —
Loan-product check · same deal, 3 products live
Conventional
25% down · 7.5% · 30yr
- Down + closing
- —
- Monthly P&I
- —
- Monthly cashflow
- —
- DSCR
- —
- Eligible?
- —
Personal DTI + credit; lowest rate.
DSCR
20% down · 8.5% · 30yr
- Down + closing
- —
- Monthly P&I
- —
- Monthly cashflow
- —
- DSCR
- —
- Eligible?
- —
No personal income docs; deal must DSCR.
Hard money
10% down · 12.0% · 12mo
- Down + closing
- —
- Monthly P&I
- —
- Monthly cashflow
- —
- DSCR
- —
- Eligible?
- —
Short-term bridge; refi at stabilization.
Listing history 5 events
-
2026-06-15statusdays on market $200,000 Pending 5 DOM
-
2026-06-14days on market $200,000 Active 4 DOM
-
2026-06-13days on market $200,000 Active 3 DOM
-
2026-06-10remarks 699-char remark
-
2026-06-10$200,000 Active 1 DOM
ⓘ Source: listings_history table (triggers on properties + properties_extension) + one-shot
backfill from property_details.listing_events for pre-trigger history.
Tax reassessment forecast PA · Partial reset (capped growth)
- Current annual tax
- $2,611 · $218/mo
- Projected year-2 tax
- $2,885 · $240/mo
- Expected delta
- +$275/yr (+$23/mo · 10.5%)
ⓘ Screening estimate from a state-policy table — verify with the county assessor before closing.
Climate risk First Street
- Flood 1/10 Low FEMA zone X (unshaded) · 0% chance over 30 yrs
- Wildfire 4/10 Moderate
- Heat 5/10 Major 7 d/yr ≥99°F today · 15 d/yr by 30 yrs out
- Wind 4/10 Moderate 10% chance of damaging wind over 30 yrs
- Air quality 3/10 Moderate 3 unhealthy d/yr today · 4 by 30 yrs out
Nearby sold comps map
Loading sold comps map…
Walkable amenities ~0.75 mi
Loading nearby amenities…
Taxation est. · year 1
- Rental income
- $21,602
- − Mortgage interest
- −$11,203
- − Property taxes
- −$2,611
- − Insurance
- −$1,000
- − Repairs & maintenance
- −$1,728
- − Management
- −$1,728
- − Depreciation
- −$5,818
- Taxable loss
- −$2,486
- Est. tax savings @ 24.0%
- +$597
- After-tax cash flow
- $1,466/yr
For passive investors: Depreciation is non-cash, so a rental often shows a tax loss while cash-flowing — sheltering income. Rental losses are passive: they offset passive income freely, and up to $25,000/yr can offset ordinary (W-2) income if you actively participate and your MAGI is under $100k (phasing out to $0 by $150k); unused losses carry forward. On sale, claimed depreciation is recaptured at up to 25%, and gains may owe capital-gains tax (a 1031 exchange can defer both). Figures are a year-1 estimate at your 24.0% rate — not tax advice; consult a CPA.
Schools (NCES district)
- District
- Cornwall-Lebanon SD
- NCES district ID
- 4206840
- Math proficiency
- 37% ▼ -15.00%
- Reading proficiency
- 56% ▼ -15.00%
- Median HH income
- $62,483
- Composite
- 41.0/100
- National rank
- #3589
- State rank
- #219 of 539 in PA
Livability — Cornwall
- Score
- 70/100
- State rank
- #740
- US rank
- #7415
Category grades
Schools grade is shown separately in the Schools card above.
Census & demographics
- Census place
- Cornwall, PA
- County
- Lebanon County · 95,836 people
- City population
- 40,670
- Metro
- Lebanon, PA
- Population (ZIP)
- 40,161
- Household income
- $74,831
- Rent vs Own
- Severe rent burden
- 801.0
Population outlook (Lebanon County) Hauer SSP2
- Today (2025)
- 144,806 people
- By 2030
- 147,534 · +1.9%
- By 2040
- 152,952 · +5.6%
- By 2050
- 159,406 · +10.1%
- By 2075
- 181,736 · +25.5%
- By 2100
- 198,402 · +37.0%
Race, ethnicity, and origin ACS 2023
- Neighborhood character
- Predominantly White (77%)
- Race & ethnicity
- White 77% Hispanic / Latino 16% Two or more races 8% Black 3% Asian 1%
- Hispanic origin (detail)
- Puerto Rican 12% Dominican 1%
- Common ancestry
- Romanian 2% Polish 2% Iranian 1%
- Foreign-born
- 3% · Canada
- Languages at home
- 87% English-only · Spanish 10% German/W. Germanic 1% Other Indo-European 1%
Political lean MEDSL · Lebanon
- 2024 margin
- Solid R (+32.0) · D 33.6% · R 65.5%
- 2008→2024 swing
- -13.1pp toward R · 2008: -18.9pp · 2024: -32.0pp
- All cycles
- 2024: R+32.0 2020: R+31.7 2016: R+35.5 2012: R+28.0 2008: R+18.9
Not yet ingested
- Civics
- —
Market trends
- HPI YoY
- ▼ -124.28%
- Current HPI
- 192.3643
- Rent YoY
- ▲ 3.53%
- Metro
- Lebanon, PA
- State GDP YoY
- ▲ 1.68%
- F500 in state
- 34
Industry mix (Fortune 500 HQ in PA)
| Industry | F500 HQs | Revenue |
|---|---|---|
| Healthcare | 2 | $309B |
|
||
| Insurance | 2 | $27B |
|
||
| Telecommunications / Media | 1 | $124B |
|
||
| Industrial Distribution | 1 | $22B |
|
||
| Financial Services | 1 | $20B |
|
||
| Chemicals / Materials | 1 | $18B |
|
||
Price history
+69.6% since first listed21 events — show timeline
- 2026-06-09 Listed $200,000 BRIGHT MLS
- 2023-02-08 Sold (Public Records) $145,500 Public Records
- 2023-02-07 Sold (MLS) $145,500 BRIGHT MLS
- 2023-01-10 Pending — BRIGHT MLS
- 2023-01-06 Listed $140,000 BRIGHT MLS
- 2023-01-03 Coming Soon $140,000 BRIGHT MLS
- 2020-04-08 Sold (Public Records) $122,000 Public Records
- 2020-04-03 Sold (MLS) $122,000 BRIGHT MLS
- 2020-01-17 Price Changed $122,000 BRIGHT MLS
- 2020-01-07 Pending — BRIGHT MLS
- 2019-09-09 Listed $128,000 BRIGHT MLS
- 2017-05-31 Sold (Public Records) $122,000 Public Records
- 2017-05-25 Sold (MLS) $122,000 BRIGHT MLS
- 2017-04-03 Listing Removed — BRIGHT MLS
- 2017-01-16 Listing Removed — BRIGHT MLS
- 2017-01-16 Listed $122,000 BRIGHT MLS
- 2017-01-15 Listed $122,000 BRIGHT MLS
- 2014-09-09 Sold (Public Records) $117,000 Public Records
- 2014-09-04 Sold (MLS) $117,000 BRIGHT MLS
- 2014-07-26 Listing Removed — BRIGHT MLS
- 2014-04-14 Listed $117,900 BRIGHT MLS
Property tax history
+3.5%/yrLatest (2026): $2,611 · +4.1% YoY. Source: county tax records.
Cash-flow waterfall
monthlySold comps — $/sqft
last 12 mo · ≤1 miLoading sold comps…