701 N Carlson St · Elsa, TX
Flood risk 3/10 · Minor
- FEMA flood zone
- —
- Chance of flooding over 30 yrs
- 0.07%
- Est. flood insurance / yr
- —
Fire risk 2/10 · Minimal
- Est. fire insurance / yr
- $1,222 – $2,270
Heat risk 9/10 · Severe
- Hot days now (above 111°F)
- 7 days/yr
- Hot days in 30 yrs
- 24 days/yr
Wind risk 8/10 · Major
- Chance of severe wind over 30 yrs
- 99.0%
Air-quality risk 1/10 · Minimal
- Unhealthy air days now
- 0 days/yr
- Unhealthy air days in 30 yrs
- 0 days/yr
Risk factors via First Street. Map © Google.
Why this score? — see what drove the D+ grade
The composite is a weighted blend of 9 inputs, each scored 0–100. Each bar is that input's sub-score; the figure is the points it added to the 100-point composite (weight × sub-score).
- ARV discount +12.5/15.0
- Cash flow +11.4/30.0
- Appreciation +7.4/10.0
- DSCR +3.3/10.0
- Livability +3.3/5.0
- 1% rule +3.2/10.0
- Rent growth +2.5/5.0
- Condition / age +2.5/5.0
- Schools +1.1/10.0
$125,000
🖨 Deal sheet 📄 Offer letter ✓ Due diligence
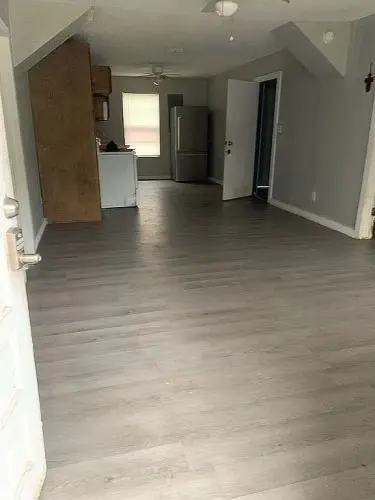
Listing remarks MLS
This is a nice 4 bedroom/2 bath home with central heat and air. There is also a laundry room and a small 200 sq ft shed for storage. The home is completely fenced and has some off-street parking.
Key facts
- 2 garage spots
- Built 1990
- Listed 142 days
Neighborhood map
What this means for you Summary
Snapshot
- This is a 3-bed/2.0-bath single-family listed at $125k.
Deal economics
- At list price, monthly cash flow is $-44 ($-532/yr) — negative.
- To cash-flow at today's rent, offer at most $117k (6.3% below list).
- To meet the 1% rule (rent ≥ 1% of price), the offer needs to be $102k (18.0% below list).
- Recommended offer: $102k (18.0% below list) — sets the bar for 1% rule.
Location & tenants
- Location reads 66/100 on livability (#648 in TX) — a middle-class / working-renter tenant base. Strengths: cost of living A+, housing A+, health & safety A+; Watch: crime D, employment D, schools F.
- Edcouch-Elsa ISD (suburban): math 9% / reading 20% proficiency, ranked #822 of 826 in TX (top 100%) — low school quality limits family demand, transient renter base, plan for 1-2y turnover; 74% free/reduced lunch — lower-income household profile, screen leases tightly.
- Market conditions: 40 active listings in the ZIP; 4 comparable units currently listed for rent nearby; rentals lingering (median 44d on market — plan ~5-8 weeks vacancy on turnover, expect pricing pressure); 100% of comp listings sitting > 30 days — soft ceiling on asking rent; 7,378 units permitted in Hidalgo County in 2024 (641 in 5+ unit buildings).
Forward outlook
- In year one you build about $7k of equity ($864 loan paydown + $6k appreciation (4.8% local appreciation)).
- Hidalgo County population projected at +28% by 2050 — long-run rental-demand tailwind backs the buy-and-hold thesis.
- At projected returns (4.8% appreciation + 3.0% rent growth), your $35k cash investment doubles in ~5 years — after that, you're playing with house money.
- By year 6, paydown + projected appreciation supports a ~$37k cash-out refi (75% LTV) — recoverable capital for the next deal without selling this one.
Negotiation context
- It's been on market 142 days — a 12% lower offer ($110k) is reasonable based on typical stale-listing flexibility.
- 3 sale attempts since 3y ago with the ask held roughly flat each time — persistent listings suggest the price (not the market) is what's stuck; bring a comps-based counter.
Risks & watch-outs
- Climate carrying-cost: severe wind risk, 99% chance of damaging wind over 30y; extreme-heat days projected 7→24/yr by 2055 (HVAC capex compounding) — expect insurance premiums to compound above CPI over the hold.
Questions for the listing agent
- What do current leases actually rent for vs. the listed asking? Can we see a recent rent roll and the last 12 months of T-12 income?
- It's been on market 142 days. Have you received any prior offers? Is the seller open to a 18% concession, seller financing, or rate buy-down credit?
- Why hasn't it sold? Are there any deal-killer items the seller is aware of (foundation, flood, title, zoning, code violations)?
- Is there a deadline driving the sale (1031 exchange, divorce, estate, relocation)? That informs how much negotiation room exists.
- Schools are F-rated, which usually means shorter tenancies and higher turnover. Who's the typical renter profile here, and what's been the actual vacancy rate?
- Crime grade is D in this area — have there been break-ins, vandalism, or insurance claims at this property in the last 3 years? What carrier currently insures it and at what premium?
- The area grade is low — what's the realistic commute time and amenity access for the typical tenant pool here? Any planned neighborhood developments (good or bad) we should know about?
- What's the average days-on-market for RENTAL listings here right now (not sales)? A rising rental-DOM trend means longer vacancies and softer asking-rent achievability than the comps imply.
- What's the recent tenant-quality profile in this submarket — average credit score on applications, eviction rate, late-payment / NSF rate, and stable-employment percentage? A property-management company in the area should have these aggregated.
- How much new for-sale + rental construction is in the pipeline within 1–3 miles? Heavy new supply typically softens prices + rents 12–24 months out; constrained supply supports both.
Investment metrics
- 1% rule
- 0.82% ✗
- Cap rate
- 5.87%
- Cash-on-cash
- -1.52%
- DSCR
- 0.93
- GRM
- 10.2
CMA / ARV
- ARV (median comp)
- $140,588
- List price
- $125,000
- Delta
- -11.09%
- Verdict
- UNDERPRICED
- Comps
- 20 within 1.0 mi
Show comp detail 8 sales within ~0.75 mi
| Address | Dist | Beds/Ba | Sqft | Sold | Price | $/sf | Match |
|---|---|---|---|---|---|---|---|
| 162 Valle Vista Dr | 0.25mi | 3/2.0 | 1,267 (+1%) | 3mo | $170,000 | $134 | 84 |
| 500 E Vfw St | 0.23mi | 3/1.0 | 1,181 (-6%) | 4mo | $99,000 | $84 | 72 |
| 329 Gladiola Dr | 0.46mi | 3/2.0 | 1,239 (-1%) | 21mo | $185,000 | $149 | 59 |
| 202 Laureles Dr | 0.61mi | 3/2.0 | 1,260 (+0%) | 17mo | $135,000 | $107 | 57 |
| 415 W Ciro Caceres St | 0.60mi | 3/1.5 | 1,180 (-6%) | 8mo | $110,000 | $93 | 53 |
| 310 W Ciro Caceres St | 0.45mi | 3/2.0 | 1,350 (+8%) | 16mo | $215,000 | $159 | 53 |
| 420 Vfw Ave | 0.68mi | 3/1.0 | 1,305 (+4%) | 9mo | $110,000 | $84 | 51 |
| 205 Encino Ln | 0.68mi | 3/2.5 | 1,351 (+8%) | 19mo | $224,900 | $166 | 38 |
Match score weights: distance 35% · size 25% · config 20% · recency 20%. Top-matched comps best support the ARV.
Projected returns pro-forma
4.77% appreciation · 3.0% rent growth · sell at horizon
- IRR
- 11.0%
- Equity multiple
- 1.70×
- Total profit
- $24,376
- Equity at exit
- $69,110
- IRR
- 12.4%
- Equity multiple
- 3.20×
- Total profit
- $76,959
- Equity at exit
- $117,871
Cash invested: $35,000 (down + closing). Projections, not guarantees.
Landlord ↔ Tenant lean methodology
- Overall (STATE)
- 87 Strongly Landlord-Friendly
- State Texas
- 87 Strongly Landlord-Friendly · R+5
- County
- — inherits STATE
- City
- — inherits STATE
ZIP-level market 78543
- Home prices YoY
- 1.9%
- Active inventory
- 40
- Price-to-rent
- 10.2×
Monthly cashflow live
- Estimated rent
- $1,025 medium interval (Pro) →
- Mortgage (P&I)
- −$656
- Tax from tax record
- −$146 /mo · $1,757/yr
- Insurance
- −$52
- HOA
- −$0
- Vacancy / Maint / Mgmt
- −$215
- Net cashflow
- $-44
Break-even live
UW: 25.0% down · 7.5% · 30yr · 1.5% tax · 5.0% vac · 8.0% maint · 8.0% mgmt
Financing live
Cash to close
- Down payment
- $31,250
- Closing costs
- $3,750
- Reserves months
- —
- Total cash needed
- —
Loan-product check · same deal, 3 products live
Conventional
25% down · 7.5% · 30yr
- Down + closing
- —
- Monthly P&I
- —
- Monthly cashflow
- —
- DSCR
- —
- Eligible?
- —
Personal DTI + credit; lowest rate.
DSCR
20% down · 8.5% · 30yr
- Down + closing
- —
- Monthly P&I
- —
- Monthly cashflow
- —
- DSCR
- —
- Eligible?
- —
No personal income docs; deal must DSCR.
Hard money
10% down · 12.0% · 12mo
- Down + closing
- —
- Monthly P&I
- —
- Monthly cashflow
- —
- DSCR
- —
- Eligible?
- —
Short-term bridge; refi at stabilization.
Rent comps 4 comps
| Address | Beds | Baths | Sqft | Rent | $/sqft | DOM | Units | Dist |
|---|---|---|---|---|---|---|---|---|
| 108 Tulipan Dr Elsa, TX | 2.0 | 1.0 | 1012 | $995 | $0.98 | 43d | 1 | 0.50mi |
| 415 Edinburg Ave #107 Elsa, TX | 3.0 | 1.0 | 1800 | $1,500 | $0.83 | 43d | 1 | 0.69mi |
| 300 Sylvia Handy Dr Unit 205 Elsa, TX | 2.0 | 2.0 | 904 | $825 | $0.91 | 43d | 1 | 0.71mi |
| 300 Sylvia Handy Dr Unit 217 Elsa, TX | 2.0 | 2.0 | 904 | $800 | $0.88 | 43d | 1 | 0.71mi |
Listing history 21 events
-
2026-06-18days on market $125,000 Active 142 DOM
-
2026-06-17days on market $125,000 Active 141 DOM
-
2026-06-16days on market $125,000 Active 140 DOM
-
2026-06-15days on market $125,000 Active 139 DOM
-
2026-06-13days on market $125,000 Active 137 DOM
-
2026-06-12days on market $125,000 Active 136 DOM
-
2026-06-09days on market $125,000 Active 133 DOM
-
2026-06-08days on market $125,000 Active 132 DOM
-
2026-06-08days on market $125,000 Active 131 DOM
-
2026-06-07days on market $125,000 Active 130 DOM
-
2026-06-03days on market $125,000 Active 127 DOM
-
2026-06-02days on market $125,000 Active 126 DOM
-
2026-06-01days on market $125,000 Active 125 DOM
-
2026-05-31days on market $125,000 Active 124 DOM
-
2026-01-26$125,000 Active 195-char remark
Show marketing remark (195 chars)
This is a nice 4 bedroom/2 bath home with central heat and air. There is also a laundry room and a small 200 sq ft shed for storage. The home is completely fenced and has some off-street parking.
-
2024-09-07historical $1,200
-
2024-07-10$1,200
-
2023-10-23historical $1,200
-
2023-08-24$1,200
-
2021-07-20soldstatus
-
2020-07-08soldstatus
ⓘ Source: listings_history table (triggers on properties + properties_extension) + one-shot
backfill from property_details.listing_events for pre-trigger history.
Tax reassessment forecast TX · Resets to sale price
- Current annual tax
- $1,757 · $146/mo
- Projected year-2 tax
- $2,288 · $191/mo
- Expected delta
- +$531/yr (+$44/mo · 30.2%)
ⓘ Screening estimate from a state-policy table — verify with the county assessor before closing.
Climate risk First Street
- Flood 3/10 Moderate 7% chance over 30 yrs
- Wildfire 2/10 Low
- Heat 9/10 Extreme 7 d/yr ≥111°F today · 24 d/yr by 30 yrs out
- Wind 8/10 Severe 99% chance of damaging wind over 30 yrs
- Air quality 1/10 Low 0 unhealthy d/yr today · 0 by 30 yrs out
Nearby sold comps map
Loading sold comps map…
Walkable amenities ~0.75 mi
Loading nearby amenities…
Taxation est. · year 1
- Rental income
- $12,299
- − Mortgage interest
- −$7,002
- − Property taxes
- −$1,757
- − Insurance
- −$625
- − Repairs & maintenance
- −$984
- − Management
- −$984
- − Depreciation
- −$3,636
- Taxable loss
- −$2,689
- Est. tax savings @ 24.0%
- +$645
- After-tax cash flow
- $114/yr
For passive investors: Depreciation is non-cash, so a rental often shows a tax loss while cash-flowing — sheltering income. Rental losses are passive: they offset passive income freely, and up to $25,000/yr can offset ordinary (W-2) income if you actively participate and your MAGI is under $100k (phasing out to $0 by $150k); unused losses carry forward. On sale, claimed depreciation is recaptured at up to 25%, and gains may owe capital-gains tax (a 1031 exchange can defer both). Figures are a year-1 estimate at your 24.0% rate — not tax advice; consult a CPA.
Schools (NCES district)
- District
- Edcouch-Elsa ISD
- NCES district ID
- 4818060
- Math proficiency
- 9% ▼ -27.00%
- Reading proficiency
- 20% ▼ -13.00%
- Median HH income
- $25,724
- Composite
- 10.99/100
- National rank
- #9744
- State rank
- #822 of 826 in TX
Livability — Elsa
- Score
- 66/100
- State rank
- #648
- US rank
- #12248
Category grades
Schools grade is shown separately in the Schools card above.
Census & demographics
- Census place
- Elsa, TX
- City population
- 8,608
- Population (ZIP)
- 8,608
Population outlook (Hidalgo County) Hauer SSP2
- Today (2025)
- 955,232 people
- By 2030
- 1,009,774 · +5.7%
- By 2040
- 1,120,332 · +17.3%
- By 2050
- 1,225,036 · +28.2%
- By 2075
- 1,439,189 · +50.7%
- By 2100
- 1,533,429 · +60.5%
Race, ethnicity, and origin ACS 2023
- Neighborhood character
- Predominantly Hispanic (98%)
- Race & ethnicity
- Hispanic / Latino 98% Two or more races 56% White 2%
- Hispanic origin (detail)
- Mexican 96%
- Foreign-born
- 15% · Canada
- Languages at home
- 19% English-only · Spanish 81%
Political lean MEDSL · Hidalgo
- 2024 margin
- Toss-up / Even · D 48.1% · R 51.0%
- 2008→2024 swing
- -41.6pp toward R · 2008: 38.7pp · 2024: -2.9pp
- All cycles
- 2024: R+2.9 2020: D+17.1 2016: D+40.5 2012: D+41.8 2008: D+38.7
Not yet ingested
- Civics
- —
Market trends
- HPI YoY
- ▲ 4.77%
- Current HPI
- 250.7357
- Rent YoY
- —
- Metro
- —
- State GDP YoY
- ▲ 3.95%
- F500 in state
- 110
Industry mix (Fortune 500 HQ in TX)
| Industry | F500 HQs | Revenue |
|---|---|---|
| Energy | 16 | $1,198B |
|
||
| Technology | 5 | $198B |
|
||
| Engineering / Construction | 4 | $72B |
|
||
| Energy Services | 3 | $60B |
|
||
| Utilities | 3 | $41B |
|
||
| Healthcare | 2 | $330B |
|
||
Price history
+10316.7% since first listed7 events — show timeline
- 2026-01-26 Listed $125,000 Fizber.com
- 2024-09-07 Rental Removed $1,200 MCALLENMLS
- 2024-07-10 Listed for Rent $1,200 MCALLENMLS
- 2023-10-23 Rental Removed $1,200 Avail
- 2023-08-24 Listed for Rent $1,200 Avail
- 2021-07-20 Sold (Public Records) — Public Records
- 2020-07-08 Sold (Public Records) — Public Records
Property tax history
+2.9%/yrLatest (2025): $1,757 · +19.6% YoY. Source: county tax records.
Cash-flow waterfall
monthlySold comps — $/sqft
last 12 mo · ≤1 miLoading sold comps…