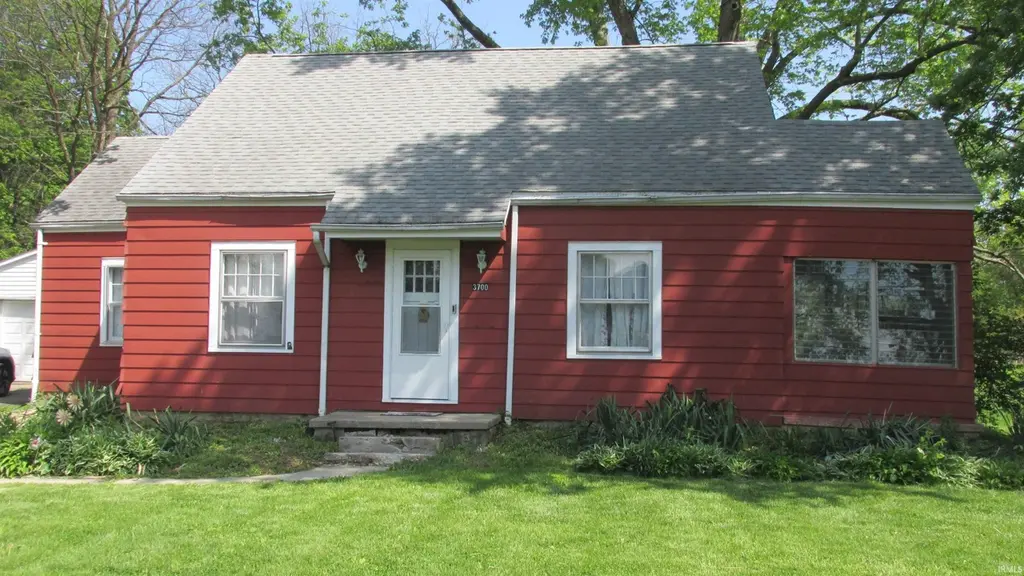
3700 W Jackson St · Muncie, IN
Flood risk 6/10 · Moderate
- FEMA flood zone
- X (unshaded)
- Chance of flooding over 30 yrs
- 0.71%
- Est. flood insurance / yr
- $473 – $860
Fire risk 1/10 · Minimal
- Est. fire insurance / yr
- $717 – $1,331
Heat risk 3/10 · Minor
- Hot days now (above 100°F)
- 7 days/yr
- Hot days in 30 yrs
- 18 days/yr
Wind risk 2/10 · Minimal
- Chance of severe wind over 30 yrs
- 1.0%
Air-quality risk 3/10 · Minor
- Unhealthy air days now
- 2 days/yr
- Unhealthy air days in 30 yrs
- 3 days/yr
Risk factors via First Street. Map © Google.
Why this score? — see what drove the C+ grade
The composite is a weighted blend of 9 inputs, each scored 0–100. Each bar is that input's sub-score; the figure is the points it added to the 100-point composite (weight × sub-score).
- Cash flow +22.2/30.0
- ARV discount +15.0/15.0
- DSCR +7.1/10.0
- 1% rule +5.0/10.0
- Rent growth +4.5/5.0
- Livability +4.0/5.0
- Condition / age +2.5/5.0
- Schools +1.7/10.0
- Appreciation +0.0/10.0
$140,000
🖨 Deal sheet 📄 Offer letter ✓ Due diligence
Listing remarks MLS
This delightful residence perfectly combines classic charm with modern convenience. This spacious property sits on a large lot and features a big backyard—ideal for outdoor activities, gardening, and relaxation. Enjoy your mornings in the inviting sunrise room, perfect for sipping coffee, creating a cozy sitting area, nurturing plants, or starting your garden seedlings. The home offers 3 bedrooms, with the flexibility to convert the office into a 4th bedroom and has 2 full bathrooms to accommodate family and guests. The eat-in kitchen has newer base cabinets and is full of natural light with plenty of room for dining and meal preparation, while the nice-sized living room provides a comfortable space for gatherings and relaxation. Additional highlights include a 2 car detached garage, a wood deck and covered patio at the rear for entertaining or enjoying the outdoors, a convenient storage shed, and an unfinished basement that offers plenty of room for storage or future expansion. Make this charming property your next home and enjoy thoughtful spaces inside and out! This home is being sold in as is condition. Contingent on Seller closing on another home.
Key facts
- Big backyard
- Wood deck
- Sunrise room
Tags
Neighborhood map
What this means for you Summary
Snapshot
- This is a 3-bed/1.0-bath single-family listed at $140k.
Deal economics
- At list price, monthly cash flow is $228 ($3k/yr) — positive.
- The deal already cash-flows at list — no discount required.
- To meet the 1% rule (rent ≥ 1% of price), the offer needs to be $139k (0.4% below list).
- Recommended offer: $127k (9.0% below list) — sets the bar for market timing.
- Cap rate 8.3% vs local median 6.0% in Muncie — top-decile yield for the area; either an underpriced asset or a hidden risk that comps aren't pricing in. Stress-test before assuming the spread holds.
Location & tenants
- Location reads 80/100 on livability (#18 in IN, #1,654 nationally) — a professional / high-income tenant draw. Strengths: amenities A+, commute A+, cost of living A+; Watch: schools D+, crime F, employment F.
- Muncie Community Schools (urban): math 18% / reading 25% proficiency, ranked #275 of 301 in IN (top 91%) — low school quality limits family demand, transient renter base, plan for 1-2y turnover; 68% free/reduced lunch — lower-income household profile, screen leases tightly.
- Market conditions: Rents rising fast (+8.1%/yr); 202 active listings in the ZIP; 5 comparable units currently listed for rent nearby; rentals lingering (median 44d on market — plan ~5-8 weeks vacancy on turnover, expect pricing pressure); 100% of comp listings sitting > 30 days — soft ceiling on asking rent; 171 units permitted in Delaware County in 2024 (57 in 5+ unit buildings).
Forward outlook
- Local home prices are declining (-3.0%/yr); year-one equity from $968 of loan paydown is wiped out by about $4k of value loss. Plan a longer hold.
- Delaware County population projected at -11% by 2050 — secular population decline; favor cash flow + early exit over multi-decade hold.
- At projected returns (-3.0% appreciation + 8.0% rent growth), your $39k cash investment doubles in ~9 years — after that, you're playing with house money.
Negotiation context
- It's been on market 95 days — a 9% lower offer ($127k) is reasonable based on typical stale-listing flexibility.
- 3 sale attempts since 12y ago with the ask held roughly flat each time — persistent listings suggest the price (not the market) is what's stuck; bring a comps-based counter.
Risks & watch-outs
- Watch-outs: built in 1937 — expect roof / HVAC / electrical / plumbing capex.
- Climate carrying-cost: major flood risk — expect insurance premiums to compound above CPI over the hold.
Questions for the listing agent
- It's been on market 95 days. Have you received any prior offers? Is the seller open to a 9% concession, seller financing, or rate buy-down credit?
- Built in 1937 — when were the roof, HVAC, electrical panel, plumbing, and water heater last replaced?
- Why hasn't it sold? Are there any deal-killer items the seller is aware of (foundation, flood, title, zoning, code violations)?
- Is there a deadline driving the sale (1031 exchange, divorce, estate, relocation)? That informs how much negotiation room exists.
- Schools are D-rated, which usually means shorter tenancies and higher turnover. Who's the typical renter profile here, and what's been the actual vacancy rate?
- Crime grade is F in this area — have there been break-ins, vandalism, or insurance claims at this property in the last 3 years? What carrier currently insures it and at what premium?
- What's the average days-on-market for RENTAL listings here right now (not sales)? A rising rental-DOM trend means longer vacancies and softer asking-rent achievability than the comps imply.
- What's the recent tenant-quality profile in this submarket — average credit score on applications, eviction rate, late-payment / NSF rate, and stable-employment percentage? A property-management company in the area should have these aggregated.
- How much new for-sale + rental construction is in the pipeline within 1–3 miles? Heavy new supply typically softens prices + rents 12–24 months out; constrained supply supports both.
Investment metrics
- 1% rule
- 1.00% ✗
- Cap rate
- 8.25%
- Cash-on-cash
- 6.99%
- DSCR
- 1.31
- GRM
- 8.4
CMA / ARV
- ARV (median comp)
- $187,932
- List price
- $140,000
- Delta
- -25.50%
- Verdict
- UNDERPRICED
- Comps
- 20 within 1.0 mi
Show comp detail 12 sales within ~0.75 mi
| Address | Dist | Beds/Ba | Sqft | Sold | Price | $/sf | Match |
|---|---|---|---|---|---|---|---|
| 505 S Lombard Dr | 0.22mi | 2/1.0 (-1) | 2,016 (+6%) | 0mo | $136,500 | $68 | 74 |
| 408 S Harvey Rd | 0.27mi | 4/2.0 (+1) | 1,794 (-5%) | 0mo | $225,000 | $125 | 69 |
| 4111 W Peachtree Ln | 0.36mi | 3/2.0 | 1,806 (-5%) | 4mo | $200,000 | $111 | 68 |
| 3006 W Jackson St | 0.38mi | 4/1.5 (+1) | 1,762 (-7%) | 1mo | $225,000 | $128 | 63 |
| 4301 W Whispering Way Ct | 0.71mi | 3/2.0 | 1,903 (+0%) | 0mo | $340,000 | $179 | 62 |
| 3107 W Beechwood Ave | 0.50mi | 3/2.5 | 1,998 (+5%) | 2mo | $235,000 | $118 | 60 |
| 3221 W Holly St | 0.56mi | 3/1.0 | 1,728 (-9%) | 4mo | $143,000 | $83 | 56 |
| 607 N Shellbark Rd | 0.39mi | 3/2.0 | 1,636 (-14%) | 2mo | $200,000 | $122 | 53 |
| 4200 W Palomino Ct | 0.66mi | 3/2.0 | 1,710 (-10%) | 1mo | $325,000 | $190 | 48 |
| 4208 W University Ave | 0.49mi | 3/2.5 | 2,151 (+13%) | 3mo | $265,000 | $123 | 46 |
| 4201 W Windy Meadows Ct | 0.66mi | 3/2.0 | 2,130 (+12%) | 2mo | $405,000 | $190 | 43 |
| 4801 W Peachtree Ln | 0.68mi | 4/2.0 (+1) | 1,679 (-11%) | 1mo | $210,000 | $125 | 39 |
Match score weights: distance 35% · size 25% · config 20% · recency 20%. Top-matched comps best support the ARV.
Projected returns pro-forma
-3.0% appreciation · 8.0% rent growth · sell at horizon
- IRR
- -0.5%
- Equity multiple
- 0.98×
- Total profit
- $-804
- Equity at exit
- $20,874
- IRR
- 13.5%
- Equity multiple
- 2.31×
- Total profit
- $51,418
- Equity at exit
- $12,105
Cash invested: $39,200 (down + closing). Projections, not guarantees.
Landlord ↔ Tenant lean methodology
- Overall (STATE)
- 90 Strongly Landlord-Friendly
- State Indiana
- 90 Strongly Landlord-Friendly · R+11
- County
- — inherits STATE
- City
- — inherits STATE
ZIP-level market 47304
- Home prices YoY
- -28.4%
- Rents YoY
- 8.1%
- Active inventory
- 202
- Price-to-rent
- 8.4×
Monthly cashflow live
- Estimated rent
- $1,394 high interval (Pro) →
- Mortgage (P&I)
- −$734
- Tax from tax record
- −$80 /mo · $964/yr
- Insurance
- −$58
- HOA
- −$0
- Vacancy / Maint / Mgmt
- −$293
- Net cashflow
- $228
Break-even live
UW: 25.0% down · 7.5% · 30yr · 1.5% tax · 5.0% vac · 8.0% maint · 8.0% mgmt
Financing live
Cash to close
- Down payment
- $35,000
- Closing costs
- $4,200
- Reserves months
- —
- Total cash needed
- —
Loan-product check · same deal, 3 products live
Conventional
25% down · 7.5% · 30yr
- Down + closing
- —
- Monthly P&I
- —
- Monthly cashflow
- —
- DSCR
- —
- Eligible?
- —
Personal DTI + credit; lowest rate.
DSCR
20% down · 8.5% · 30yr
- Down + closing
- —
- Monthly P&I
- —
- Monthly cashflow
- —
- DSCR
- —
- Eligible?
- —
No personal income docs; deal must DSCR.
Hard money
10% down · 12.0% · 12mo
- Down + closing
- —
- Monthly P&I
- —
- Monthly cashflow
- —
- DSCR
- —
- Eligible?
- —
Short-term bridge; refi at stabilization.
Rent comps 5 comps
| Address | Beds | Baths | Sqft | Rent | $/sqft | DOM | Units | Dist |
|---|---|---|---|---|---|---|---|---|
| 5124 W Canterbury Dr Muncie, IN | 2.0–3.0 | 1.5 | 1050 | $1,438 | $1.37 | 43d | 2 | 1.00mi |
| 328 S Talley Ave Muncie, IN | 2.0 | 1.0 | 1770 | $1,400 | $0.79 | 43d | 1 | 1.01mi |
| 312 S Calvert St Muncie, IN | 3.0 | 1.0 | 1813 | $1,500 | $0.83 | 43d | 1 | 1.19mi |
| 2201 W Euclid Ave Muncie, IN | 3.0 | 1.0 | 1844 | $1,200 | $0.65 | 43d | 1 | 1.32mi |
| 2112 W 11th St Muncie, IN | 3.0 | 2.0 | 1646 | $1,000 | $0.61 | 43d | 1 | 1.35mi |
Listing history 10 events
-
2026-06-02days on market $140,000 Active 95 DOM
-
2026-06-01days on market $140,000 Active 94 DOM
-
2026-05-31days on market $140,000 Active 93 DOM
-
2026-05-30days on market $140,000 Active 92 DOM
-
2026-02-27$140,000 Active 1183-char remark
Show marketing remark (1183 chars)
This delightful residence perfectly combines classic charm with modern convenience. This spacious property sits on a large lot and features a big backyard—ideal for outdoor activities, gardening, and relaxation. Enjoy your mornings in the inviting sunrise room, perfect for sipping coffee, creating a cozy sitting area, nurturing plants, or starting your garden seedlings. The home offers 3 bedrooms, with the flexibility to convert the office into a 4th bedroom and has 2 full bathrooms to accommodate family and guests. The eat-in kitchen has newer base cabinets and is full of natural light with plenty of room for dining and meal preparation, while the nice-sized living room provides a comfortable space for gatherings and relaxation. Additional highlights include a 2 car detached garage, a wood deck and covered patio at the rear for entertaining or enjoying the outdoors, a convenient storage shed, and an unfinished basement that offers plenty of room for storage or future expansion. Make this charming property your next home and enjoy thoughtful spaces inside and out! This home is being sold in as is condition. Contingent on Seller closing on another home.
-
2022-07-11soldstatus $133,500 Closed 494-char remark
Show marketing remark (494 chars)
Be-YOU-tiful! This stunning 2-story home features too many updates to list, all the while maintaining the charm of yesterday. Featuring original hardwood floors, original wood doors and trim, this home is just waiting for a new owner. Enjoy your morning coffee or evening glass of wine on the spacious sunroom overlooking the spacious yard. The large kitchen opens to a dining room which flows into the living room. No lack of space in the 4 bedroom/2 bath home. Basement recently waterproofed.
-
2022-05-28historical 494-char remark
Show marketing remark (494 chars)
Be-YOU-tiful! This stunning 2-story home features too many updates to list, all the while maintaining the charm of yesterday. Featuring original hardwood floors, original wood doors and trim, this home is just waiting for a new owner. Enjoy your morning coffee or evening glass of wine on the spacious sunroom overlooking the spacious yard. The large kitchen opens to a dining room which flows into the living room. No lack of space in the 4 bedroom/2 bath home. Basement recently waterproofed.
-
2022-05-13$130,000 494-char remark
Show marketing remark (494 chars)
Be-YOU-tiful! This stunning 2-story home features too many updates to list, all the while maintaining the charm of yesterday. Featuring original hardwood floors, original wood doors and trim, this home is just waiting for a new owner. Enjoy your morning coffee or evening glass of wine on the spacious sunroom overlooking the spacious yard. The large kitchen opens to a dining room which flows into the living room. No lack of space in the 4 bedroom/2 bath home. Basement recently waterproofed.
-
2014-10-15soldstatus $76,500
-
2014-04-29$79,900
ⓘ Source: listings_history table (triggers on properties + properties_extension) + one-shot
backfill from property_details.listing_events for pre-trigger history.
Tax reassessment forecast IN · Partial reset (capped growth)
- Current annual tax
- $964 · $80/mo
- Projected year-2 tax
- $1,077 · $90/mo
- Expected delta
- +$113/yr (+$9/mo · 11.7%)
ⓘ Screening estimate from a state-policy table — verify with the county assessor before closing.
Climate risk First Street
- Flood 6/10 Major FEMA zone X (unshaded) · 71% chance over 30 yrs
- Wildfire 1/10 Low
- Heat 3/10 Moderate 7 d/yr ≥100°F today · 18 d/yr by 30 yrs out
- Wind 2/10 Low 100% chance of damaging wind over 30 yrs
- Air quality 3/10 Moderate 2 unhealthy d/yr today · 3 by 30 yrs out
Nearby sold comps map
Loading sold comps map…
Walkable amenities ~0.75 mi
Loading nearby amenities…
Taxation est. · year 1
- Rental income
- $16,729
- − Mortgage interest
- −$7,842
- − Property taxes
- −$964
- − Insurance
- −$700
- − Repairs & maintenance
- −$1,338
- − Management
- −$1,338
- − Depreciation
- −$4,073
- Taxable income
- $473
- Est. tax owed @ 24.0%
- −$114
- After-tax cash flow
- $2,628/yr
For passive investors: Depreciation is non-cash, so a rental often shows a tax loss while cash-flowing — sheltering income. Rental losses are passive: they offset passive income freely, and up to $25,000/yr can offset ordinary (W-2) income if you actively participate and your MAGI is under $100k (phasing out to $0 by $150k); unused losses carry forward. On sale, claimed depreciation is recaptured at up to 25%, and gains may owe capital-gains tax (a 1031 exchange can defer both). Figures are a year-1 estimate at your 24.0% rate — not tax advice; consult a CPA.
Schools (NCES district)
- District
- Muncie Community Schools
- NCES district ID
- 1807320
- Math proficiency
- 18% ▼ -9.00%
- Reading proficiency
- 25% ▼ -4.00%
- Median HH income
- $30,052
- Composite
- 17.22/100
- National rank
- #9099
- State rank
- #275 of 301 in IN
Livability — Muncie
- Score
- 80/100
- State rank
- #18
- US rank
- #1654
Category grades
Schools grade is shown separately in the Schools card above.
Census & demographics
- Census place
- Muncie, IN
- County
- Delaware County · 84,658 people
- City population
- 84,658
- Metro
- Muncie, IN
- Population (ZIP)
- 31,237
- Household income
- $63,215
- Rent vs Own
- Severe rent burden
- 1141.0
Population outlook (Delaware County) Hauer SSP2
- Today (2025)
- 113,036 people
- By 2030
- 111,313 · -1.5%
- By 2040
- 106,432 · -5.8%
- By 2050
- 100,747 · -10.9%
- By 2075
- 91,000 · -19.5%
- By 2100
- 80,687 · -28.6%
Race, ethnicity, and origin ACS 2023
- Neighborhood character
- Predominantly White (85%)
- Race & ethnicity
- White 85% Two or more races 5% Black 4% Asian 4% Hispanic / Latino 3%
- Common ancestry
- Lithuanian 2% Romanian 2% Slovak 1%
- Foreign-born
- 5% · Canada, Vietnam, China
- Languages at home
- 94% English-only · Spanish 2% Other Indo-European 1% Vietnamese 1%
Political lean MEDSL · Delaware
- 2024 margin
- R (+15.8) · D 41.2% · R 57.0% · Other 1.8%
- 2008→2024 swing
- -30.8pp toward R · 2008: 15.0pp · 2024: -15.8pp
- All cycles
- 2024: R+15.8 2020: R+13.2 2016: R+13.7 2012: D+3.1 2008: D+15.0
Not yet ingested
- Civics
- —
Market trends
- HPI YoY
- ▼ -78.53%
- Current HPI
- 197.5213
- Rent YoY
- ▲ 8.08%
- Metro
- Muncie, IN
- State GDP YoY
- ▲ 2.90%
- F500 in state
- 18
Industry mix (Fortune 500 HQ in IN)
| Industry | F500 HQs | Revenue |
|---|---|---|
| Industrial Machinery | 2 | $37B |
|
||
| Healthcare | 1 | $177B |
|
||
| Pharmaceuticals | 1 | $45B |
|
||
| Metals / Steel | 1 | $18B |
|
||
| Agriculture | 1 | $17B |
|
||
| Packaging | 1 | $12B |
|
||
Price history
+75.2% since first listed6 events — show timeline
- 2026-02-27 Listed $140,000 IRMLS
- 2022-07-11 Sold (MLS) $133,500 IRMLS
- 2022-05-28 Delisted — IRMLS
- 2022-05-13 Listed $130,000 IRMLS
- 2014-10-15 Sold (MLS) $76,500 IRMLS
- 2014-04-29 Listed $79,900 IRMLS
Property tax history
-11.8%/yrLatest (2024): $964 · -0.8% YoY. Source: county tax records.
Cash-flow waterfall
monthlySold comps — $/sqft
last 12 mo · ≤1 miLoading sold comps…