 🏗️ New Construction
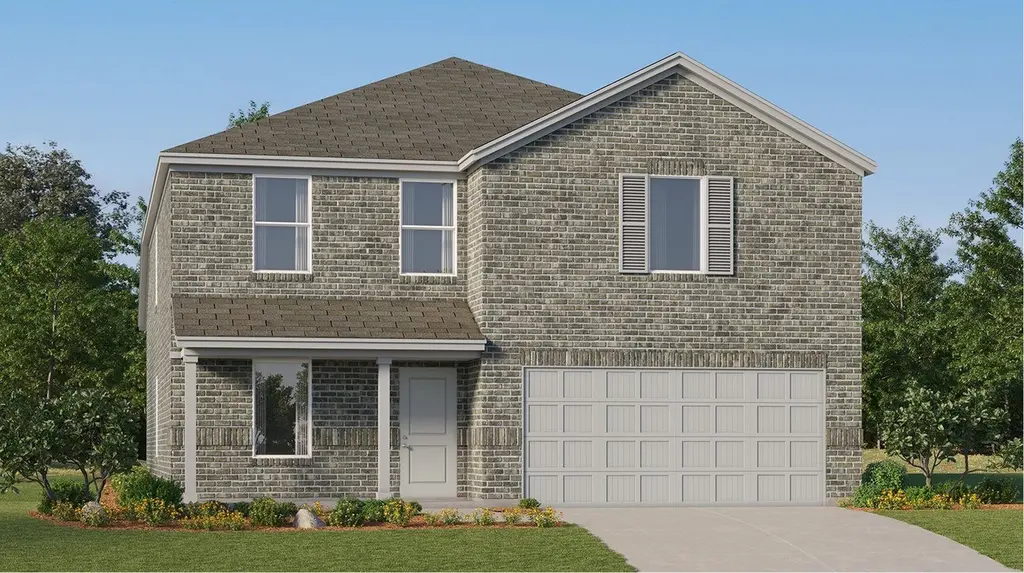
Sherman Plan · Pattison, TX
Flood risk No data
- FEMA flood zone
- —
- Chance of flooding over 30 yrs
- —
- Est. flood insurance / yr
- —
Fire risk No data
- Est. fire insurance / yr
- —
Heat risk No data
- Hot days now (above threshold)
- —
- Hot days in 30 yrs
- —
Wind risk No data
- Chance of severe wind over 30 yrs
- —
Air-quality risk No data
- Unhealthy air days now
- —
- Unhealthy air days in 30 yrs
- —
Risk factors via First Street. Map © Google.
Why this score? — see what drove the F grade
The composite is a weighted blend of 9 inputs, each scored 0–100. Each bar is that input's sub-score; the figure is the points it added to the 100-point composite (weight × sub-score).
- ARV discount +7.5/15.0
- Cash flow +6.9/30.0
- Condition / age +4.0/5.0
- Livability +3.2/5.0
- Rent growth +2.2/5.0
- Schools +2.0/10.0
- 1% rule +1.8/10.0
- DSCR +1.1/10.0
- Appreciation +0.0/10.0
$292,990
🖨 Deal sheet (PDF) 📄 Offer letter ✓ Due diligence
Listing remarks MLS
This new two-story home features a luxurious owner's suite on the first level, offering a tranquil retreat with a full bathroom and walk-in closet. A nearby open-concept layout encourages seamless transitions and multitasking between the kitchen, living and dining areas. On the second floor, a versatile game room provides a convenient shared living area near three additional bedrooms.
Key facts
- Full bathroom
- Walk-in closet
- Owner's suite
Tags
Neighborhood map
What this means for you Summary
Snapshot
- This is a 4-bed/2.5-bath single-family listed at $293k. Condition is rated good.
Deal economics
- At list price, monthly cash flow is $-523 ($-6k/yr) — negative.
- To cash-flow at today's rent, offer at most $272k (7.1% below list).
- To meet the 1% rule (rent ≥ 1% of price), the offer needs to be $238k (18.7% below list).
- Recommended offer: $238k (18.7% below list) — sets the bar for 1% rule.
Location & tenants
- Location reads 63/100 on livability (#876 in TX) — a middle-class / working-renter tenant base. Strengths: housing A+, crime A, cost of living A; Watch: amenities F, commute F, health & safety F.
- Royal ISD (rural): math 23% / reading 23% proficiency, ranked #744 of 826 in TX (top 90%) — low school quality limits family demand, transient renter base, plan for 1-2y turnover; 77% free/reduced lunch — lower-income household profile, screen leases tightly.
- Zoned schools: Royal El (math 27% / reading 20%, grade F, #3,247 of 4,322 statewide, top 76%, 762 students, 78% FRL); Royal J H (math 22% / reading 23%, grade F, #1,341 of 1,662 statewide, top 82%, 593 students, 73% FRL); Royal H S (math 17% / reading 26%, grade F, #1,377 of 1,632 statewide, top 85%, 842 students, 71% FRL) — zoned schools at 74% FRL track the district average.
- Market conditions: Rents soft (-1.0%/yr); 1014 active listings in the ZIP; solid renter incomes; 483 units permitted in Waller County in 2024 (89 in 5+ unit buildings).
- This rent runs 34% of the median local income ($84k/yr) — at the standard rent-burdened threshold; future hikes will face affordability resistance.
Forward outlook
- Local home prices are declining (-3.0%/yr); year-one equity from $2k of loan paydown is wiped out by about $10k of value loss. Plan a longer hold.
- Waller County population projected at +62% by 2050 — long-run rental-demand tailwind backs the buy-and-hold thesis.
Negotiation context
- It's been on market 216 days — a 12% lower offer ($258k) is reasonable based on typical stale-listing flexibility.
Questions for the listing agent
- What do current leases actually rent for vs. the listed asking? Can we see a recent rent roll and the last 12 months of T-12 income?
- It's been on market 216 days. Have you received any prior offers? Is the seller open to a 19% concession, seller financing, or rate buy-down credit?
- Why hasn't it sold? Are there any deal-killer items the seller is aware of (foundation, flood, title, zoning, code violations)?
- Is there a deadline driving the sale (1031 exchange, divorce, estate, relocation)? That informs how much negotiation room exists.
- Schools are F-rated, which usually means shorter tenancies and higher turnover. Who's the typical renter profile here, and what's been the actual vacancy rate?
- The area grade is low — what's the realistic commute time and amenity access for the typical tenant pool here? Any planned neighborhood developments (good or bad) we should know about?
- What's the average days-on-market for RENTAL listings here right now (not sales)? A rising rental-DOM trend means longer vacancies and softer asking-rent achievability than the comps imply.
- What's the recent tenant-quality profile in this submarket — average credit score on applications, eviction rate, late-payment / NSF rate, and stable-employment percentage? A property-management company in the area should have these aggregated.
- How much new for-sale + rental construction is in the pipeline within 1–3 miles? Heavy new supply typically softens prices + rents 12–24 months out; constrained supply supports both.
Investment metrics
- 1% rule
- 0.68% ✗
- Cap rate
- 4.49%
- Cash-on-cash
- -6.44%
- DSCR
- 0.71
- GRM
- 12.2
CMA / ARV
- ARV (median comp)
- $347,990
- List price
- $292,990
- Delta
- -15.81%
- Verdict
- UNDERPRICED
- Comps
- 20 within 1.0 mi
Show comp detail 12 sales within ~0.75 mi
| Address | Dist | Beds/Ba | Sqft | Sold | Price | $/sf | Match |
|---|---|---|---|---|---|---|---|
| 2074 Solstice Landing Dr | 0.20mi | 4/2.5 | 2,263 (0%) | 1mo | $346,990 | $153 | 90 |
| 2085 Blue Mar Dr | 0.16mi | 4/3.0 | 2,172 (-4%) | 1mo | $423,166 | $195 | 83 |
| 3036 Avalos Dr | 0.18mi | 4/3.0 | 2,410 (+6%) | 2mo | $404,990 | $168 | 77 |
| 3040 Helios Haven Dr | 0.13mi | 4/3.0 | 2,041 (-10%) | 0mo | $334,990 | $164 | 75 |
| 1136 Sunlit Cir | 0.50mi | 4/2.5 | 2,338 (+3%) | 0mo | $354,490 | $152 | 71 |
| 1088 Sunlit Cir | 0.49mi | 4/2.5 | 2,338 (+3%) | 2mo | $279,990 | $120 | 70 |
| 3041 Duskshine Dr | 0.37mi | 4/3.0 | 2,410 (+6%) | 1mo | $383,990 | $159 | 69 |
| 1040 Sunlit Cir | 0.38mi | 4/2.5 | 2,406 (+6%) | 4mo | $385,490 | $160 | 68 |
| 3000 Duskshine Dr | 0.33mi | 4/2.5 | 2,015 (-11%) | 0mo | $336,990 | $167 | 66 |
| 6414 Breakaway Grove Dr | 0.33mi | 4/2.5 | 2,015 (-11%) | 1mo | $349,990 | $174 | 66 |
| 1105 Sunlit Cir | 0.49mi | 4/2.5 | 2,406 (+6%) | 3mo | $360,040 | $150 | 64 |
| 3033 Duskshine Dr | 0.36mi | 4/2.0 | 1,924 (-15%) | 4mo | $331,990 | $173 | 53 |
Match score weights: distance 35% · size 25% · config 20% · recency 20%. Top-matched comps best support the ARV.
Projected returns pro-forma
-3.0% appreciation · 0.0% rent growth · sell at horizon
- IRR
- -30.8%
- Equity multiple
- 0.01×
- Total profit
- $-96,654
- Equity at exit
- $51,886
- IRR
- -53.4%
- Equity multiple
- -0.58×
- Total profit
- $-153,901
- Equity at exit
- $30,088
Cash invested: $97,437 (down + closing). Projections, not guarantees.
Landlord ↔ Tenant lean methodology
- Overall (STATE)
- 87 Strongly Landlord-Friendly
- State Texas
- 87 Strongly Landlord-Friendly · R+5
- County
- — inherits STATE
- City
- — inherits STATE
ZIP-level market 77423
- Rents YoY
- -1.0%
- Active inventory
- 1014
- Price-to-rent
- 10.3×
Monthly cashflow live
- Estimated rent
- $2,382 medium interval (Pro) →
- Mortgage (P&I)
- −$1,825
- Tax est. 1.5%
- −$435 /mo · $5,220/yr
- Insurance
- −$145
- HOA
- −$0
- Vacancy / Maint / Mgmt
- −$500
- Net cashflow
- $-523
Break-even live
Sensitivity live
| Price | -10% $-283 | -5% $-403 | +0% $-523 | +5% $-643 | +10% $-764 |
|---|---|---|---|---|---|
| Rent | -10% $-711 | -5% $-617 | +0% $-523 | +5% $-429 | +10% $-335 |
| Rate | -1.0pp $-348 | -0.5pp $-435 | base $-523 | +0.5pp $-613 | +1.0pp $-705 |
UW: 25.0% down · 7.5% · 30yr · 1.5% tax · 5.0% vac · 8.0% maint · 8.0% mgmt
Financing live
Cash to close
- Down payment
- $86,998
- Closing costs
- $10,440
- Reserves months
- —
- Total cash needed
- —
Loan-product check · same deal, 3 products live
Conventional
25% down · 7.5% · 30yr
- Down + closing
- —
- Monthly P&I
- —
- Monthly cashflow
- —
- DSCR
- —
- Eligible?
- —
Personal DTI + credit; lowest rate.
DSCR
20% down · 8.5% · 30yr
- Down + closing
- —
- Monthly P&I
- —
- Monthly cashflow
- —
- DSCR
- —
- Eligible?
- —
No personal income docs; deal must DSCR.
Hard money
10% down · 12.0% · 12mo
- Down + closing
- —
- Monthly P&I
- —
- Monthly cashflow
- —
- DSCR
- —
- Eligible?
- —
Short-term bridge; refi at stabilization.
Listing history 15 events
-
2026-06-21pricedays on market $292,990 Active 216 DOM
-
2026-06-18days on market $343,990 Active 213 DOM
-
2026-06-17days on market $343,990 Active 212 DOM
-
2026-06-16days on market $343,990 Active 211 DOM
-
2026-06-15days on market $343,990 Active 210 DOM
-
2026-06-13days on market $343,990 Active 208 DOM
-
2026-06-10days on market $343,990 Active 204 DOM
-
2026-06-08days on market $343,990 Active 203 DOM
-
2026-06-07days on market $343,990 Active 202 DOM
-
2026-06-04days on market $343,990 Active 199 DOM
-
2026-06-03days on market $343,990 Active 198 DOM
-
2026-06-02days on market $343,990 Active 197 DOM
-
2026-06-01days on market $343,990 Active 196 DOM
-
2026-05-31days on market $343,990 Active 195 DOM
-
2025-11-17$343,990 Active 387-char remark
Show marketing remark (387 chars)
This new two-story home features a luxurious owner's suite on the first level, offering a tranquil retreat with a full bathroom and walk-in closet. A nearby open-concept layout encourages seamless transitions and multitasking between the kitchen, living and dining areas. On the second floor, a versatile game room provides a convenient shared living area near three additional bedrooms.
ⓘ Source: listings_history table (triggers on properties + properties_extension) + one-shot
backfill from property_details.listing_events for pre-trigger history.
Nearby sold comps map
Loading sold comps map…
Walkable amenities ~0.75 mi
Loading nearby amenities…
Taxation est. · year 1
- Rental income
- $28,583
- − Mortgage interest
- −$19,493
- − Property taxes
- −$5,220
- − Insurance
- −$1,740
- − Repairs & maintenance
- −$2,287
- − Management
- −$2,287
- − Depreciation
- −$10,123
- Taxable loss
- −$12,566
- Est. tax savings @ 24.0%
- +$3,016
- After-tax cash flow
- $-3,262/yr
For passive investors: Depreciation is non-cash, so a rental often shows a tax loss while cash-flowing — sheltering income. Rental losses are passive: they offset passive income freely, and up to $25,000/yr can offset ordinary (W-2) income if you actively participate and your MAGI is under $100k (phasing out to $0 by $150k); unused losses carry forward. On sale, claimed depreciation is recaptured at up to 25%, and gains may owe capital-gains tax (a 1031 exchange can defer both). Figures are a year-1 estimate at your 24.0% rate — not tax advice; consult a CPA.
Condition & rehab AI · 12 photos
This two-story home features a luxurious owner's suite and a modern open-concept layout. The home is in good condition with minimal repairs needed, making it a great investment for both resale and rental.
Value-add opportunities
- Resale Paint the exterior brick — Enhances curb appeal and can add value
- Rental Replace curtains — Fresh curtains can make the space more inviting for renters
Renovation cost estimate screening
Value-add ROI direction
- Resale Paint the exterior brick — Enhances curb appeal and can add value ↑
- Rental Replace curtains — Fresh curtains can make the space more inviting for renters ↑
ⓘ Cost ranges are severity-bucket heuristics (US national rule-of-thumb). Get contractor quotes + a written scope before underwriting a rehab budget.
Schools (NCES district)
- District
- Royal ISD
- NCES district ID
- 4838190
- Math proficiency
- 23% ▼ -11.00%
- Reading proficiency
- 23% ▼ -6.00%
- Median HH income
- $41,059
- Composite
- 19.55/100
- National rank
- #8760
- State rank
- #744 of 826 in TX
Livability — Pattison
- Score
- 63/100
- State rank
- #876
- US rank
- #15789
Category grades
Schools grade is shown separately in the Schools card above.
Census & demographics
- County
- Waller County · 18,767 people
- City population
- 18,767
- Metro
- Houston-The Woodlands-Sugar Land, TX
- Population (ZIP)
- 18,767
- Household income
- $84,490
- Rent vs Own
- Severe rent burden
- 20.0
Population outlook (Waller County) Hauer SSP2
- Today (2025)
- 60,772 people
- By 2030
- 67,616 · +11.3%
- By 2040
- 82,283 · +35.4%
- By 2050
- 98,276 · +61.7%
- By 2075
- 142,860 · +135.1%
- By 2100
- 175,596 · +188.9%
Race, ethnicity, and origin ACS 2023
- Neighborhood character
- Diverse neighborhood (Simpson 0.64)
- Race & ethnicity
- Hispanic / Latino 41% White 41% Black 14% Two or more races 13% Asian 2% Native American 1%
- Hispanic origin (detail)
- Mexican 30% Cuban 2%
- Common ancestry
- Lithuanian 2% Italian 2% Slovak 1%
- Foreign-born
- 17% · Canada, China, Dominican Republic
- Languages at home
- 65% English-only · Spanish 32% French/Haitian/Cajun 1% Other Indo-European 1%
Political lean MEDSL · Waller
- 2024 margin
- Strong R (+25.0) · D 37.0% · R 62.0% · Other 1.0%
- 2008→2024 swing
- -17.9pp toward R · 2008: -7.2pp · 2024: -25.0pp
- All cycles
- 2024: R+25.0 2020: R+26.7 2016: R+28.6 2012: R+17.6 2008: R+7.2
Not yet ingested
- Civics
- —
Market trends
- HPI YoY
- ▼ -125.28%
- Current HPI
- 204.8709
- Rent YoY
- ▼ -1.01%
- Metro
- Houston-The Woodlands-Sugar Land, TX
- State GDP YoY
- ▲ 3.95%
- F500 in state
- 110
Industry mix (Fortune 500 HQ in TX)
| Industry | F500 HQs | Revenue |
|---|---|---|
| Energy | 16 | $1,198B |
|
||
| Technology | 5 | $198B |
|
||
| Engineering / Construction | 4 | $72B |
|
||
| Energy Services | 3 | $60B |
|
||
| Utilities | 3 | $41B |
|
||
| Healthcare | 2 | $330B |
|
||
Price history
1 event — show timeline
- 2025-11-17 Listed $343,990 Zillow
Cash-flow waterfall
monthlySold comps — $/sqft
last 12 mo · ≤1 miLoading sold comps…