9366 Talbert Aly #109 · Fountain Valley, CA
Flood risk No data
- FEMA flood zone
- —
- Chance of flooding over 30 yrs
- —
- Est. flood insurance / yr
- —
Fire risk No data
- Est. fire insurance / yr
- —
Heat risk No data
- Hot days now (above threshold)
- —
- Hot days in 30 yrs
- —
Wind risk No data
- Chance of severe wind over 30 yrs
- —
Air-quality risk No data
- Unhealthy air days now
- —
- Unhealthy air days in 30 yrs
- —
Risk factors via First Street. Map © Google.
Why this score? — see what drove the B grade
The composite is a weighted blend of 9 inputs, each scored 0–100. Each bar is that input's sub-score; the figure is the points it added to the 100-point composite (weight × sub-score).
- Cash flow +30.0/30.0
- 1% rule +10.0/10.0
- DSCR +10.0/10.0
- ARV discount +7.8/15.0
- Schools +6.5/10.0
- Condition / age +3.8/5.0
- Rent growth +3.3/5.0
- Livability +3.2/5.0
- Appreciation +0.0/10.0
$159,000
🖨 Deal sheet 📄 Offer letter ✓ Due diligence
Listing remarks
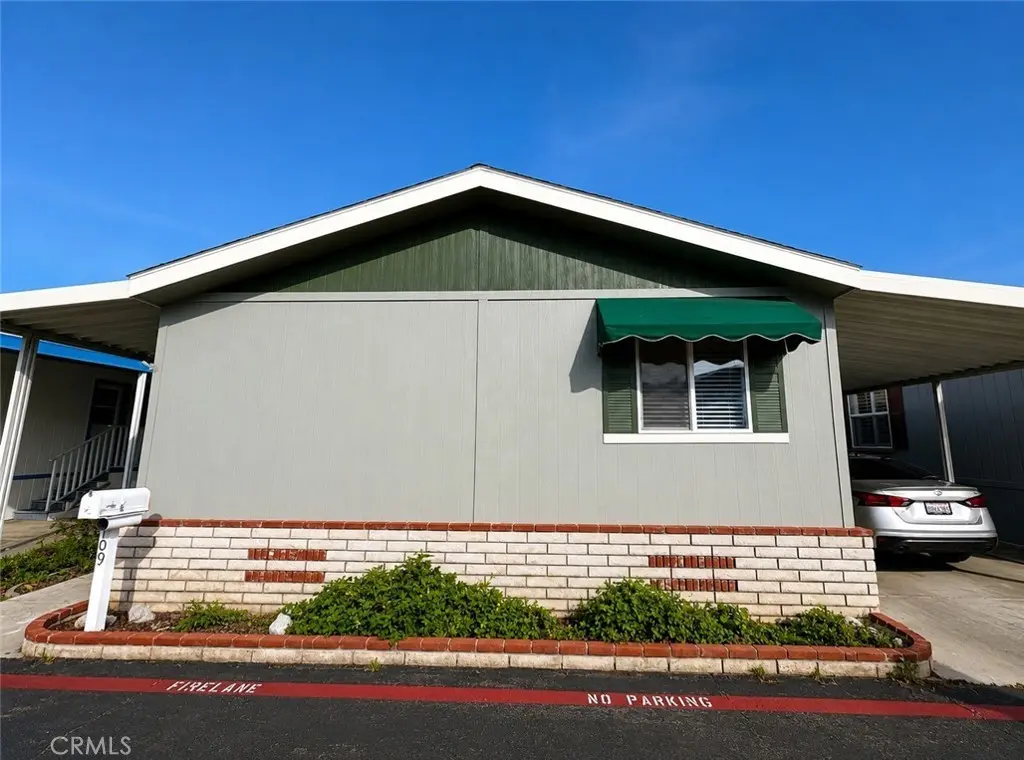
* * Spacious 3 Bedroom, 2 Bath Home in Highly Desirable Fountain Valley Community! * * Welcome to this beautiful and spacious home located in a highly sought-after community in Fountain Valley, conveniently near schools, shopping centers, and everyday amenities. This home features an open-concept kitchen with abundant cabinet space, perfect for cooking, entertaining, and storage. Large windows bring in plenty of natural light, creating a bright and inviting atmosphere throughout. The oversized primary bedroom offers comfort and privacy, complete with a spacious walk-in closet. With its functional layout and desirable location, this home is a fantastic opportunity for families or anyon
Key facts
- Large windows
- Open-concept kitchen
- Walk-in closet
Tags
Property features AI
Finance
- Financial info: Monthly land lease: $2,600
- HOA & community: Land lease community
Exterior
- Parking: 3 covered garage/parking spaces
- Utilities: Public sewer; District/public water
- Home design: Manufactured/mobile home; Single story; Front entry; Mobile home dimensions approximately 56' x 25'; Mobile home remains on site
- Construction: Year built per builder
- Exterior features: Community pool; Street lighting
Interior
- Flooring: Laminate flooring
- Bathrooms: 2 full bathrooms
- Interior features: Front entry; Single-level home
- Laundry & utility: Laundry room (separate)
Neighborhood map
What this means for you Summary
Snapshot
- This is a 3-bed/2.0-bath manufactured listed at $159k. Condition is rated good.
Deal economics
- At list price, monthly cash flow is $2k ($26k/yr) — positive.
- The deal already cash-flows at list — no discount required.
- Meets the 1% rule at list price ($4k rent vs $159k).
- Recommended offer: $157k (1.5% below list) — sets the bar for market timing.
- Cap rate 22.5% vs local median 2.0% in Fountain Valley — top-decile yield for the area; either an underpriced asset or a hidden risk that comps aren't pricing in. Stress-test before assuming the spread holds.
Location & tenants
- Location reads 64/100 on livability (#403 in CA) — a middle-class / working-renter tenant base. Strengths: employment A+, schools A, crime B; Watch: commute F, cost of living F, health & safety F.
- Huntington Beach Union High (suburban): math 65% / reading 82% proficiency, ranked #39 of 517 in CA (top 8%) — strong family-tenant draw, lease renewals of 3-5y typical.
- Market conditions: Rents rising (+3.1%/yr); 57 active listings in the ZIP; 36 comparable units currently listed for rent nearby; rentals leasing fast (median 2d on market — plan ~1-2 weeks tenant-placement turnaround); high-income renter base; 6,974 units permitted in Orange County in 2024 (3,839 in 5+ unit buildings).
- This rent runs 43% of the median local income ($115k/yr) — at the standard rent-burdened threshold; future hikes will face affordability resistance.
Forward outlook
- Local home prices are declining (-3.0%/yr); year-one equity from $1k of loan paydown is wiped out by about $5k of value loss. Plan a longer hold.
- Orange County population projected at +14% by 2050 — modest demand growth; plan on rents tracking national, not racing it.
- At projected returns (-3.0% appreciation + 3.1% rent growth), your $45k cash investment doubles in ~2 years — after that, you're playing with house money.
Negotiation context
- It's been on market 26 days — a 2% lower offer ($157k) is reasonable based on typical stale-listing flexibility.
Questions for the listing agent
- Is there a deadline driving the sale (1031 exchange, divorce, estate, relocation)? That informs how much negotiation room exists.
- Schools are A-rated — typically a magnet for longer-tenancy family renters. What's the average tenant stay here, and is there a school-zone premium baked into asking?
- What's the average days-on-market for RENTAL listings here right now (not sales)? A rising rental-DOM trend means longer vacancies and softer asking-rent achievability than the comps imply.
- What's the recent tenant-quality profile in this submarket — average credit score on applications, eviction rate, late-payment / NSF rate, and stable-employment percentage? A property-management company in the area should have these aggregated.
- How much new for-sale + rental construction is in the pipeline within 1–3 miles? Heavy new supply typically softens prices + rents 12–24 months out; constrained supply supports both.
Investment metrics
- 1% rule
- 2.59% ✓
- Cap rate
- 22.52%
- Cash-on-cash
- 57.94%
- DSCR
- 3.58
- GRM
- 3.2
CMA / ARV
- ARV (on-the-fly)
- $159,936
- Comps found
- 12
Show comp detail 12 sales within ~0.75 mi
| Address | Dist | Beds/Ba | Sqft | Sold | Price | $/sf | Match |
|---|---|---|---|---|---|---|---|
| 201 Road Runner | 0.25mi | 3/2.0 | 1,344 (0%) | 3mo | $87,000 | $65 | 86 |
| 203 Parrot Ln | 0.05mi | 3/2.0 | 1,440 (+7%) | 8mo | $170,000 | $118 | 79 |
| 101 Myna Ln | 0.27mi | 2/2.0 (-1) | 1,334 (-1%) | 8mo | $159,000 | $119 | 74 |
| 108 Pigeon Ln | 0.05mi | 3/2.0 | 1,512 (+12%) | 5mo | $170,000 | $112 | 72 |
| 130 Sumac Ln | 0.16mi | 3/2.0 | 1,240 (-8%) | 9mo | $148,000 | $119 | 72 |
| 310 Magpie | 0.33mi | 3/2.0 | 1,440 (+7%) | 2mo | $195,000 | $135 | 71 |
| 124 Sumac Ln | 0.13mi | 4/2.0 (+1) | 1,419 (+6%) | 11mo | $176,000 | $124 | 71 |
| 209 Road Runner | 0.25mi | 3/2.0 | 1,512 (+12%) | 2mo | $165,000 | $109 | 66 |
| 411 Gold Finch Ln | 0.32mi | 3/2.0 | 1,506 (+12%) | 1mo | $240,000 | $159 | 64 |
| 715 Catalpa Ln | 0.37mi | 2/2.0 (-1) | 1,440 (+7%) | 6mo | $125,000 | $87 | 61 |
| 907 Ironwood | 0.44mi | 3/2.0 | 1,200 (-11%) | 2mo | $235,000 | $196 | 60 |
| 302 Magpie Ln | 0.33mi | 3/2.0 | 1,520 (+13%) | 14mo | $265,000 | $174 | 51 |
Match score weights: distance 35% · size 25% · config 20% · recency 20%. Top-matched comps best support the ARV.
Projected returns pro-forma
-3.0% appreciation · 3.12% rent growth · sell at horizon
- IRR
- 56.6%
- Equity multiple
- 3.51×
- Total profit
- $111,712
- Equity at exit
- $23,707
- IRR
- 61.6%
- Equity multiple
- 7.20×
- Total profit
- $275,878
- Equity at exit
- $13,747
Cash invested: $44,520 (down + closing). Projections, not guarantees.
Landlord ↔ Tenant lean methodology
- Overall (STATE)
- 18 Strongly Tenant-Friendly
- State California
- 18 Strongly Tenant-Friendly · D+13
- County
- — inherits STATE
- City
- — inherits STATE
ZIP-level market 92708
- Rents YoY
- 3.1%
- Active inventory
- 57
- Price-to-rent
- 3.2×
Monthly cashflow live
- Estimated rent
- $4,112 high interval (Pro) →
- Mortgage (P&I)
- −$834
- Tax est. 1.5%
- −$199 /mo · $2,385/yr
- Insurance
- −$66
- HOA
- −$0
- Vacancy / Maint / Mgmt
- −$864
- Net cashflow
- $2,150
Break-even live
UW: 25.0% down · 7.5% · 30yr · 1.5% tax · 5.0% vac · 8.0% maint · 8.0% mgmt
Financing live
Cash to close
- Down payment
- $39,750
- Closing costs
- $4,770
- Reserves months
- —
- Total cash needed
- —
Loan-product check · same deal, 3 products live
Conventional
25% down · 7.5% · 30yr
- Down + closing
- —
- Monthly P&I
- —
- Monthly cashflow
- —
- DSCR
- —
- Eligible?
- —
Personal DTI + credit; lowest rate.
DSCR
20% down · 8.5% · 30yr
- Down + closing
- —
- Monthly P&I
- —
- Monthly cashflow
- —
- DSCR
- —
- Eligible?
- —
No personal income docs; deal must DSCR.
Hard money
10% down · 12.0% · 12mo
- Down + closing
- —
- Monthly P&I
- —
- Monthly cashflow
- —
- DSCR
- —
- Eligible?
- —
Short-term bridge; refi at stabilization.
Rent comps 36 comps
| Address | Beds | Baths | Sqft | Rent | $/sqft | DOM | Units | Dist |
|---|---|---|---|---|---|---|---|---|
| 9213 El Tango Cir Fountain Valley, CA | 3.0 | 3.0 | 1670 | $4,800 | $2.87 | 1d | 1 | 0.15mi |
| 18131 S 3rd St Fountain Valley, CA | 3.0 | 2.0 | 1254 | $5,000 | $3.99 | 1d | 1 | 0.31mi |
| 9595 Toucan Ave Fountain Valley, CA | 3.0 | 2.5 | 1548 | $4,200 | $2.71 | 17d | 1 | 0.41mi |
| 18236 Sanmian Ct Fountain Valley, CA | 3.0 | 3.0 | 1690 | $4,100 | $2.43 | 22d | 1 | 0.53mi |
| 9580 El Rey Ave Fountain Valley, CA | 1.0–2.0 | 1.0–2.0 | 908 | $3,469 | $3.82 | 1d | 10 | 0.58mi |
| 9704 Lark Cir Fountain Valley, CA | 4.0 | 2.5 | 1528 | $4,600 | $3.01 | 22d | 1 | 0.63mi |
| 8579 Volga River Cir Fountain Valley, CA | 3.0 | 2.0 | 1425 | $3,500 | $2.46 | 24d | 1 | 0.81mi |
| 18091 Newland St Huntington Beach, CA | 4.0 | 2.0 | 1200 | $5,950 | $4.96 | 1d | 1 | 0.86mi |
| 17375 Brookhurst St Fountain Valley, CA | 1.0–2.0 | 1.0 | 860 | $2,720 | $3.16 | 1d | 5 | 0.86mi |
| 10220 El Monterey Ave Fountain Valley, CA | 3.0 | 2.0 | 1820 | $5,000 | $2.75 | 15d | 1 | 0.92mi |
| 10220 El Monterey Ave Fountain Valley, CA | 3.0 | 2.0 | 1820 | $5,000 | $2.75 | 17d | 1 | 0.92mi |
| 17025 Buttonwood St Fountain Valley, CA | 3.0 | 2.0 | 1805 | $4,999 | $2.77 | 11d | 1 | 0.98mi |
| 18341 Gum Tree Ln Huntington Beach, CA | 3.0 | 2.5 | 1658 | $4,500 | $2.71 | 3d | 1 | 0.99mi |
| 8402 Slater Ave Huntington Beach, CA | 2.0 | 1.0 | 900 | $3,200 | $3.56 | 1d | 1 | 1.01mi |
| 9440 Clover Ave Fountain Valley, CA | 1.0–2.0 | 1.0–2.0 | 863 | $2,718 | $3.15 | 1d | 4 | 1.03mi |
| 18229 Olympic Ct Fountain Valley, CA | 3.0 | 2.0 | 1144 | $4,300 | $3.76 | 1d | 1 | 1.04mi |
| 8945 Riverbend Dr Huntington Beach, CA | 1.0–2.0 | 1.0–2.0 | 772 | $3,574 | $4.63 | 1d | 3 | 1.15mi |
| 17570 Van Buren Ln Huntington Beach, CA | 3.0 | 2.5 | 1269 | $3,950 | $3.11 | 1d | 1 | 1.17mi |
| 10441 Slater Ave Fountain Valley, CA | 1.0–2.0 | 1.0–2.0 | 911 | $3,167 | $3.48 | 1d | 23 | 1.22mi |
| 9021 Hyde Park Dr Huntington Beach, CA | 4.0 | 2.5 | 1818 | $5,750 | $3.16 | 1d | 1 | 1.25mi |
| 9022 Hyde Park Dr Huntington Beach, CA | 4.0 | 2.5 | 1868 | $4,995 | $2.67 | 24d | 1 | 1.28mi |
| 10244 Warner Ave Fountain Valley, CA | 1.0–2.0 | 1.0–2.0 | 861 | $3,279 | $3.81 | 1d | 22 | 1.29mi |
| 17610 Cameron Ln Unit H Huntington Beach, CA | 2.0 | 2.5 | 1020 | $2,700 | $2.65 | 1d | 1 | 1.30mi |
| 10636 La Perla Ave Unit A Fountain Valley, CA | 2.0 | 2.0 | 935 | $3,150 | $3.37 | 1d | 1 | 1.31mi |
| 16708 Redwood St Fountain Valley, CA | 4.0 | 4.0 | 1838 | $7,500 | $4.08 | 2d | 1 | 1.33mi |
| 10320 Warner Ave Fountain Valley, CA | 1.0–2.0 | 1.0 | 851 | $2,750 | $3.23 | 1d | 1 | 1.38mi |
| 7881 Beachpoint Cir Unit BD19 Huntington Beach, CA | 2.0 | 2.0 | 1006 | $3,225 | $3.21 | 14d | 1 | 1.40mi |
| 8081 Holland Dr Huntington Beach, CA | 1.0–2.0 | 1.0 | 790 | $2,878 | $3.64 | 1d | 9 | 1.40mi |
| 19282 Salmon Ln Huntington Beach, CA | 2.0 | 1.0 | 896 | $4,500 | $5.02 | 2d | 1 | 1.41mi |
| 7901 Newman Ave Apt C Huntington Beach, CA | 2.0 | 2.0 | 900 | $2,425 | $2.69 | 1d | 1 | 1.43mi |
| 18661 Libra Cir Apt 3 Huntington Beach, CA | 2.0 | 2.0 | 900 | $2,500 | $2.78 | 15d | 1 | 1.43mi |
| 18671 Libra Cir Apt 3 Huntington Beach, CA | 2.0 | 2.0 | 900 | $2,500 | $2.78 | 3d | 1 | 1.43mi |
| 19343 McLaren Ln Huntington Beach, CA | 3.0 | 2.0 | 1654 | $4,000 | $2.42 | 24d | 1 | 1.44mi |
| 8200 Warner Ave Huntington Beach, CA | 2.0 | 1.0 | 937 | $2,800 | $2.99 | 1d | 3 | 1.45mi |
| 7882 Orchid Dr Huntington Beach, CA | 3.0 | 2.5 | 1868 | $4,995 | $2.67 | 10d | 1 | 1.45mi |
| 7811 Talbert Ave Huntington Beach, CA | 2.0 | 1.0 | 950 | $2,969 | $3.13 | 1d | 1 | 1.48mi |
Listing history 15 events
-
2026-06-18days on market $159,000 Active 26 DOM
-
2026-06-17days on market $159,000 Active 25 DOM
-
2026-06-16days on market $159,000 Active 24 DOM
-
2026-06-15days on market $159,000 Active 23 DOM
-
2026-06-13days on market $159,000 Active 21 DOM
-
2026-06-13days on market $159,000 Active 20 DOM
-
2026-06-09days on market $159,000 Active 17 DOM
-
2026-06-08days on market $159,000 Active 16 DOM
-
2026-06-07days on market $159,000 Active 15 DOM
-
2026-06-04days on market $159,000 Active 12 DOM
-
2026-06-03days on market $159,000 Active 11 DOM
-
2026-06-02days on market $159,000 Active 10 DOM
-
2026-06-01days on market $159,000 Active 9 DOM
-
2026-05-31days on market $159,000 Active 8 DOM
-
2026-05-23$159,000 Active
ⓘ Source: listings_history table (triggers on properties + properties_extension) + one-shot
backfill from property_details.listing_events for pre-trigger history.
Nearby sold comps map
Loading sold comps map…
Walkable amenities ~0.75 mi
Loading nearby amenities…
Taxation est. · year 1
- Rental income
- $49,345
- − Mortgage interest
- −$8,906
- − Property taxes
- −$2,385
- − Insurance
- −$795
- − Repairs & maintenance
- −$3,948
- − Management
- −$3,948
- − Depreciation
- −$4,625
- Taxable income
- $24,738
- Est. tax owed @ 24.0%
- −$5,937
- After-tax cash flow
- $19,860/yr
For passive investors: Depreciation is non-cash, so a rental often shows a tax loss while cash-flowing — sheltering income. Rental losses are passive: they offset passive income freely, and up to $25,000/yr can offset ordinary (W-2) income if you actively participate and your MAGI is under $100k (phasing out to $0 by $150k); unused losses carry forward. On sale, claimed depreciation is recaptured at up to 25%, and gains may owe capital-gains tax (a 1031 exchange can defer both). Figures are a year-1 estimate at your 24.0% rate — not tax advice; consult a CPA.
Condition & rehab AI · 6 photos
This home is in good condition with a good layout and desirable location. It has a good potential for increasing value with some exterior painting and awning replacement.
Value-add opportunities
- Both Paint the exterior walls — Enhances curb appeal and can increase both resale and rental value.
- Both Replace the awning if it's worn out — Improves curb appeal and can increase both resale and rental value.
Renovation cost estimate screening
Value-add ROI direction
- Both Paint the exterior walls — Enhances curb appeal and can increase both resale and rental value. ↑
- Both Replace the awning if it's worn out — Improves curb appeal and can increase both resale and rental value. ↑
ⓘ Cost ranges are severity-bucket heuristics (US national rule-of-thumb). Get contractor quotes + a written scope before underwriting a rehab budget.
Schools (NCES district)
- District
- Huntington Beach Union High
- NCES district ID
- 0618060
- Math proficiency
- 65% ▲ 17.00%
- Reading proficiency
- 82% ▲ 8.00%
- Median HH income
- $78,159
- Composite
- 64.9/100
- National rank
- #511
- State rank
- #39 of 517 in CA
Livability — Fountain Valley
- Score
- 64/100
- State rank
- #403
- US rank
- #13744
Category grades
Schools grade is shown separately in the Schools card above.
Census & demographics
- Census place
- Fountain Valley, CA
- County
- Orange County · 3,096,323 people
- City population
- 56,258
- Metro
- Los Angeles-Long Beach-Anaheim, CA
- Population (ZIP)
- 56,258
- Household income
- $115,237
- Rent vs Own
- Severe rent burden
- 1924.0
Population outlook (Orange County) Hauer SSP2
- Today (2025)
- 3,477,456 people
- By 2030
- 3,613,117 · +3.9%
- By 2040
- 3,835,945 · +10.3%
- By 2050
- 3,968,736 · +14.1%
- By 2075
- 4,097,053 · +17.8%
- By 2100
- 3,903,633 · +12.3%
Race, ethnicity, and origin ACS 2023
- Neighborhood character
- Diverse neighborhood (Simpson 0.69)
- Race & ethnicity
- White 38% Asian 37% Hispanic / Latino 17% Two or more races 13% Black 1%
- Hispanic origin (detail)
- Mexican 13%
- Common ancestry
- Italian 2% Romanian 1% Lithuanian 1%
- Foreign-born
- 32% · Vietnam, Canada, China
- Languages at home
- 54% English-only · Vietnamese 22% Spanish 10% Arabic 4%
Political lean MEDSL · Orange
- 2024 margin
- Toss-up / Even · D 49.7% · R 47.1% · Other 3.2%
- 2008→2024 swing
- +5.2pp toward D · 2008: -2.6pp · 2024: 2.6pp
- All cycles
- 2024: D+2.6 2020: D+9.0 2016: D+7.7 2012: R+8.3 2008: R+2.6
Not yet ingested
- Civics
- —
Market trends
- HPI YoY
- ▼ -928.61%
- Current HPI
- 462.4337
- Rent YoY
- ▲ 3.12%
- Metro
- Los Angeles-Long Beach-Anaheim, CA
- State GDP YoY
- ▲ 3.21%
- F500 in state
- 116
Industry mix (Fortune 500 HQ in CA)
| Industry | F500 HQs | Revenue |
|---|---|---|
| Technology | 27 | $1,492B |
|
||
| Financial Services | 3 | $174B |
|
||
| Retail | 3 | $44B |
|
||
| Insurance | 3 | $26B |
|
||
| Media / Entertainment | 2 | $115B |
|
||
| Pharmaceuticals / Biotech | 2 | $62B |
|
||
Price history
1 event — show timeline
- 2026-05-23 Listed $159,000 CRMLS
Cash-flow waterfall
monthlySold comps — $/sqft
last 12 mo · ≤1 miLoading sold comps…